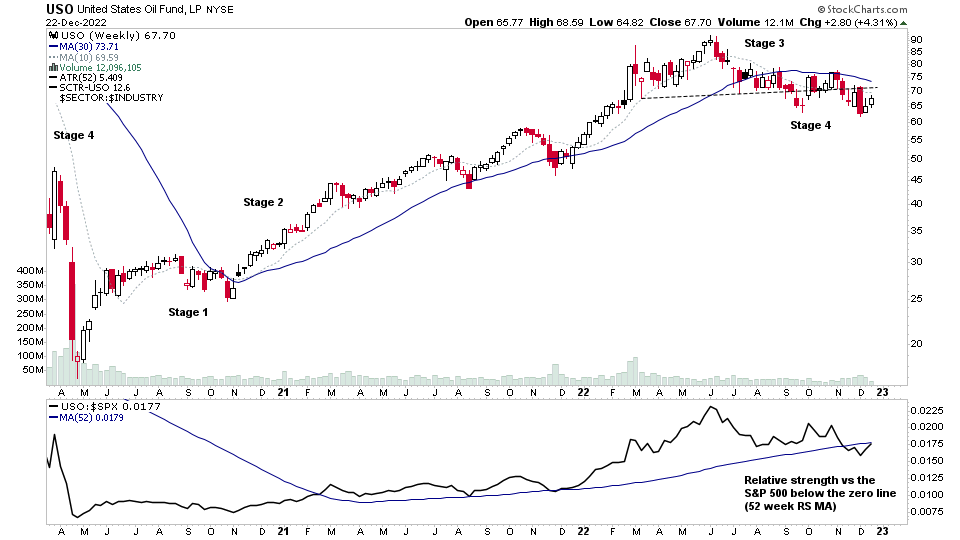
A major theme showing up in the scans of the technically weak stocks and etfs was the large amount of Oil stocks in late Stage 3, and hence vulnerable to potential Stage 4 breakdowns in the near future...
Read More

Blog
Finding stocks with the best potential can be difficult. For many years now I've created the US Stocks Watchlist to try and find the stocks that meet the Stage Analysis method criteria and that are near to potential entry points in the coming days, weeks or months. i.e they may be in late Stage 1 developing a Wyckoff Spring or breaking out in early Stage 2 on strong relative volume, or tightening up with Volatility Contraction Pattern (VCP) characteristics in a re-accumulation base after having a strong Stage 2 advance.
Disclaimer: This is not a stock alerts service. We won’t tell you what stocks to buy or sell. But if you follow the watchlist it may give you ideas for your own trades and save you countless hours, by giving you a more refined starting point for your own stock research.
Non-members
To see all the watchlist posts and other premium content, such as regular detailed videos and exclusive Stage Analysis tools, become a member
Join Today
22 December, 2022
Technically Weak US Stocks / ETFs & Industry Groups – 22 December 2022
21 December, 2022
Stage Analysis Members Video – 21 December 2022 (56mins)
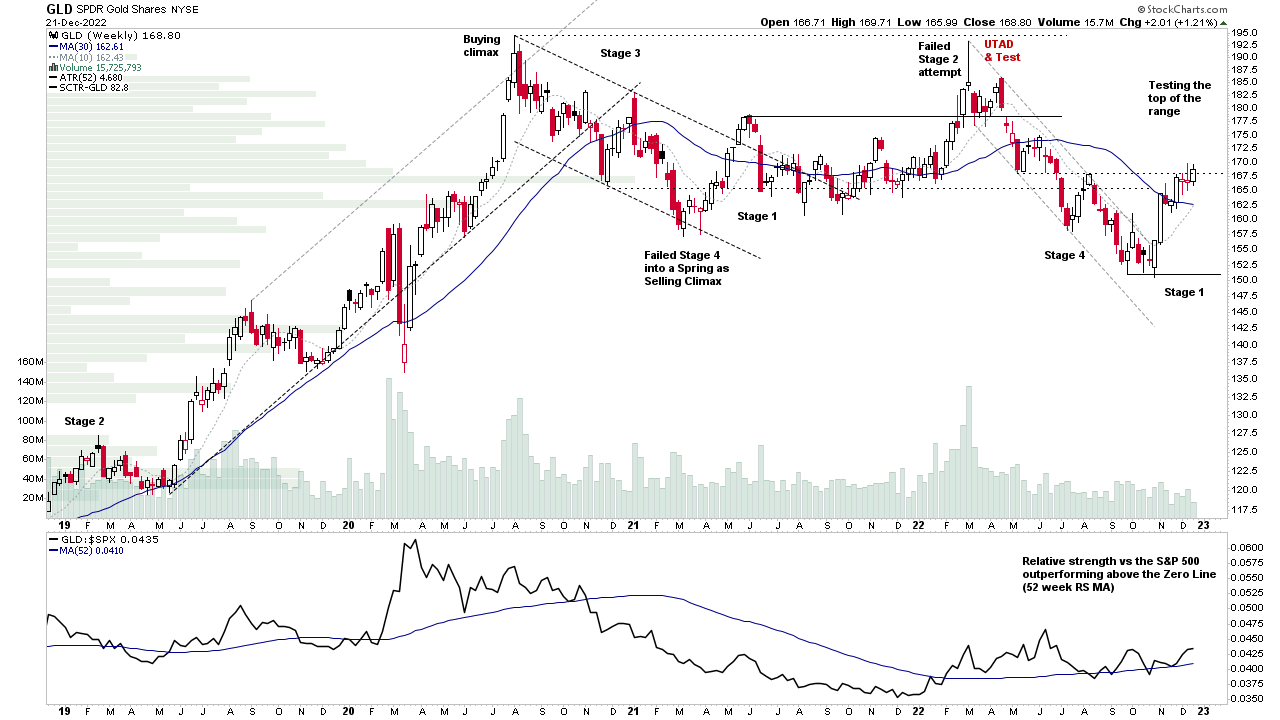
The Stage Analysis members midweek video discussing Gold, Silver & The US Dollar, the S&P 500 & Nasdaq 100 Equal Weight Comparisons, short-term market breadth indicators and the US watchlist stocks in more detail with live markups of the individual stocks and group themes.
Read More
20 December, 2022
US Stocks Watchlist – 20 December 2022
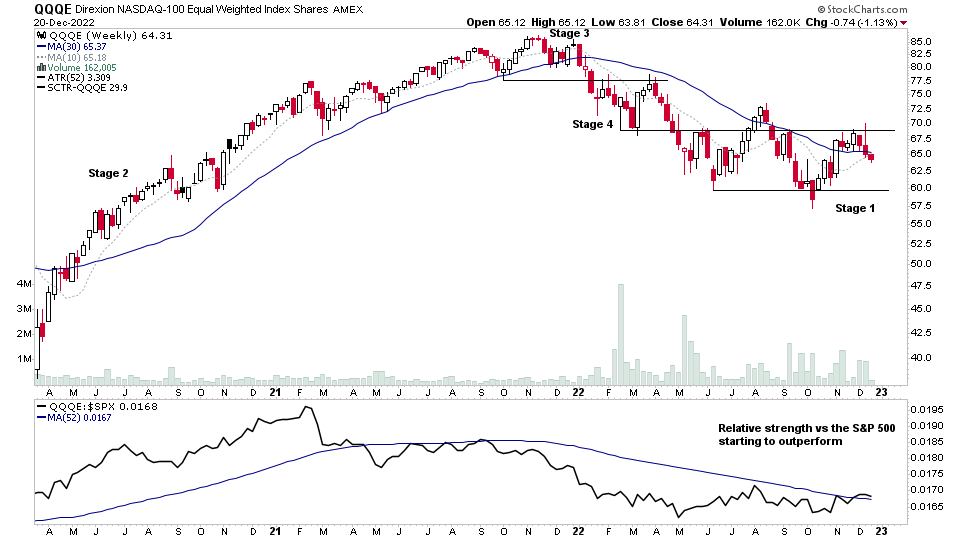
The equal weighted index of the Nasdaq 100 is note worthy currently as it is outperforming the regular Nasdaq 100 by around +6%, as it is still around +12% above the October 13th spring low, whereas the regular Nasdaq 100 is only around +6% above it...
Read More
18 December, 2022
Stage Analysis Members Video – 18 December 2022 (1hr 23mins)
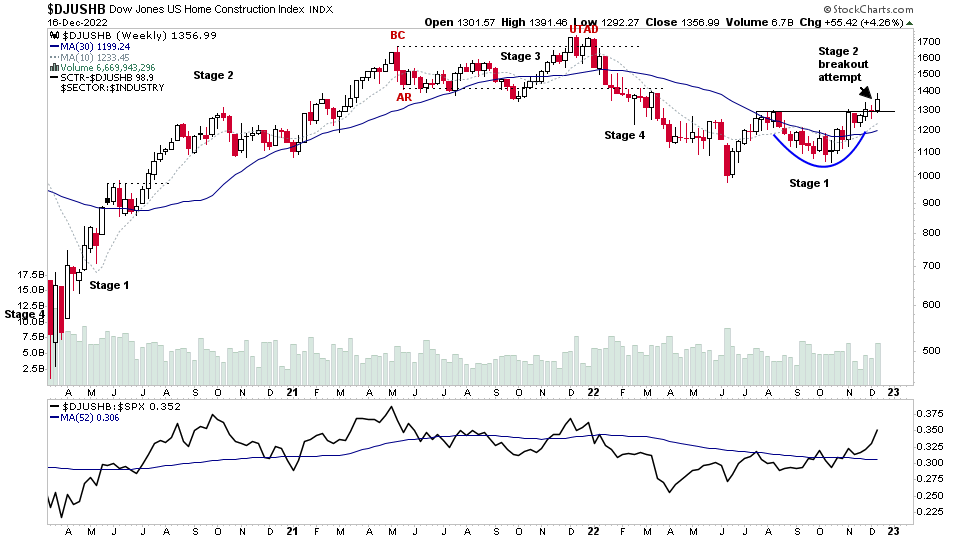
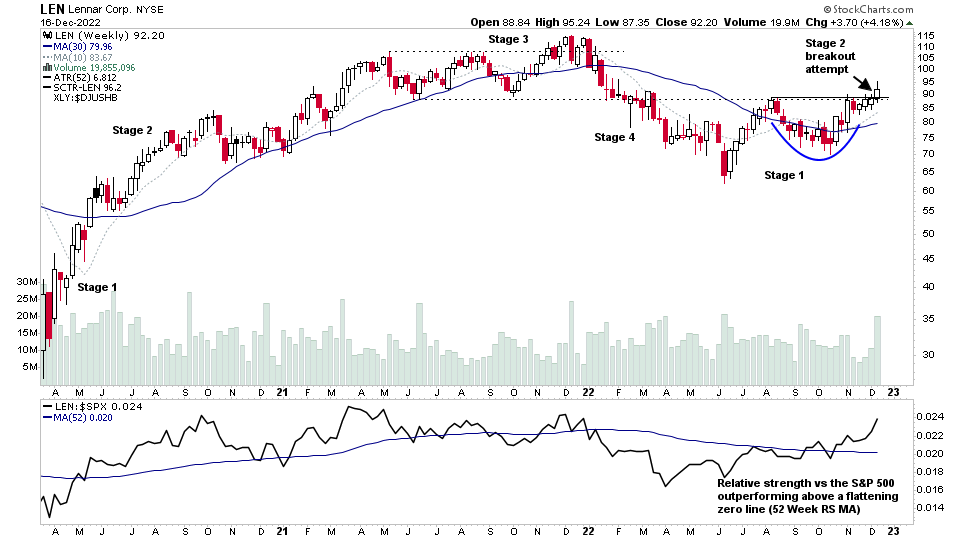
The Stage Analysis members weekend video begins this week with a special focus on the Home Construction Group stocks, of which multiple stocks within the group made a Stage 2 breakout attempt this week against the weak market action...
Read More
18 December, 2022
US Stocks Watchlist – 18 December 2022
For the watchlist from the weekend scans...
Read More
15 December, 2022
Most Vulnerable US Stocks & ETFs – 15 December 2022
This is the first post of a new weekly regular feature focusing on some of the most vulnerable issues in the US market, in order to get a broader picture of the overall market health and contribute valuable information to our Weight of Evidence – which is the key to successfully using Stan Weinstein's Stage Analysis method.
Read More
14 December, 2022
Stage Analysis Members Video – 14 December 2022 (1hr 2 mins)
The Stage Analysis members midweek video discussing the S&P 500, VIX and the Dollar Index, short-term market breadth indicators and the US watchlist stocks in more detail with live markups of the individual stocks and group themes.
Read More
14 December, 2022
US Stocks Watchlist – 14 December 2022
I'll talk through the watchlist stocks and group themes from the last few days in detail on multiple timeframes during the Stage Analysis midweek video, which will be posted later today (Wednesday).
Read More
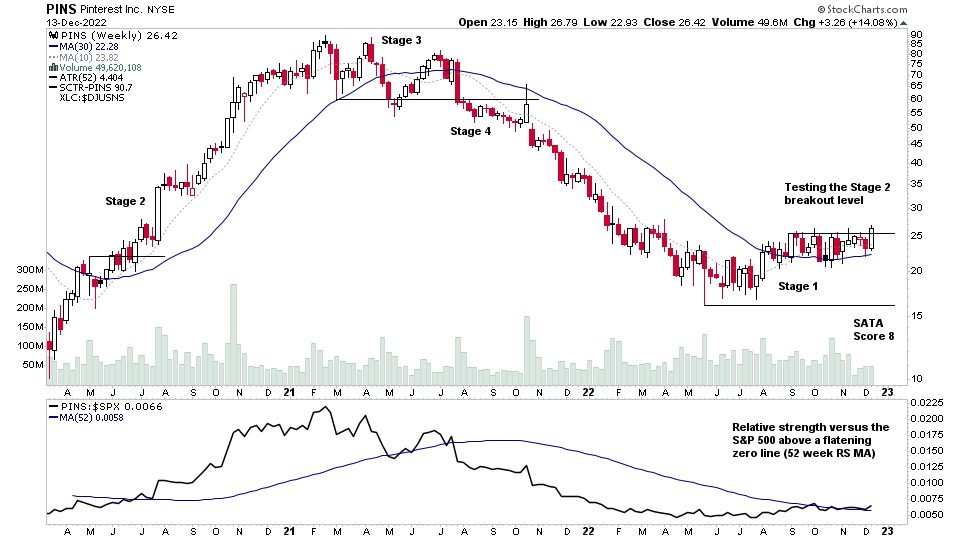
13 December, 2022
US Stocks Watchlist – 13 December 2022
Semiconductors continues to be the main group theme with more stocks in the group testing the Stage 2 breakout level today, but pulling back with the intraday market weakness.
Read More
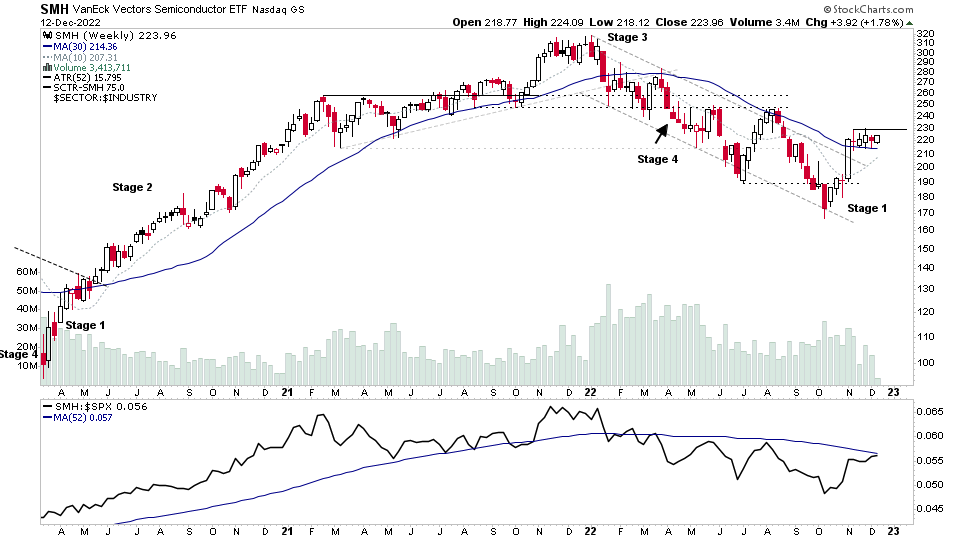
12 December, 2022
US Stocks Watchlist – 12 December 2022
Technology, Industrial and Consumer Discretionary sector groups make up the bulk of todays highlighted stocks, with Semiconductors having the most results, including the group etf – SMH, which has been consolidating above its 30 week MA for the last 6 weeks now, and the 30 week MA has started to flatten out, and the Stage Analysis Technical Attributes (SATA) score has improved to a 6. Hence, the group is in position for a potential Stage 2 breakout attempt if market conditions are favourable.
Read More