Blog

US Stocks Watchlist

Finding stocks with the best potential can be difficult. For many years now I've created the US Stocks Watchlist to try and find the stocks that meet the Stage Analysis method criteria and that are near to potential entry points in the coming days, weeks or months. i.e they may be in late Stage 1 developing a Wyckoff Spring or breaking out in early Stage 2 on strong relative volume, or tightening up with Volatility Contraction Pattern (VCP) characteristics in a re-accumulation base after having a strong Stage 2 advance.

Disclaimer: This is not a stock alerts service. We won’t tell you what stocks to buy or sell. But if you follow the watchlist it may give you ideas for your own trades and save you countless hours, by giving you a more refined starting point for your own stock research.

Non-members
To see all the watchlist posts and other premium content, such as regular detailed videos and exclusive Stage Analysis tools, become a member

Join Today

US Stocks Watchlist – 14 December 2022

I'll talk through the watchlist stocks and group themes from the last few days in detail on multiple timeframes during the Stage Analysis midweek video, which will be posted later today (Wednesday).
Read More

US Stocks Watchlist – 12 December 2022

Technology, Industrial and Consumer Discretionary sector groups make up the bulk of todays highlighted stocks, with Semiconductors having the most results, including the group etf – SMH, which has been consolidating above its 30 week MA for the last 6 weeks now, and the 30 week MA has started to flatten out, and the Stage Analysis Technical Attributes (SATA) score has improved to a 6. Hence, the group is in position for a potential Stage 2 breakout attempt if market conditions are favourable.
Read More

Stage Analysis Members Video – 11 December 2022 (1hr 5mins)

The Stage Analysis members weekend video discussing the market breadth charts to determine the weight of evidence, IBD industry group bell curve – percentage above 30 week MA and the bullish percent, industry groups relative strength, market indexes, and the US watchlist stocks in detail on multiple timeframes.
Read More

S&P 500 Update and the US Stocks Watchlist – 6 December 2022

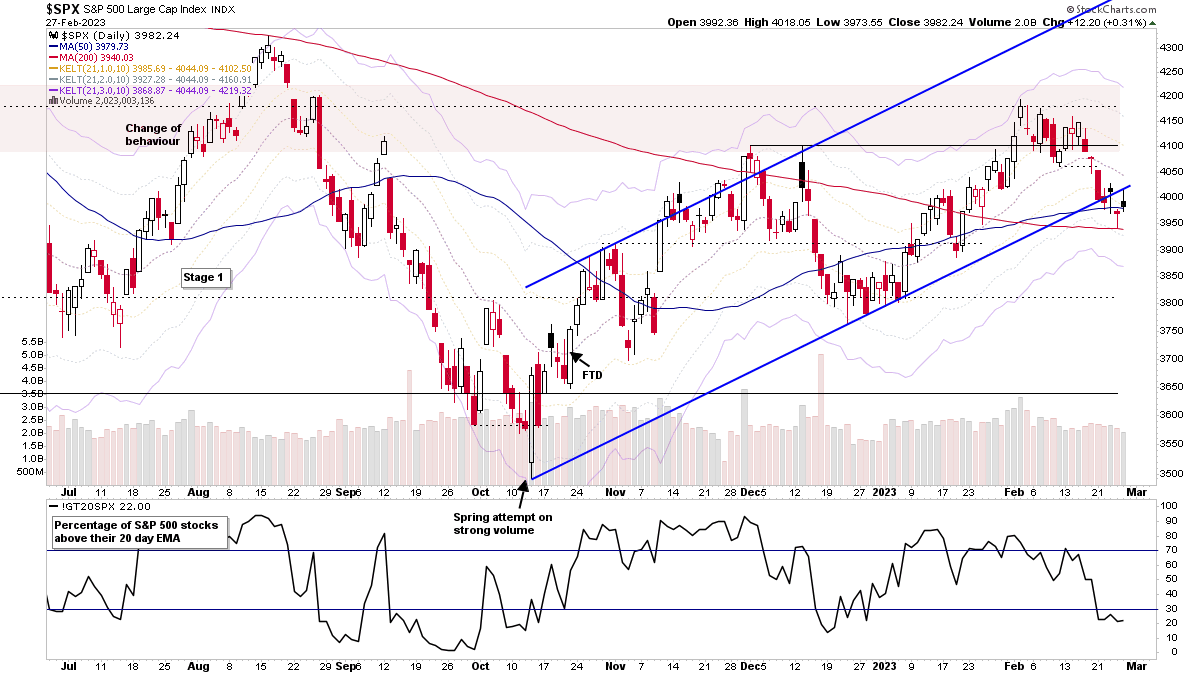
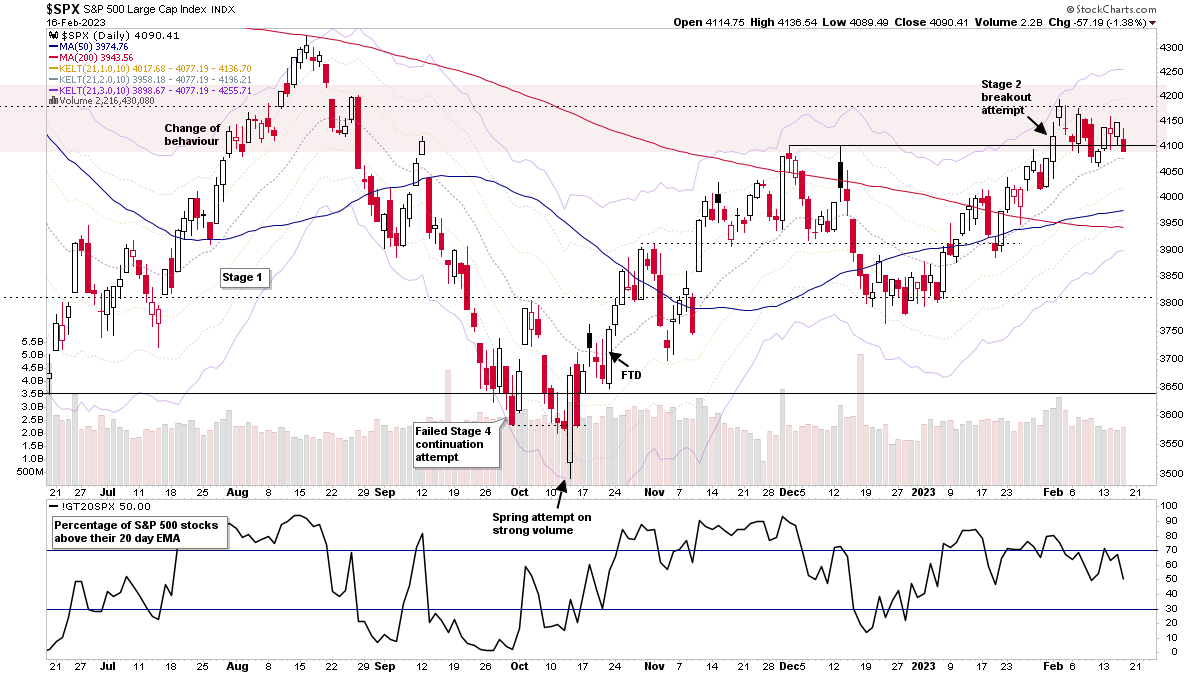
The S&P 500 closed below its short-term 21 day EMA and also the horizontal Volume Point of Control (VPOC) today, as it tested towards the lows of the two most recent swing lows and the early November swing high. But found a small amount of support in the final few hours to close off of the low of the day and just above the recent swing low.
Read More

Stage Analysis Members Video – 4 December 2022 (1hr 27mins)

The Stage Analysis members weekend video discussing the market indexes, Dollar index, commodities, industry groups relative strength, IBD industry group bell curve – bullish percent, market breadth charts to determine the weight of evidence, Stage 2 breakout attempts and the US watchlist stocks in detail on multiple timeframes.
Read More