Blog

US Stocks Watchlist

Finding stocks with the best potential can be difficult. For many years now I've created the US Stocks Watchlist to try and find the stocks that meet the Stage Analysis method criteria and that are near to potential entry points in the coming days, weeks or months. i.e they may be in late Stage 1 developing a Wyckoff Spring or breaking out in early Stage 2 on strong relative volume, or tightening up with Volatility Contraction Pattern (VCP) characteristics in a re-accumulation base after having a strong Stage 2 advance.

Disclaimer: This is not a stock alerts service. We won’t tell you what stocks to buy or sell. But if you follow the watchlist it may give you ideas for your own trades and save you countless hours, by giving you a more refined starting point for your own stock research.

Non-members
To see all the watchlist posts and other premium content, such as regular detailed videos and exclusive Stage Analysis tools, become a member

Join Today

Stage Analysis Members Video – 26 March 2023 (1hr 20mins)

The Stage Analysis members weekend video with the Major Indexes Update, Futures, Sector Breadth, US Stocks Industry Groups RS Rankings, IBD Industry Groups Bell Curve – Bullish Percent, Market Breadth Update – Weight of Evidence and the US Watchlist Stocks in detail with live markups on multiple timeframes...
Read More

US Stocks Watchlist – 26 March 2023

A bigger watchlist for the first time in little while, as the recent watchlists have been sparse due to the deterioration of the market since early February, as seen by the weekends market breadth posts. However, over a third of the stocks are from only two groups...
Read More

US Stocks Watchlist – 23 March 2023

One of the primary purposes of the daily watchlist scans is as alternative form of market breadth, as by scanning the market daily and looking for stocks displaying the characteristics of Stage 1 and Stage 2. It gives a really good idea of the overall market health...
Read More

S&P 500 Divergence and the US Stocks Watchlist – 21 March 2023

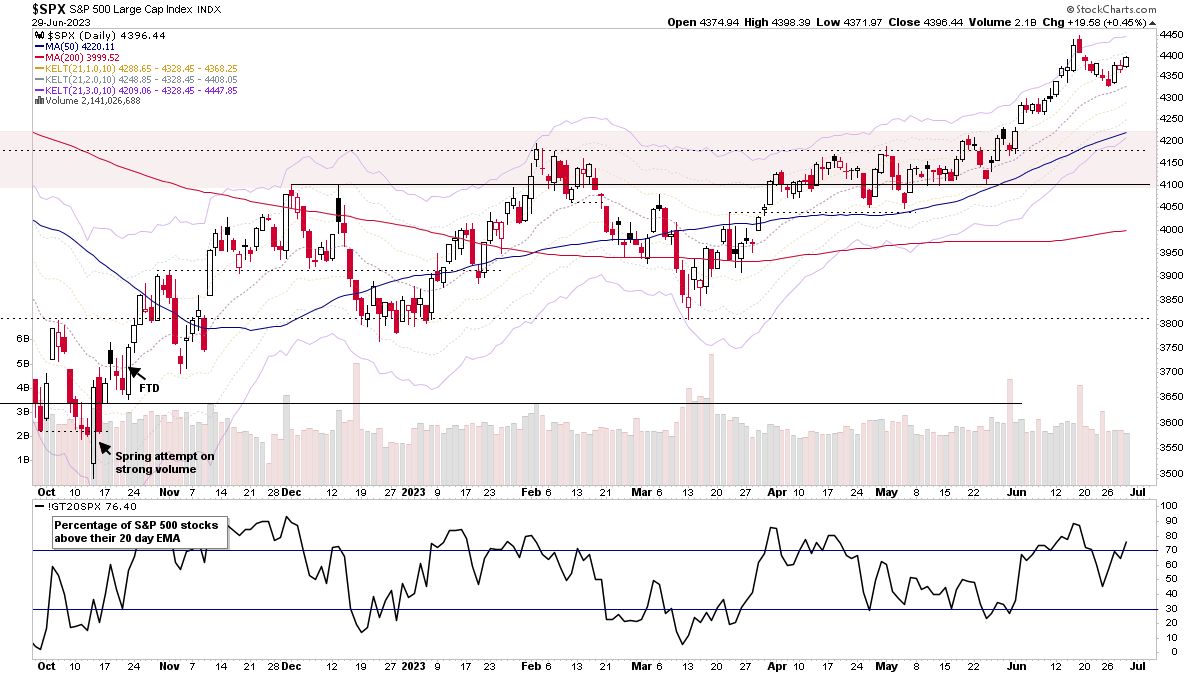
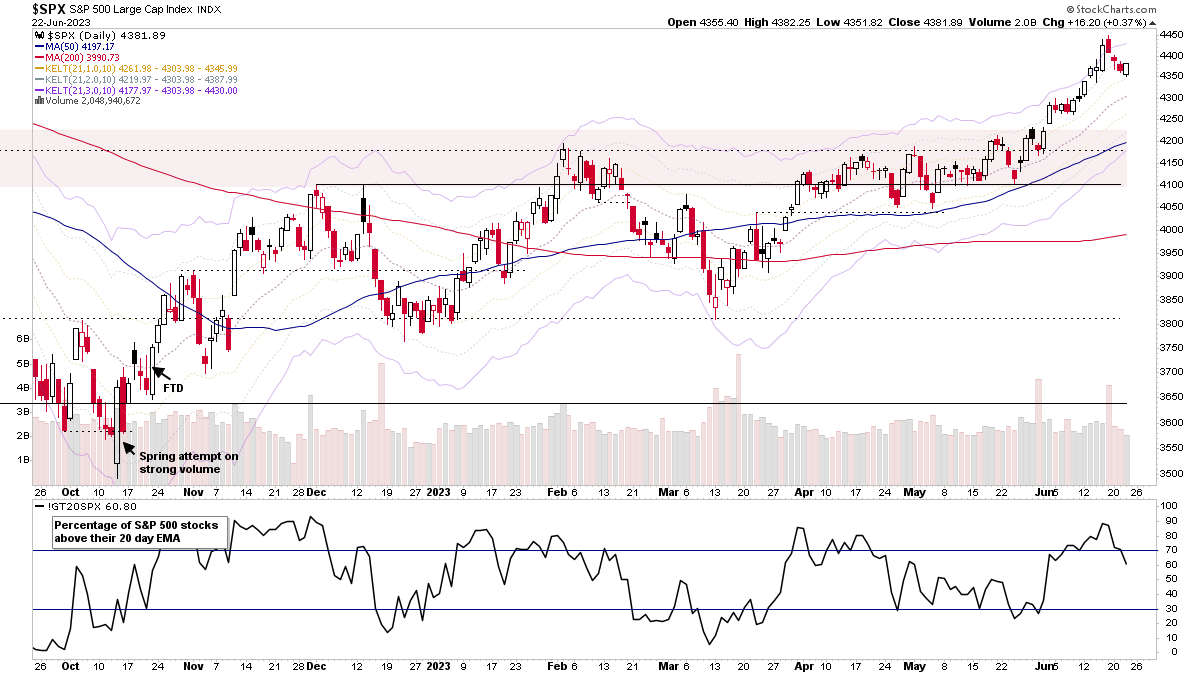
The S&P 500 moved strongly back above its 20 day EMA today. But as you can see in the above chart, there's a notable difference with the S&P 500 percentage of stocks above their 20 day EMA (middle indicator) which is at 36.60%, as with the S&P 500 index above its 20 day MA by almost 1%, you would expect at least 50% of S&P 500 to be doing the same...
Read More

Stage Analysis Members Video – 19 March 2023 (1hr 20mins)

This weekends video begins with a detailed discussion of the IBD Industry Groups Bell Curve – Bullish Percent and the Market Breadth Indicators, in order to help to determine the weight of evidence, which is the most crucial aspect of Stan Weinstein's Stage Analysis method. The changes in the US Stocks Industry Groups RS Rankings are then discussed, as well as the Major Indexes Update and Futures, including the S&P 500, Nasdaq 100, Russell 2000, US Dollar Index, Gold etc. Followed by a review of the watchlist stocks from the weekend scans.
Read More

Stage Analysis Members Video – 15 March 2023 (58mins)

The Stage Analysis members midweek video discussing this weeks volatile price action in the S&P 500, Nasdaq Composite, Russell 2000 and the VIX, with a look at what the short-term market breadth indicators are suggesting. Plus a look at some of the this weeks major Stage 4 breakdown attempts. Followed by a detailed look at the US Watchlist Stocks from today scans and yesterdays post in more detail with live markups on multiple timeframes.
Read More

Group Focus: Gold, Silver and the Precious Metals Miners – 13 March 2023

Following on from yesterdays video where it was discussed that Gold might be in the Stage Analysis methods secondary entry zone. Today we saw a strong move in all of the precious metals futures – i.e. Gold (GC), Silver (SI), Platinum (PL) and Palladium (PA). The strength wasn't limited to the physical metals, as the precious metals mining stocks also caught a bid, so I though it would be useful to do a broader post covering some of the precious metals ETFs and stocks, so that you can further research the group in more detail...
Read More