There were 13 stocks highlighted from the US stocks watchlist scans today...
Read More

Blog
Finding stocks with the best potential can be difficult. For many years now I've created the US Stocks Watchlist to try and find the stocks that meet the Stage Analysis method criteria and that are near to potential entry points in the coming days, weeks or months. i.e they may be in late Stage 1 developing a Wyckoff Spring or breaking out in early Stage 2 on strong relative volume, or tightening up with Volatility Contraction Pattern (VCP) characteristics in a re-accumulation base after having a strong Stage 2 advance.
Disclaimer: This is not a stock alerts service. We won’t tell you what stocks to buy or sell. But if you follow the watchlist it may give you ideas for your own trades and save you countless hours, by giving you a more refined starting point for your own stock research.
Non-members
To see all the watchlist posts and other premium content, such as regular detailed videos and exclusive Stage Analysis tools, become a member
Join Today
11 March, 2025
US Stocks Watchlist – 11 March 2025
09 March, 2025
Stage Analysis Members Video – 9 March 2025 (44mins)
The Stage Analysis members weekend video begins with discussion of the the US Watchlist Stocks in detail on multiple timeframes, Stages Summary, Relative Strength Rankings, the Sector breadth and Sub-industries Bell Curves, the key Market Breadth Charts to determine the Weight of Evidence, Bitcoin & Ethereum and the Major US Stock Market Indexes Update.
Read More
08 March, 2025
US Stocks Watchlist – 8 March 2024
There were 15 stocks highlighted from the US stocks watchlist scans today...
Read More
05 March, 2025
US Stocks Watchlist – 4 March 2025
There were 12 stocks highlighted from the US stocks watchlist scans today...
Read More
03 March, 2025
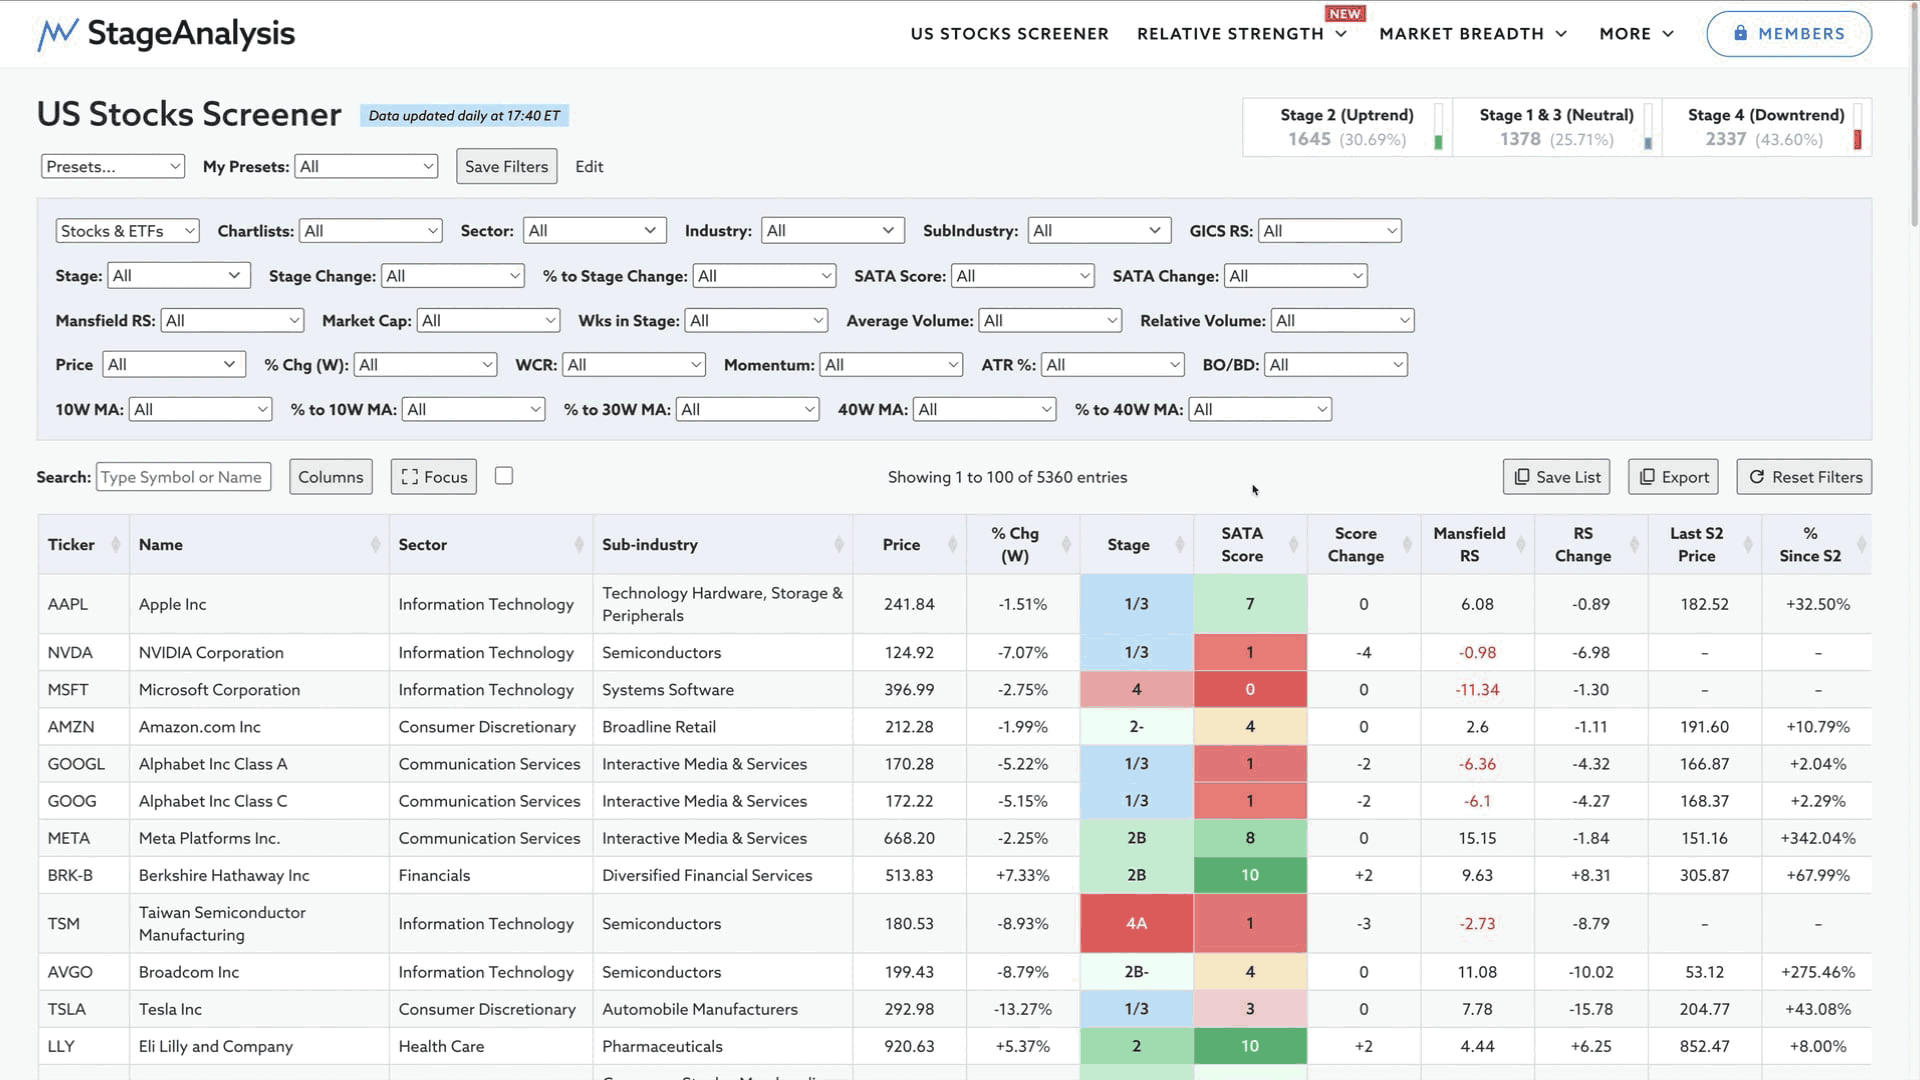
Video: How to Use the Stage Analysis Screener – 3 March 2025
Detailed video explaining the current features available in the Stage Analysis Screener at the time of recording in March 2025 and how to use them, as well as an overview of the various other Stage Analysis tools and features available to the members on the website...
Read More
02 March, 2025
Stage Analysis Members Video – 2 March 2025 (54mins)
The Stage Analysis members weekend video begins with discussion of the the US Watchlist Stocks in detail on multiple timeframes, Stages Summary including the new Sub-stages summary added this week. Relative Strength Rankings, the Sector breadth and Sub-industries Bell Curves, the key Market Breadth Charts to determine the Weight of Evidence, Bitcoin & Ethereum and the Major US Stock Market Indexes Update and ETFs on the move...
Read More
01 March, 2025
US Stocks Watchlist – 1 March 2025
There were 16 stocks highlighted from the US stocks watchlist scans today...
Read More
25 February, 2025
US Stocks Watchlist – 25 February 2025
There were 17 stocks highlighted from the US stocks watchlist scans today...
Read More
23 February, 2025
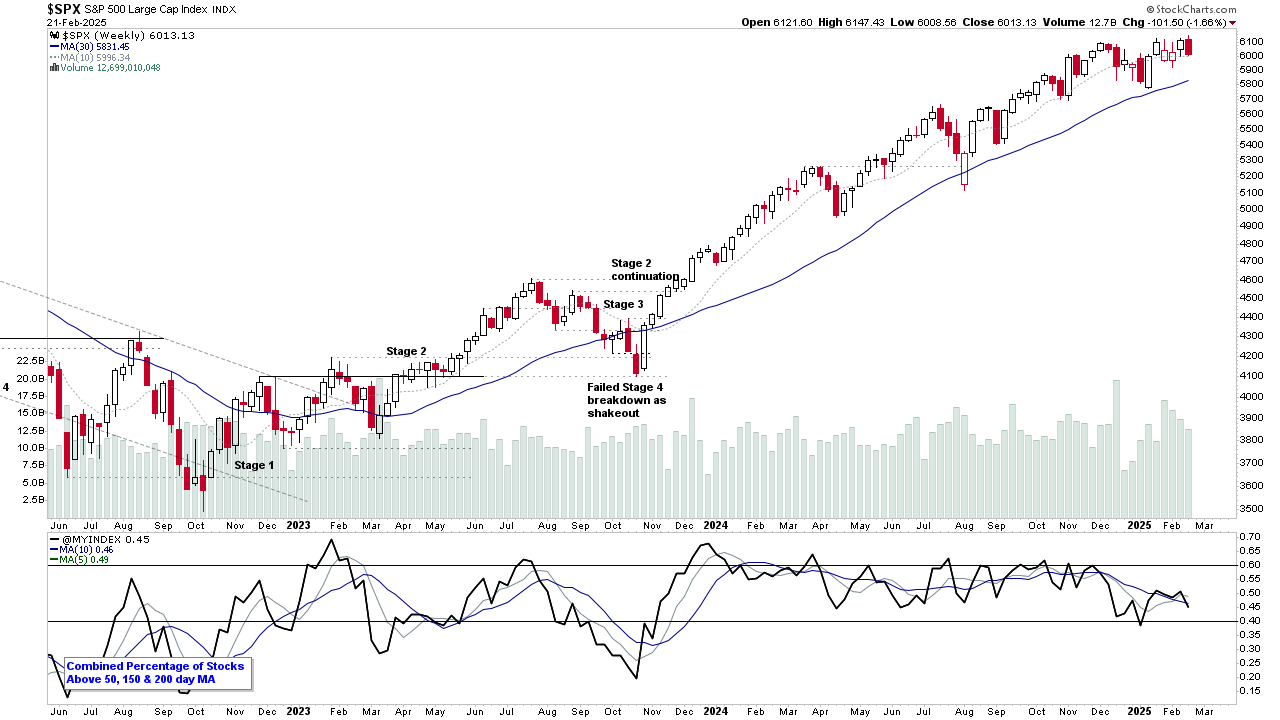
Stage Analysis Members Video – 23 February 2025 (38mins)
The Stage Analysis members weekend video begins with a discussion of the major US stocks and how to use the Stage Analysis Screener to find weakness. Followed by the Stages Summary, Relative Strength Rankings, the Sector breadth and Sub-industries Bell Curves, the key Market Breadth Charts to determine the Weight of Evidence, Bitcoin & Ethereum and the Major US Stock Market Indexes Update and ETFs on the move.
Read More
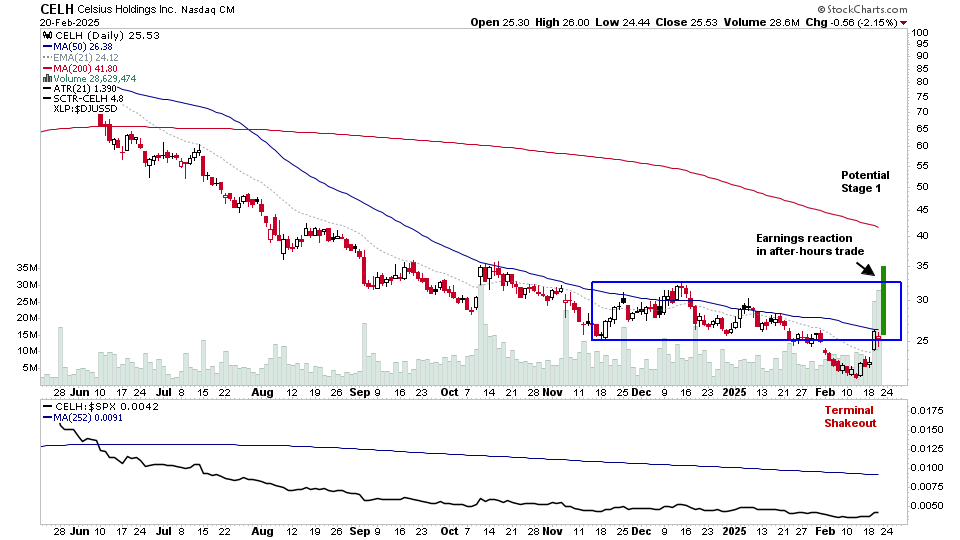
20 February, 2025
US Stocks Watchlist – 20 February 2025
There were 15 stocks highlighted from the US stocks watchlist scans today...
Read More