Blog

US Stocks Watchlist

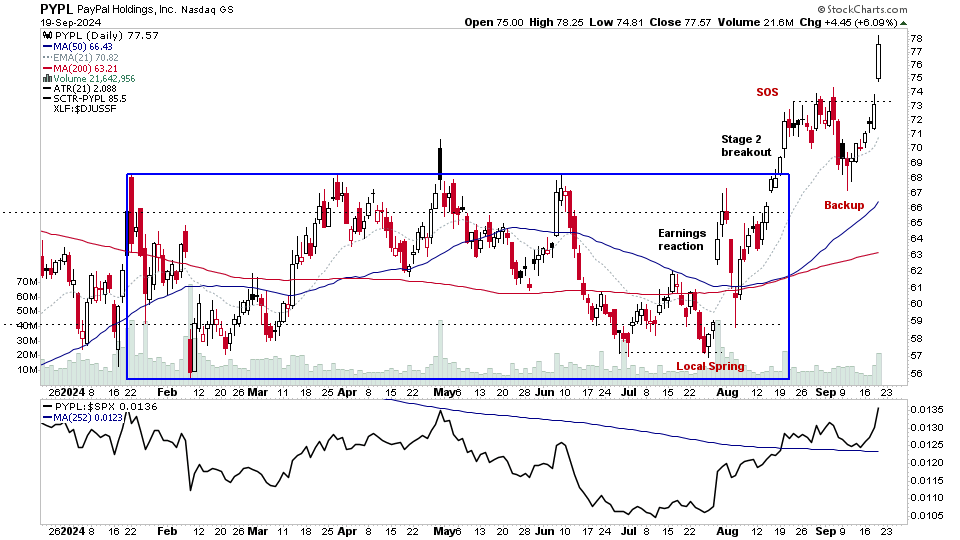
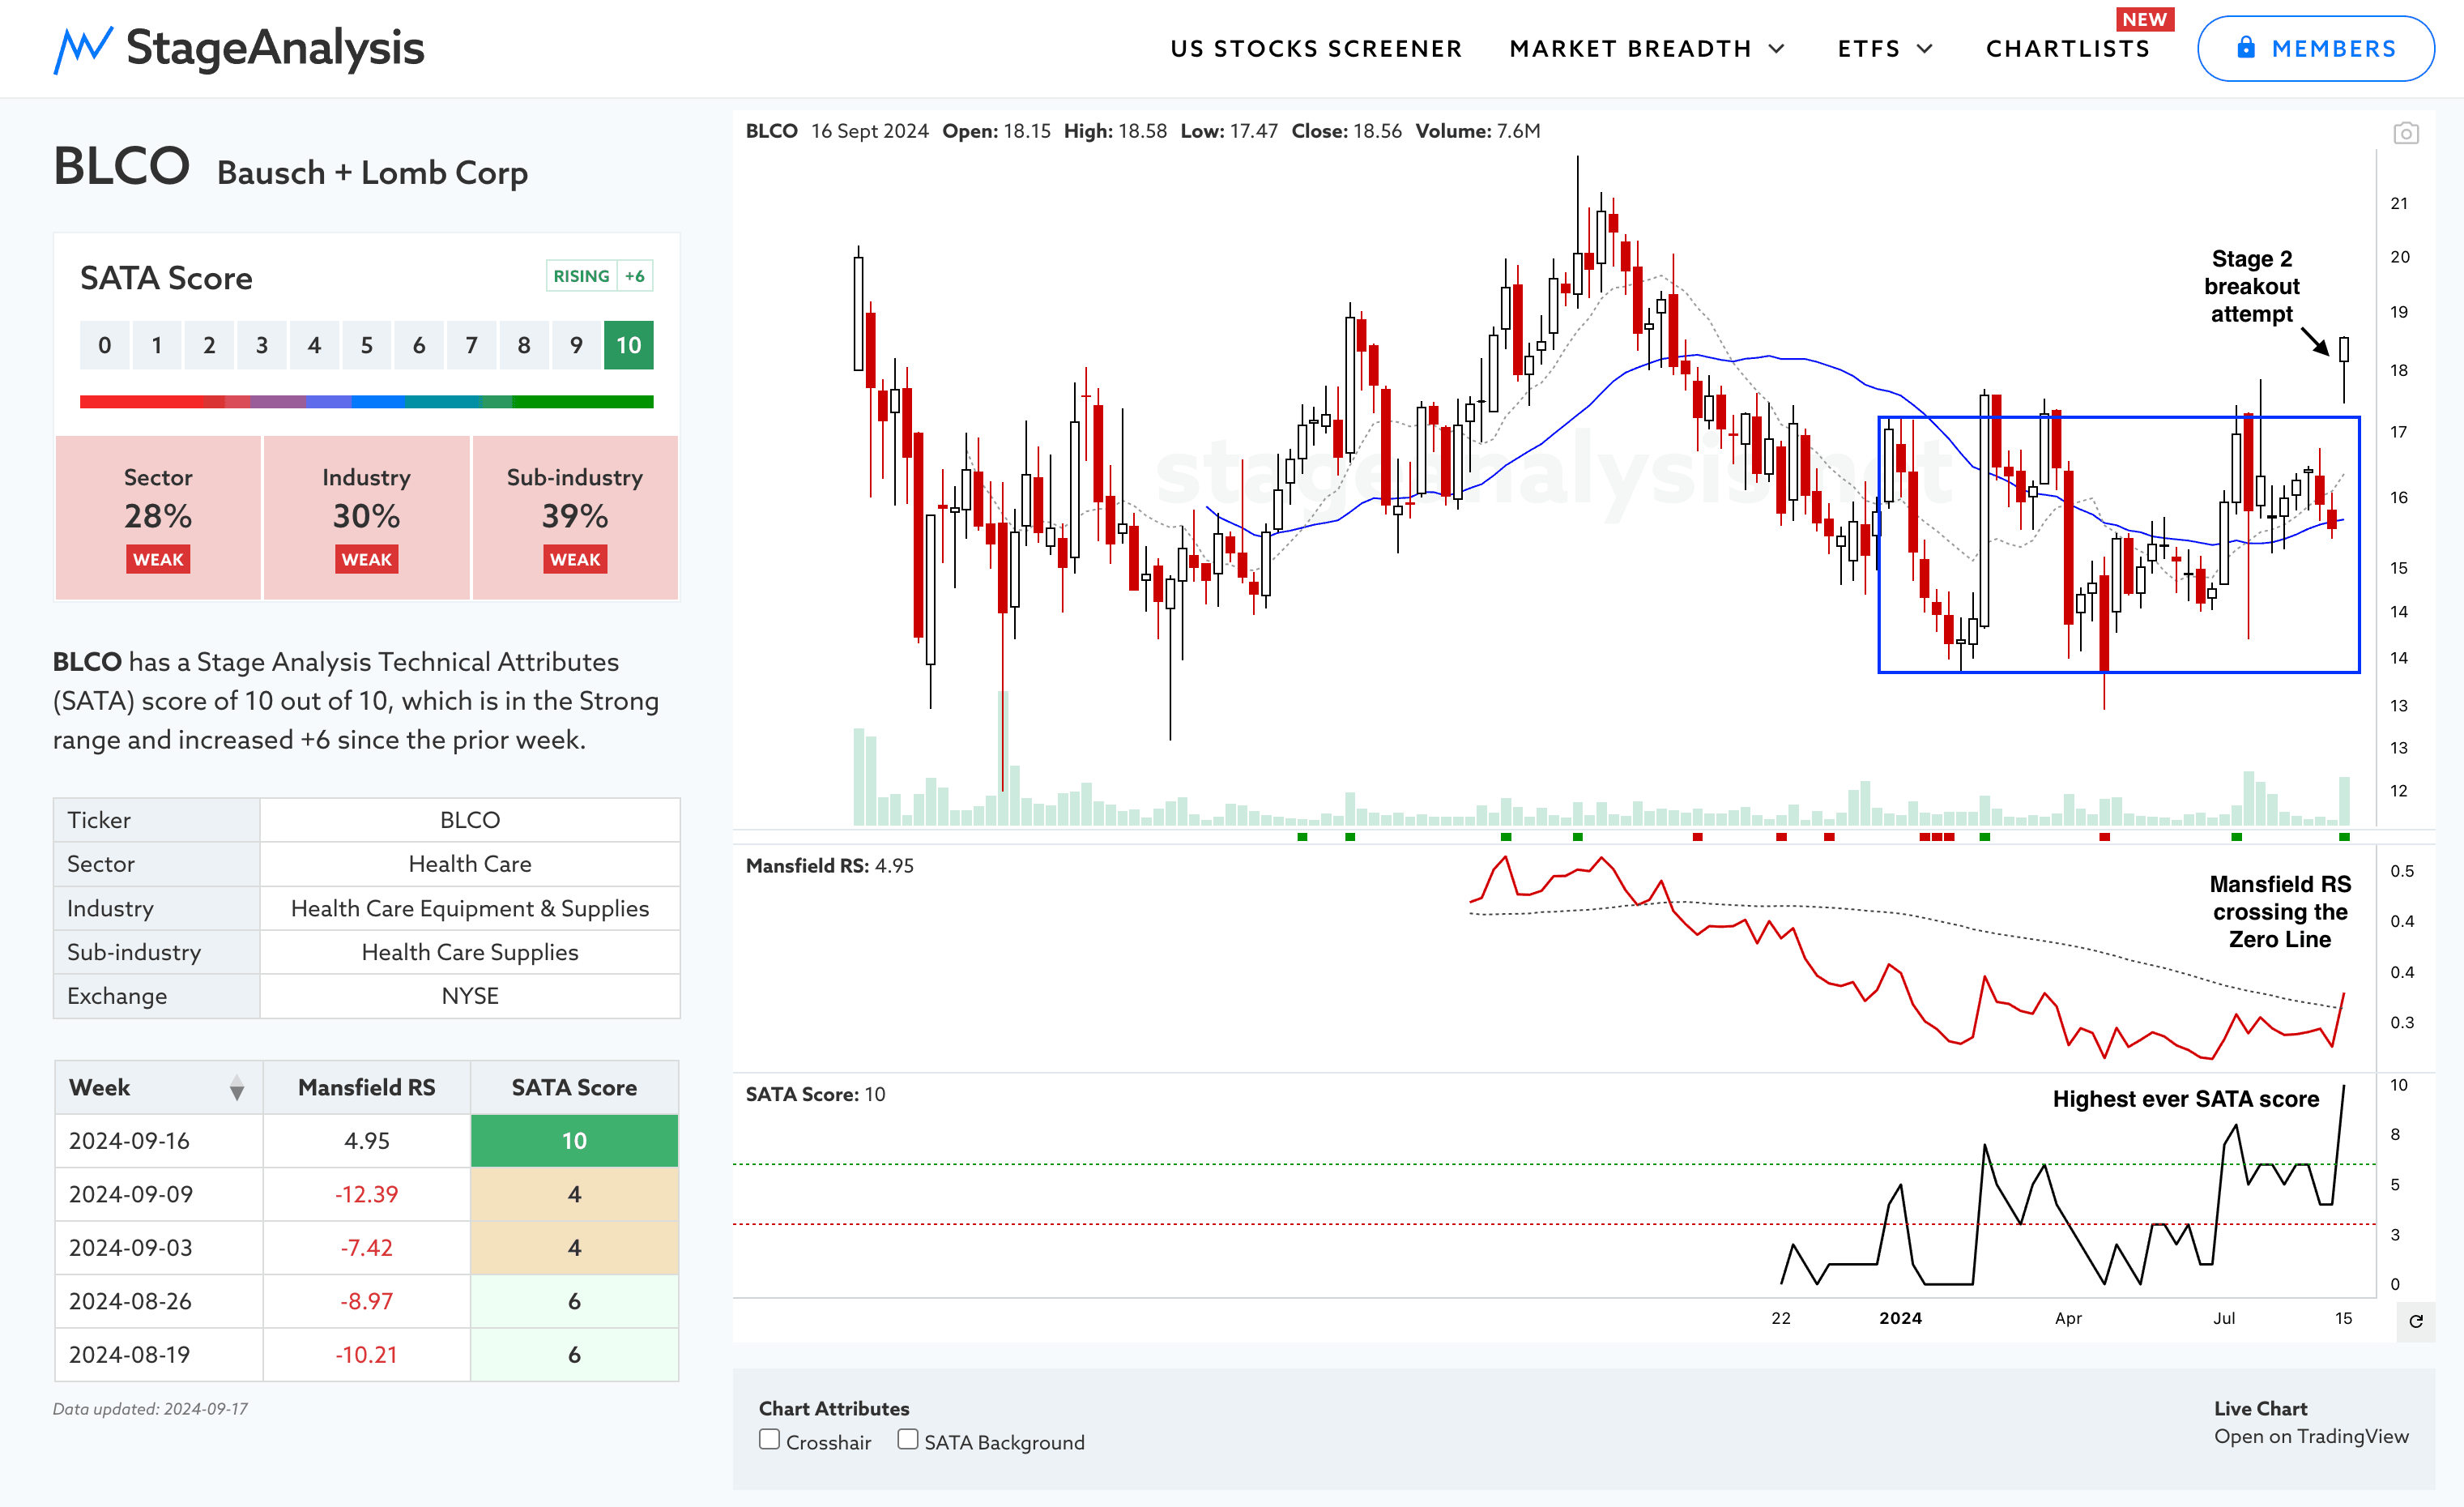
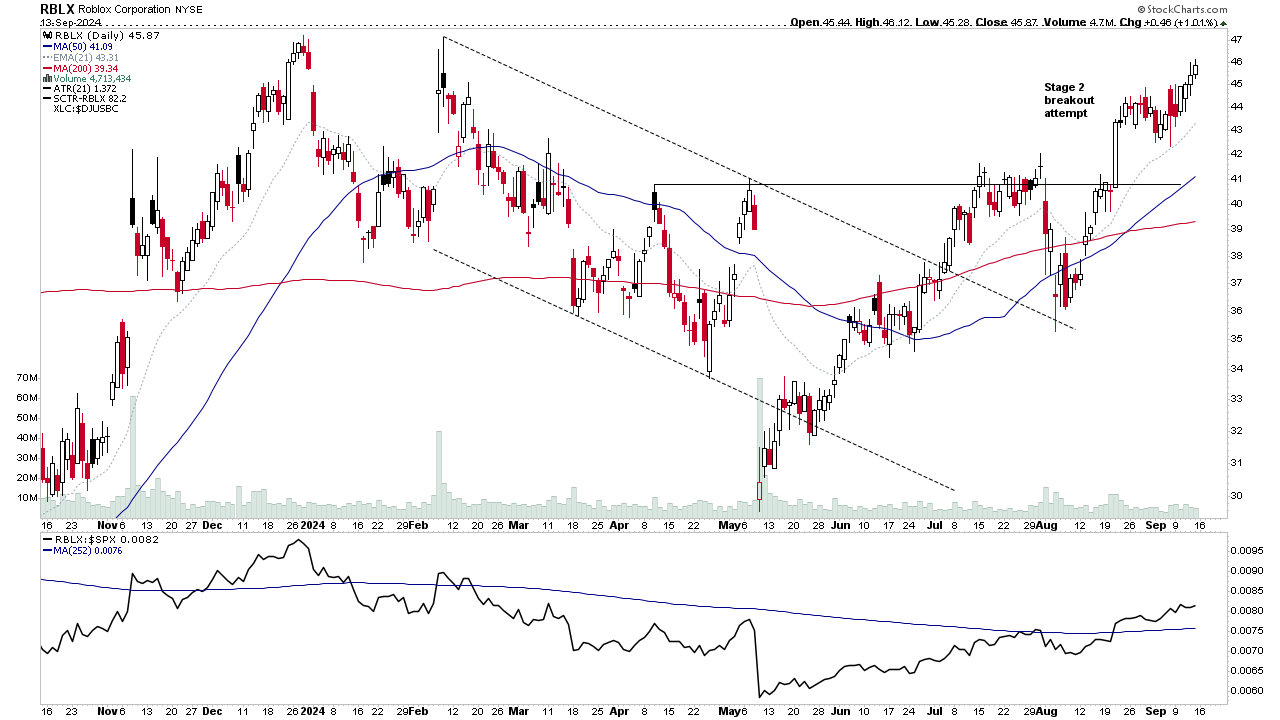
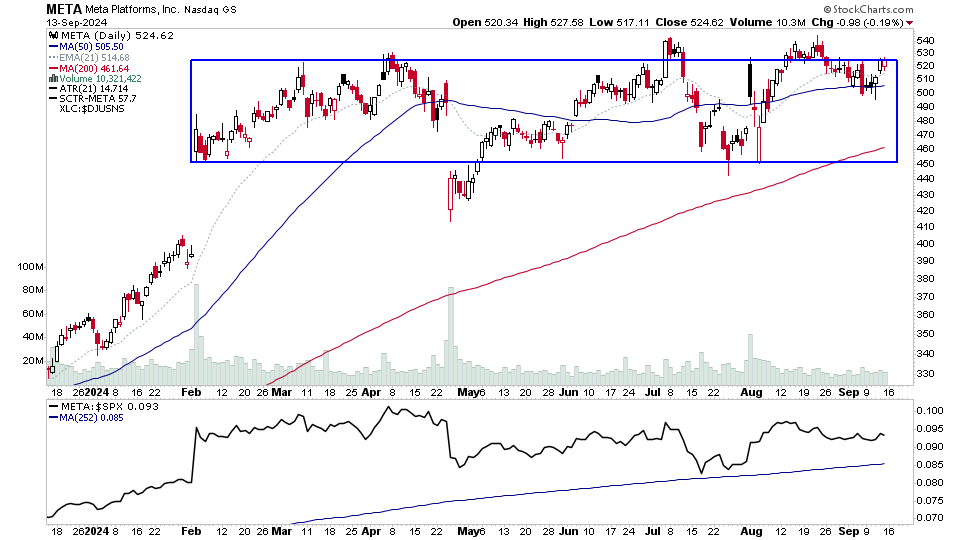
Finding stocks with the best potential can be difficult. For many years now I've created the US Stocks Watchlist to try and find the stocks that meet the Stage Analysis method criteria and that are near to potential entry points in the coming days, weeks or months. i.e they may be in late Stage 1 developing a Wyckoff Spring or breaking out in early Stage 2 on strong relative volume, or tightening up with Volatility Contraction Pattern (VCP) characteristics in a re-accumulation base after having a strong Stage 2 advance.

Disclaimer: This is not a stock alerts service. We won’t tell you what stocks to buy or sell. But if you follow the watchlist it may give you ideas for your own trades and save you countless hours, by giving you a more refined starting point for your own stock research.

Non-members
To see all the watchlist posts and other premium content, such as regular detailed videos and exclusive Stage Analysis tools, become a member

Join Today

US Stocks Watchlist – 7 May 2024

I've included the Equal Weighted version of the Nasdaq 100 in tonights post, as it's at pivotal point below its 50 day MA, and prior upper-range breakdown level from mid April. Plus, it gives a different perspective to the standard Nasdaq 100 chart, which moved above its own 50 day MA two days ago...
Read More

Stage Analysis Members Video – 5 May 2024 (47 mins)

Stage Analysis members weekend video looking at the most recent US watchlist stocks, discussing the New Stage Analysis Screener options and changes to the Members section, the Industry Groups Relative Strength (RS) Rankings, the key Market Breadth Charts to determine the Weight of Evidence, and the Major US Stock Market Indexes.
Read More

Stage Analysis Members Video – 28 April 2024 (1hr 4mins)

Stage Analysis members weekend video beginning with a look at the most recent US watchlist stocks, Significant Weekly Bars moving on volume, the new interactive GICS Sub-industries Bell Curve improvements, the Industry Groups Relative Strength (RS) Rankings, the key Market Breadth Charts to determine the Weight of Evidence, and the Major US Stock Market Indexes.
Read More