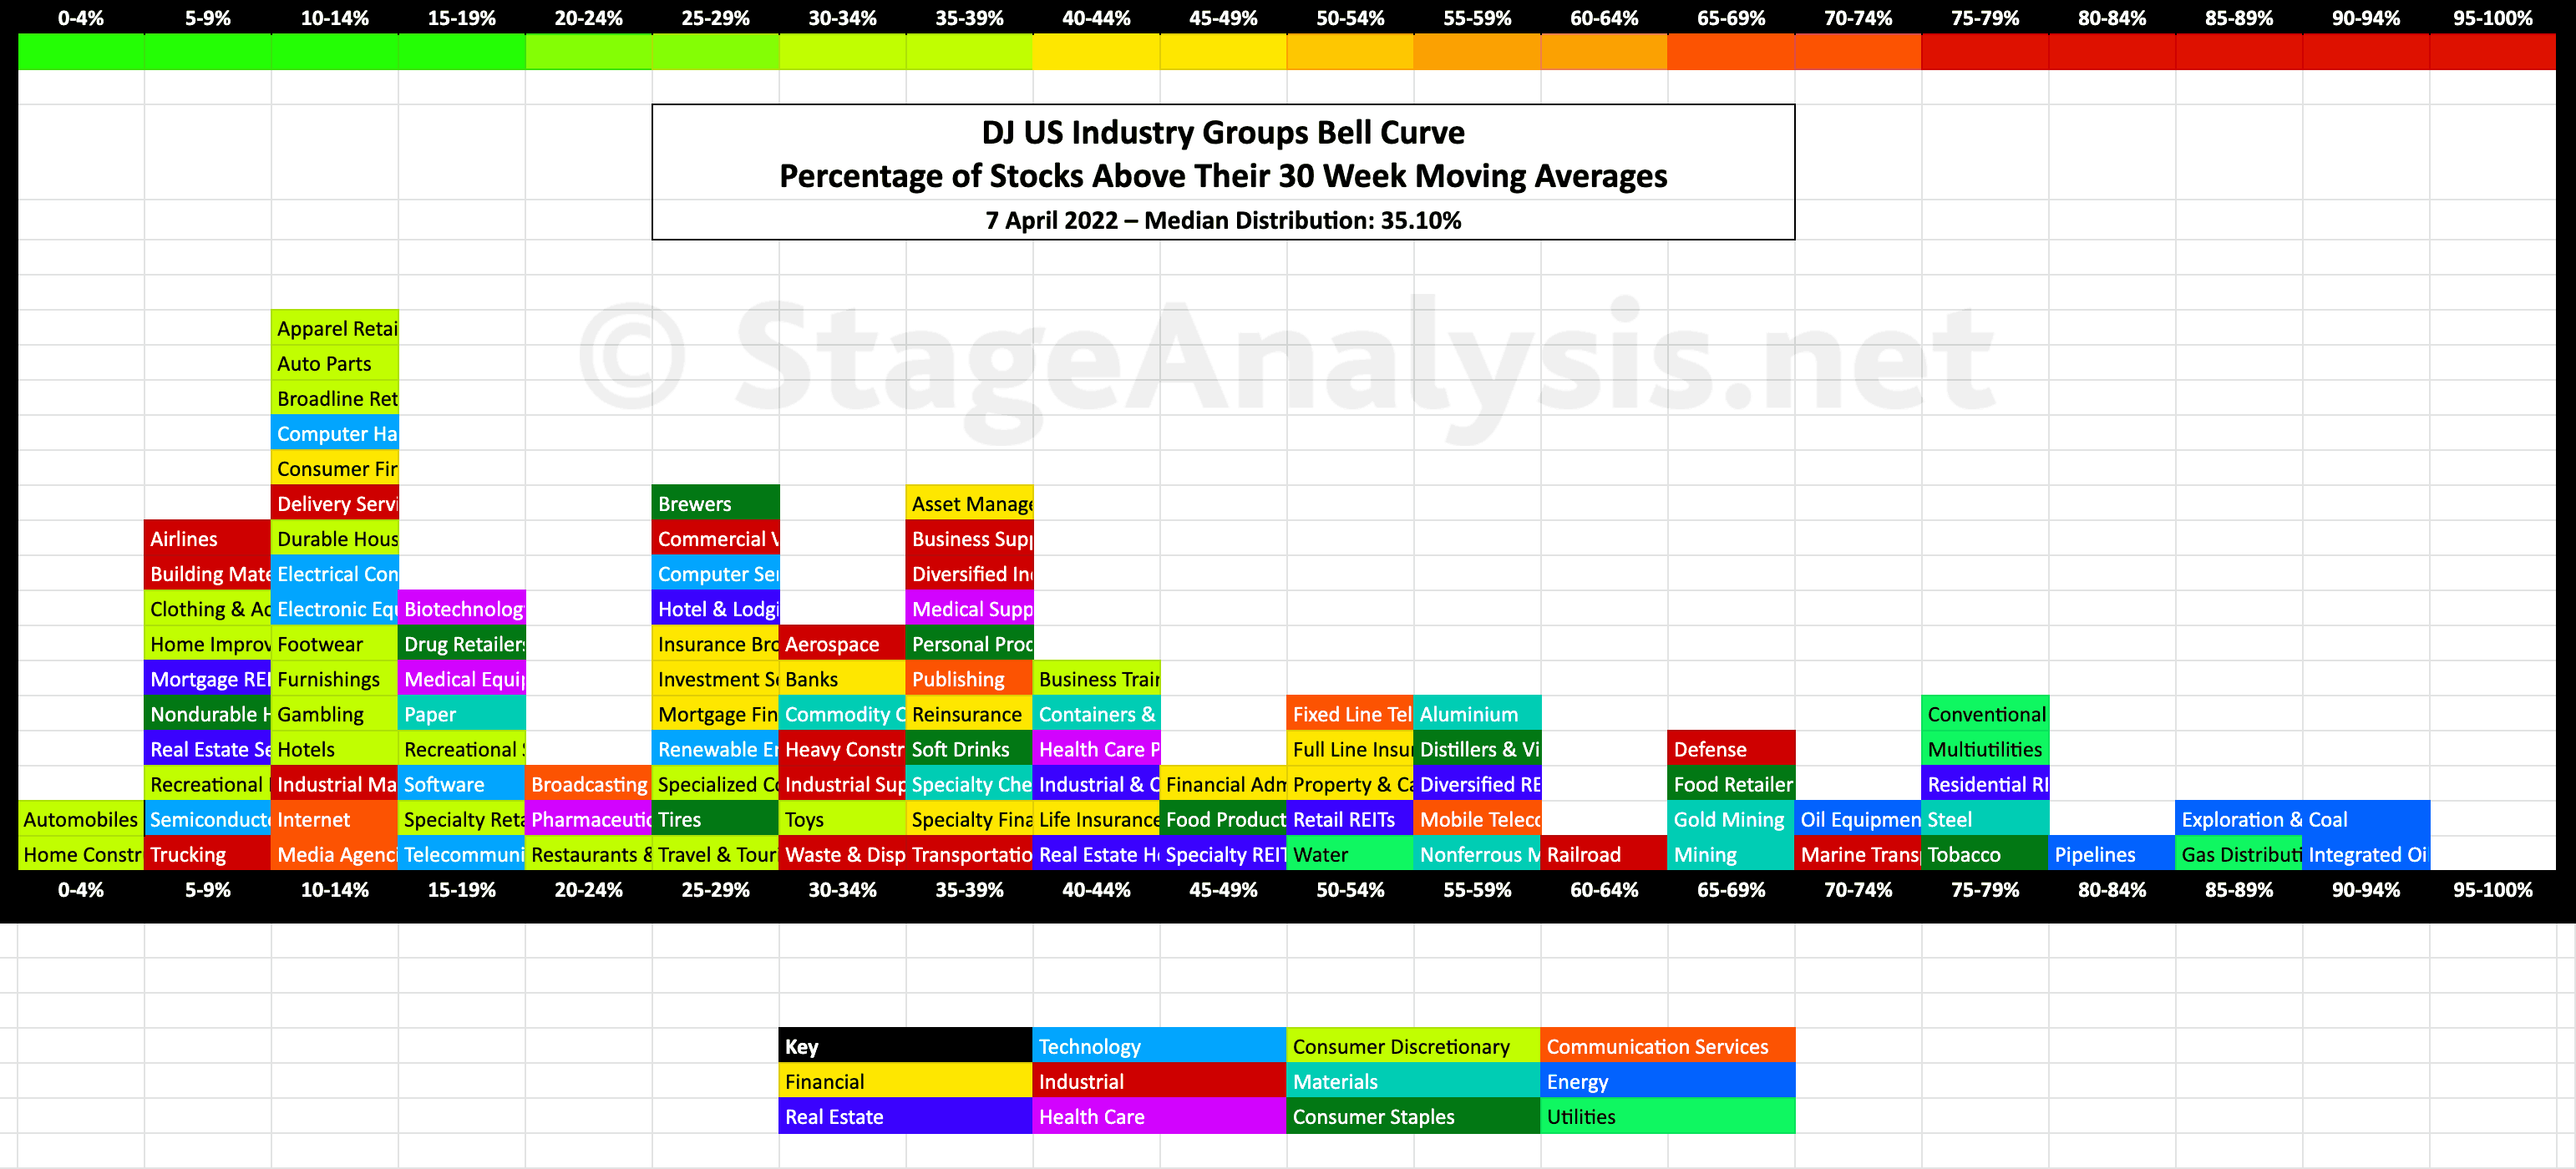
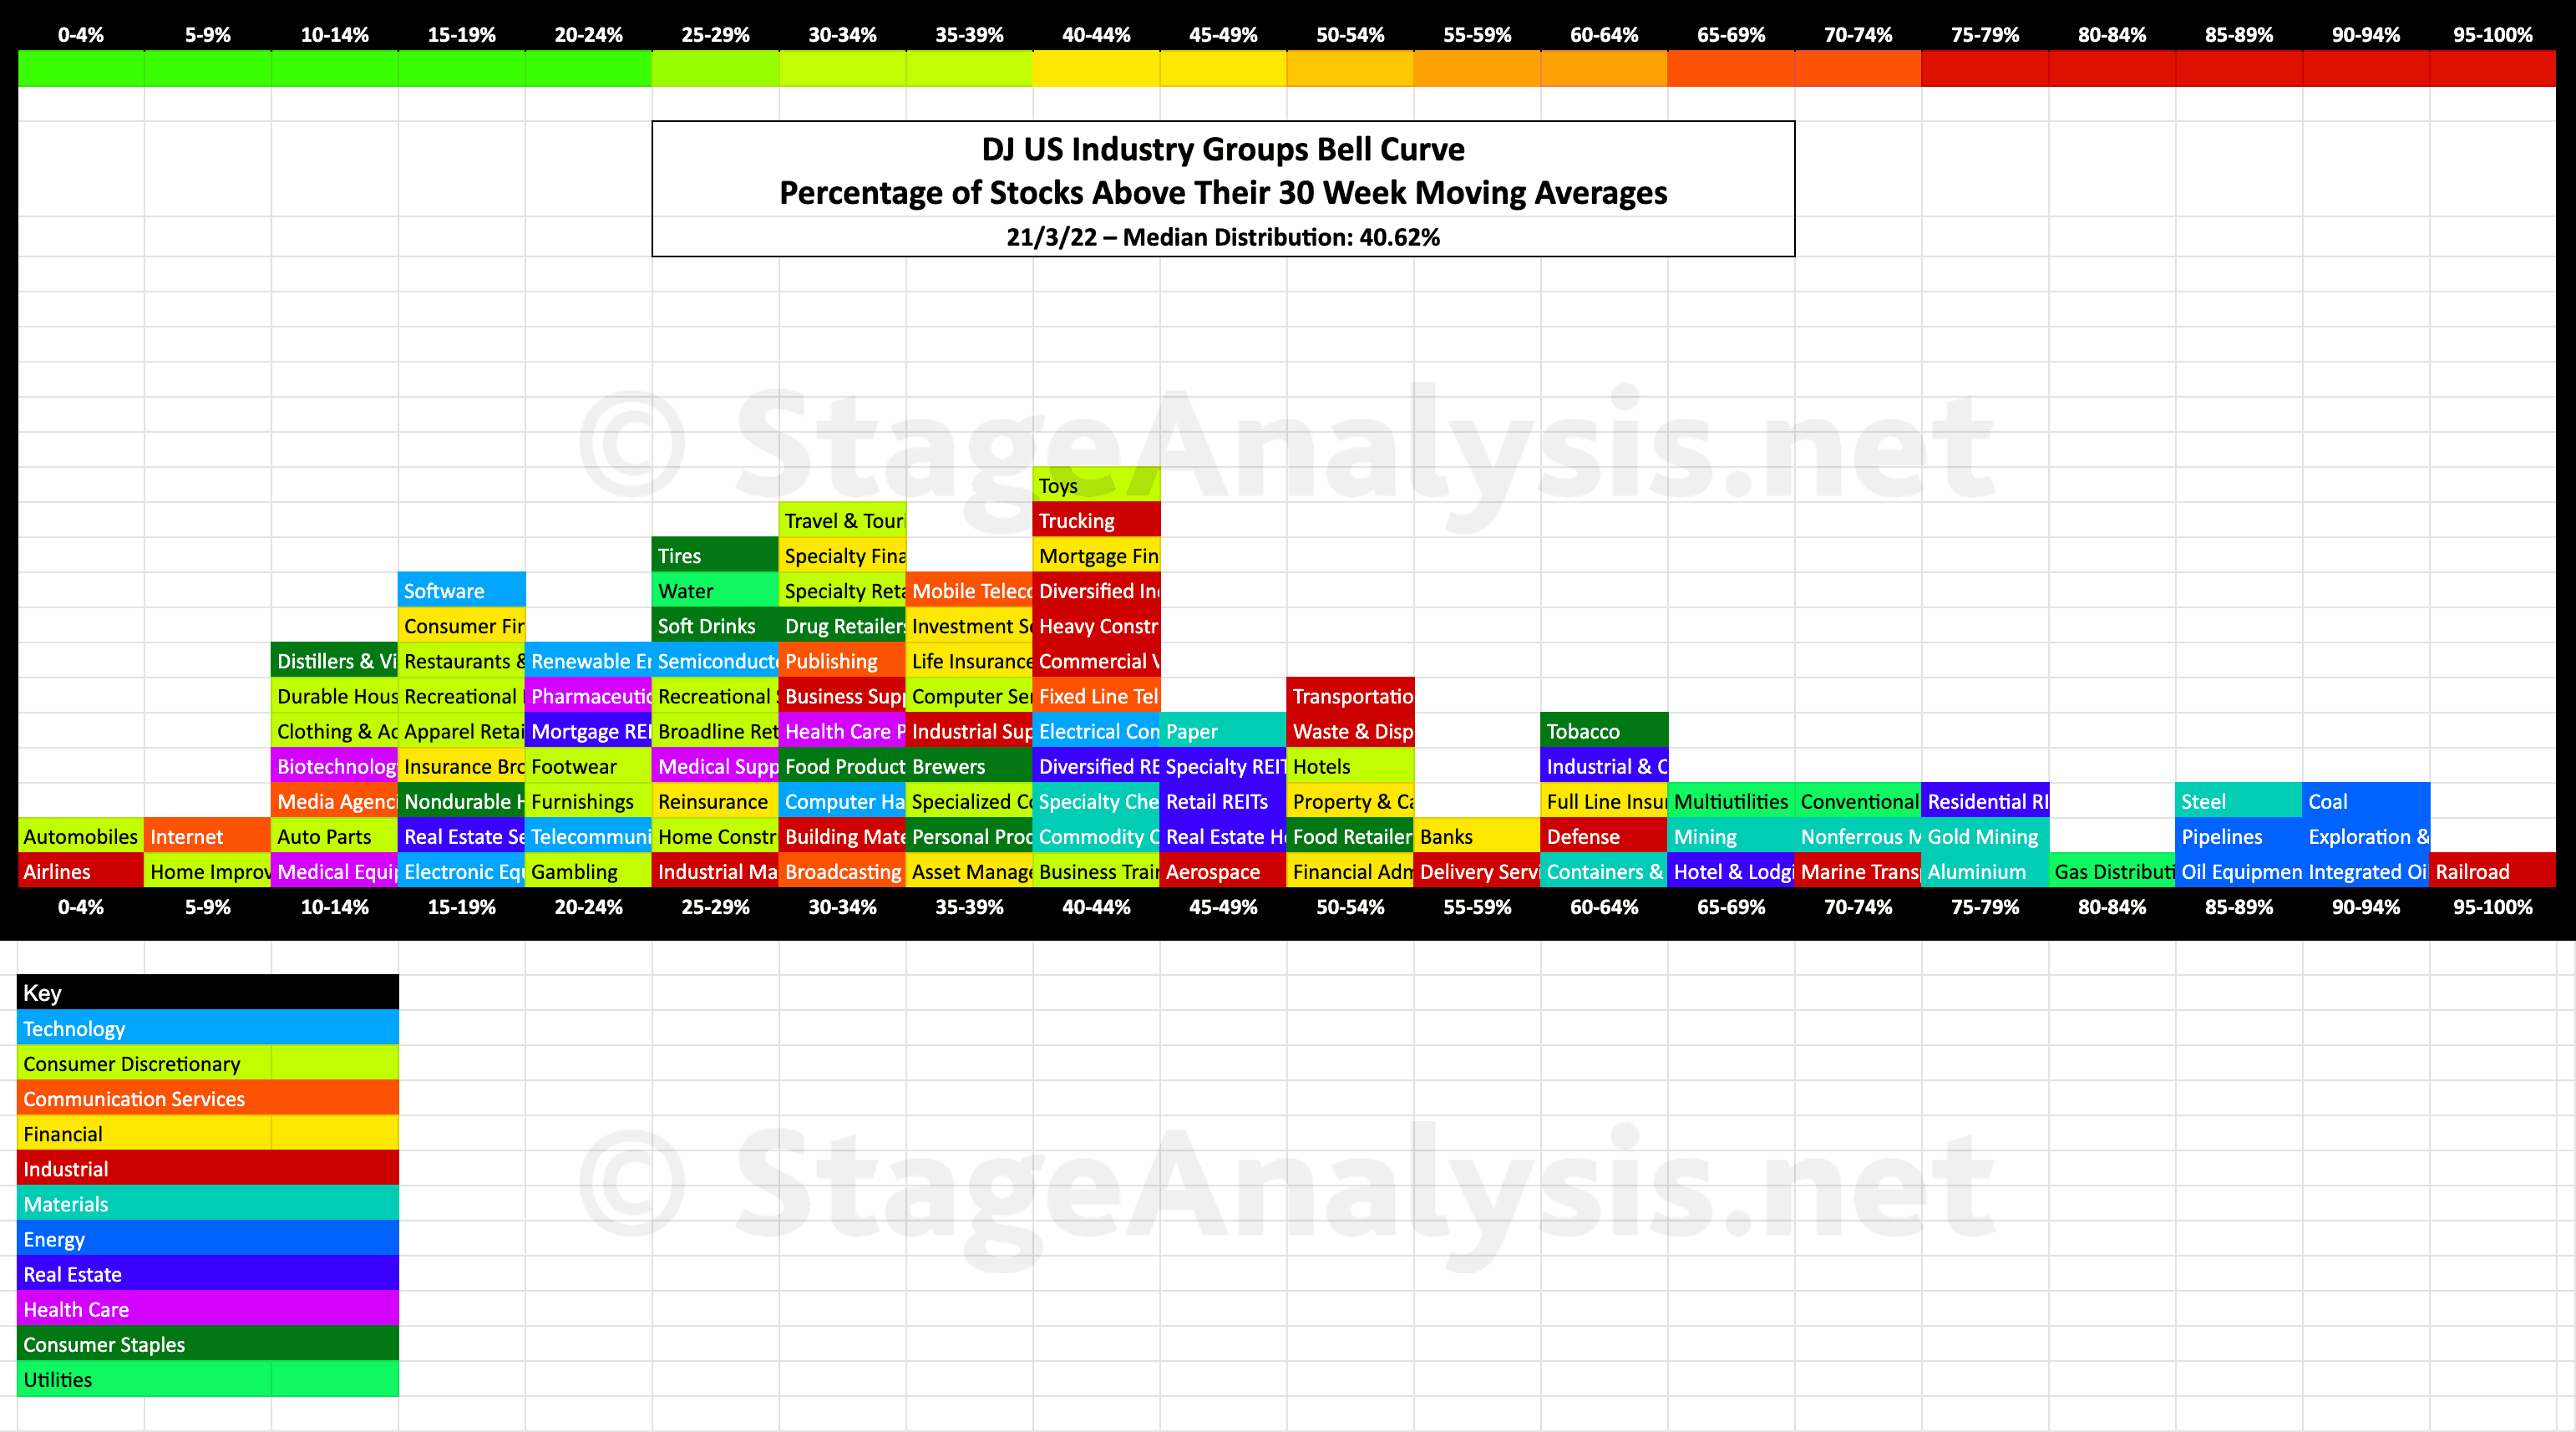
Updated exclusive graphic of the 104 Dow Jones Industry Groups showing the Percentage of Stocks Above 30 week MA in each group visualised as a Bell Curve chart – inspired by the Sector Bell Curve work by Tom Dorsey in his Point & Figure book....
Read More

Blog
07 April, 2022
US Industry Groups Bell Curve – Exclusive to Stage Analysis
07 April, 2022
Stage Analysis Members Midweek Video - 6 April 2022
This weeks Members Midweek Video focuses on some of the recent areas of weakness, like the Semiconductors groups, plus brief reviews of some of other featured groups in the last few months – as well as the regular midweek features on the indexes, short term market breadth charts and the watchlist stocks in focus.
Read More
03 April, 2022
Stage Analysis Members Weekend Video - 3 April 2022 (1hr 24mins)
In this weekends members video I discuss the Stan Weinstein Interview on Twitter Spaces, as well as the regular content of the Major Indexes, Sectors Relative Strength Tables & Charts, Industry Group RS Tables and Themes, Market Breadth: Weight of Evidence, 2x Weekly Volume Stocks and the US Watchlist Stocks in detail.
Read More
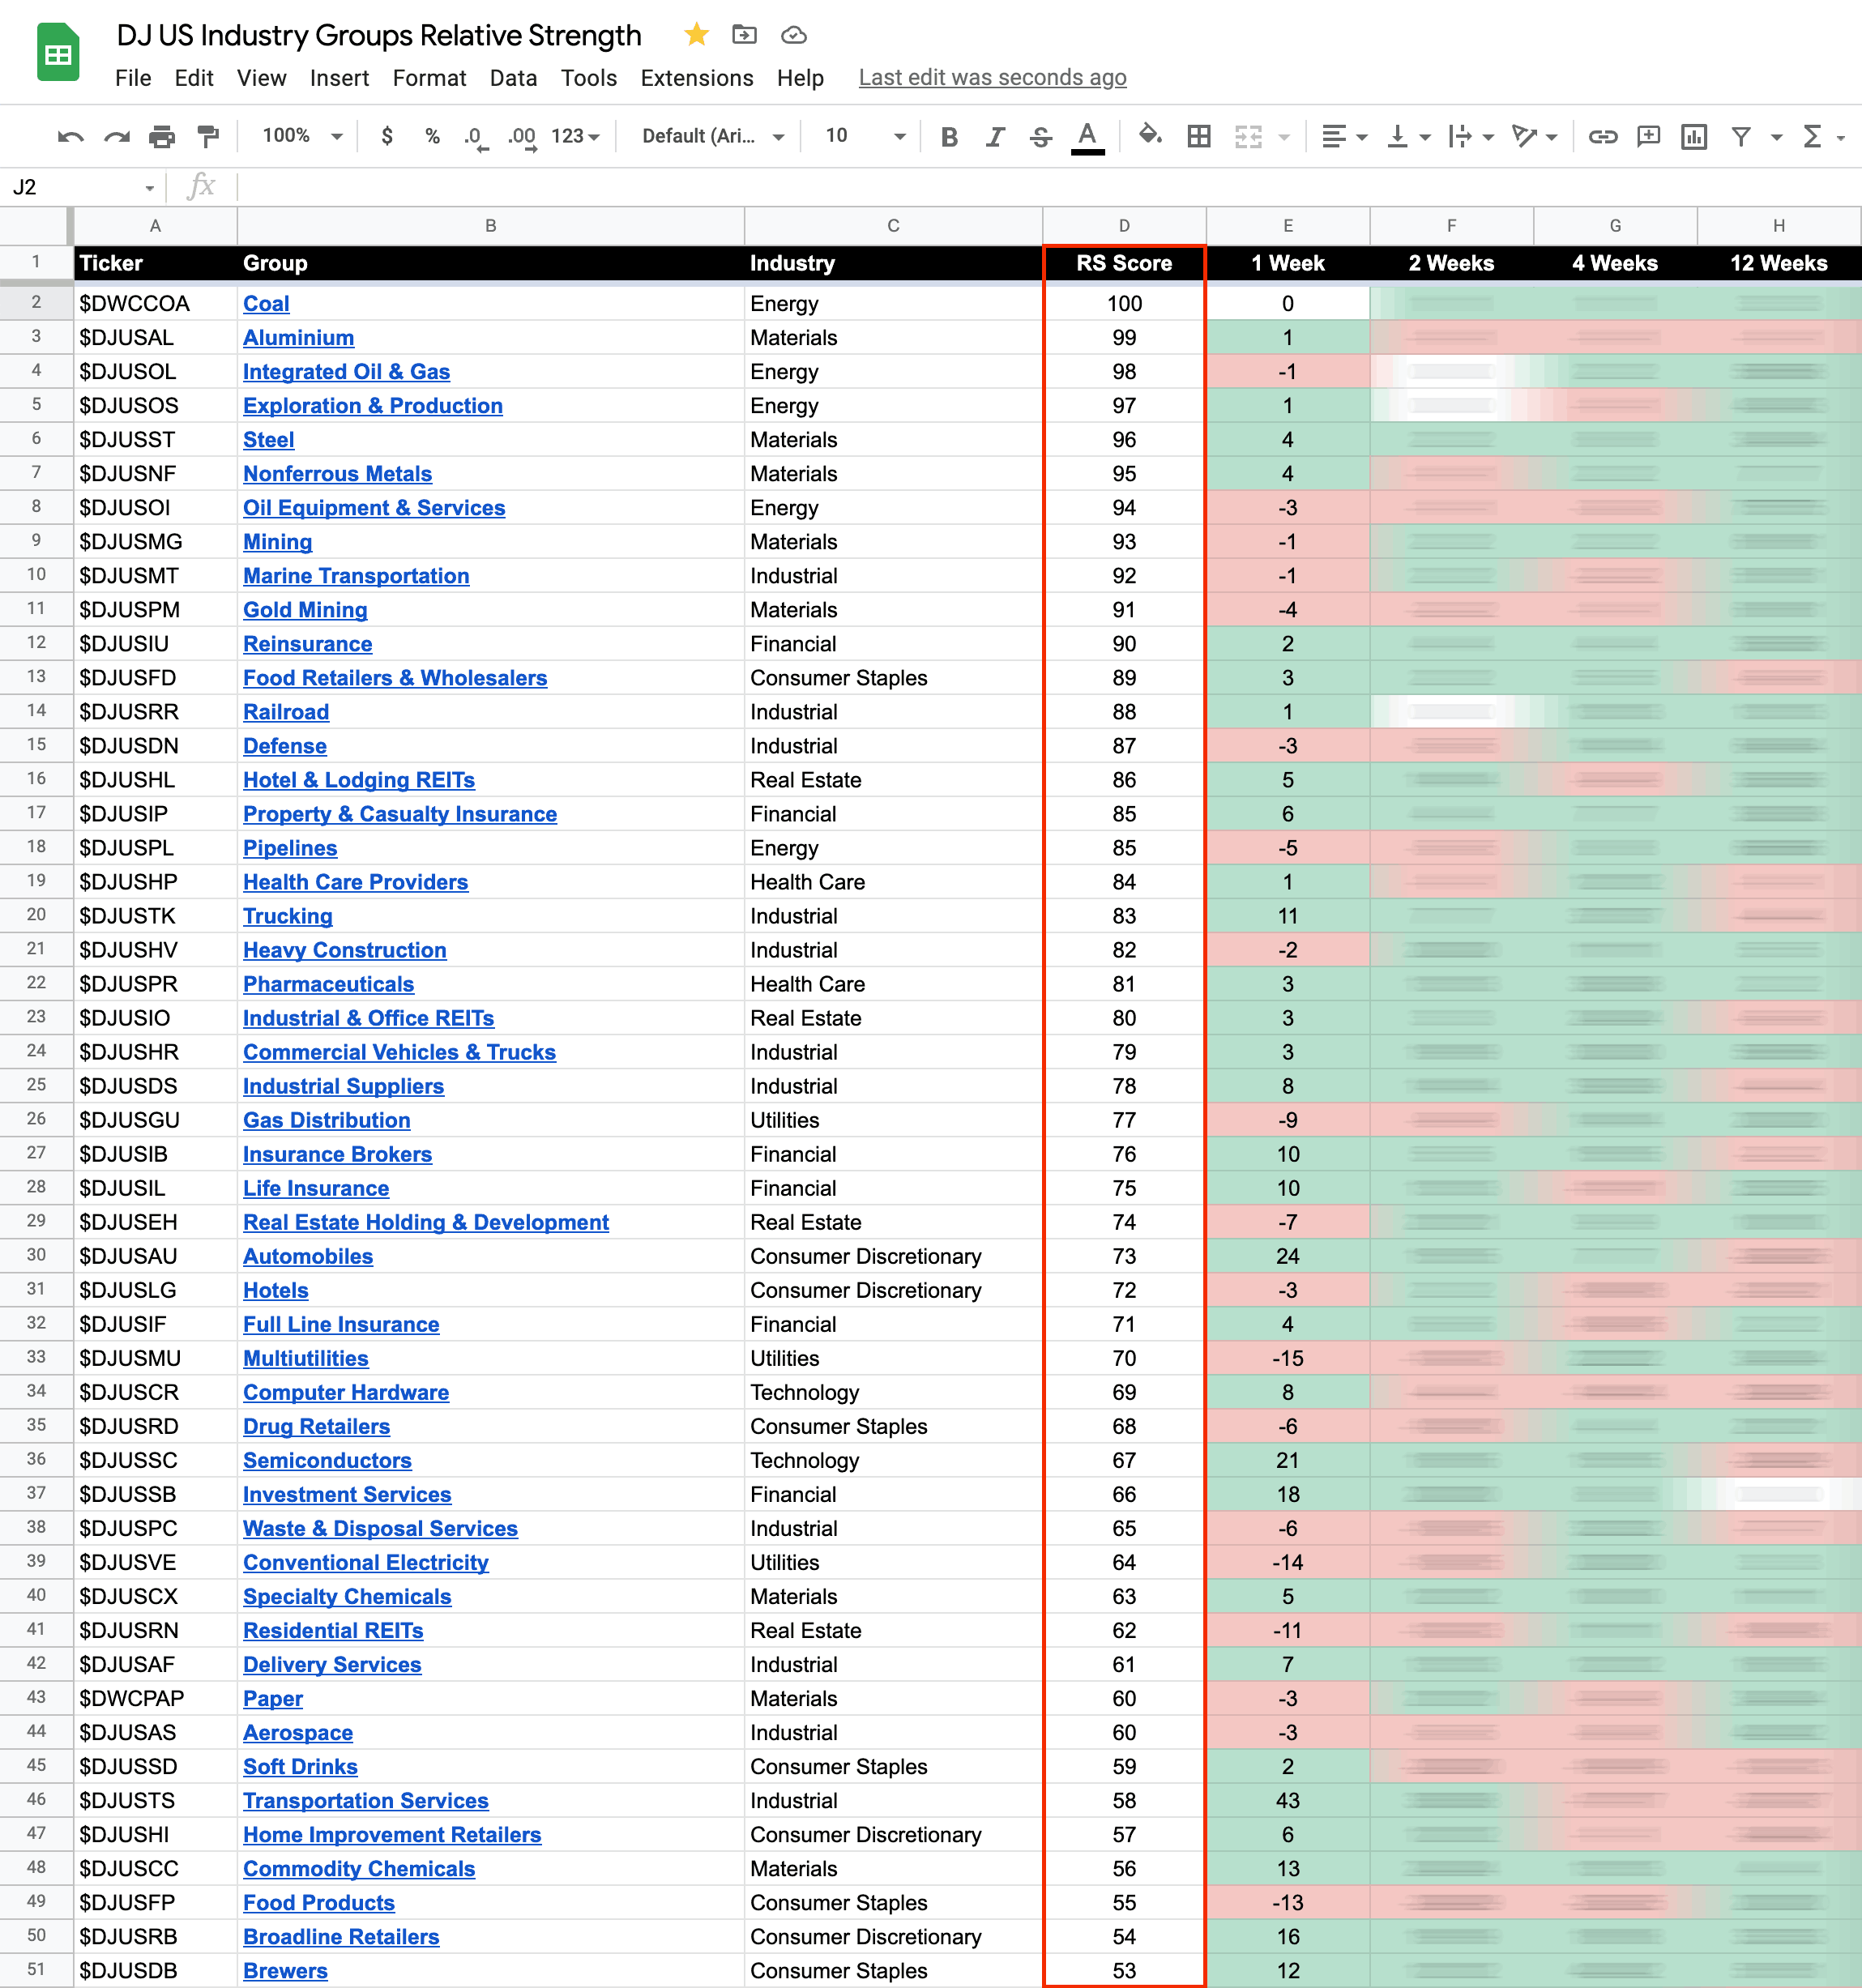
01 April, 2022
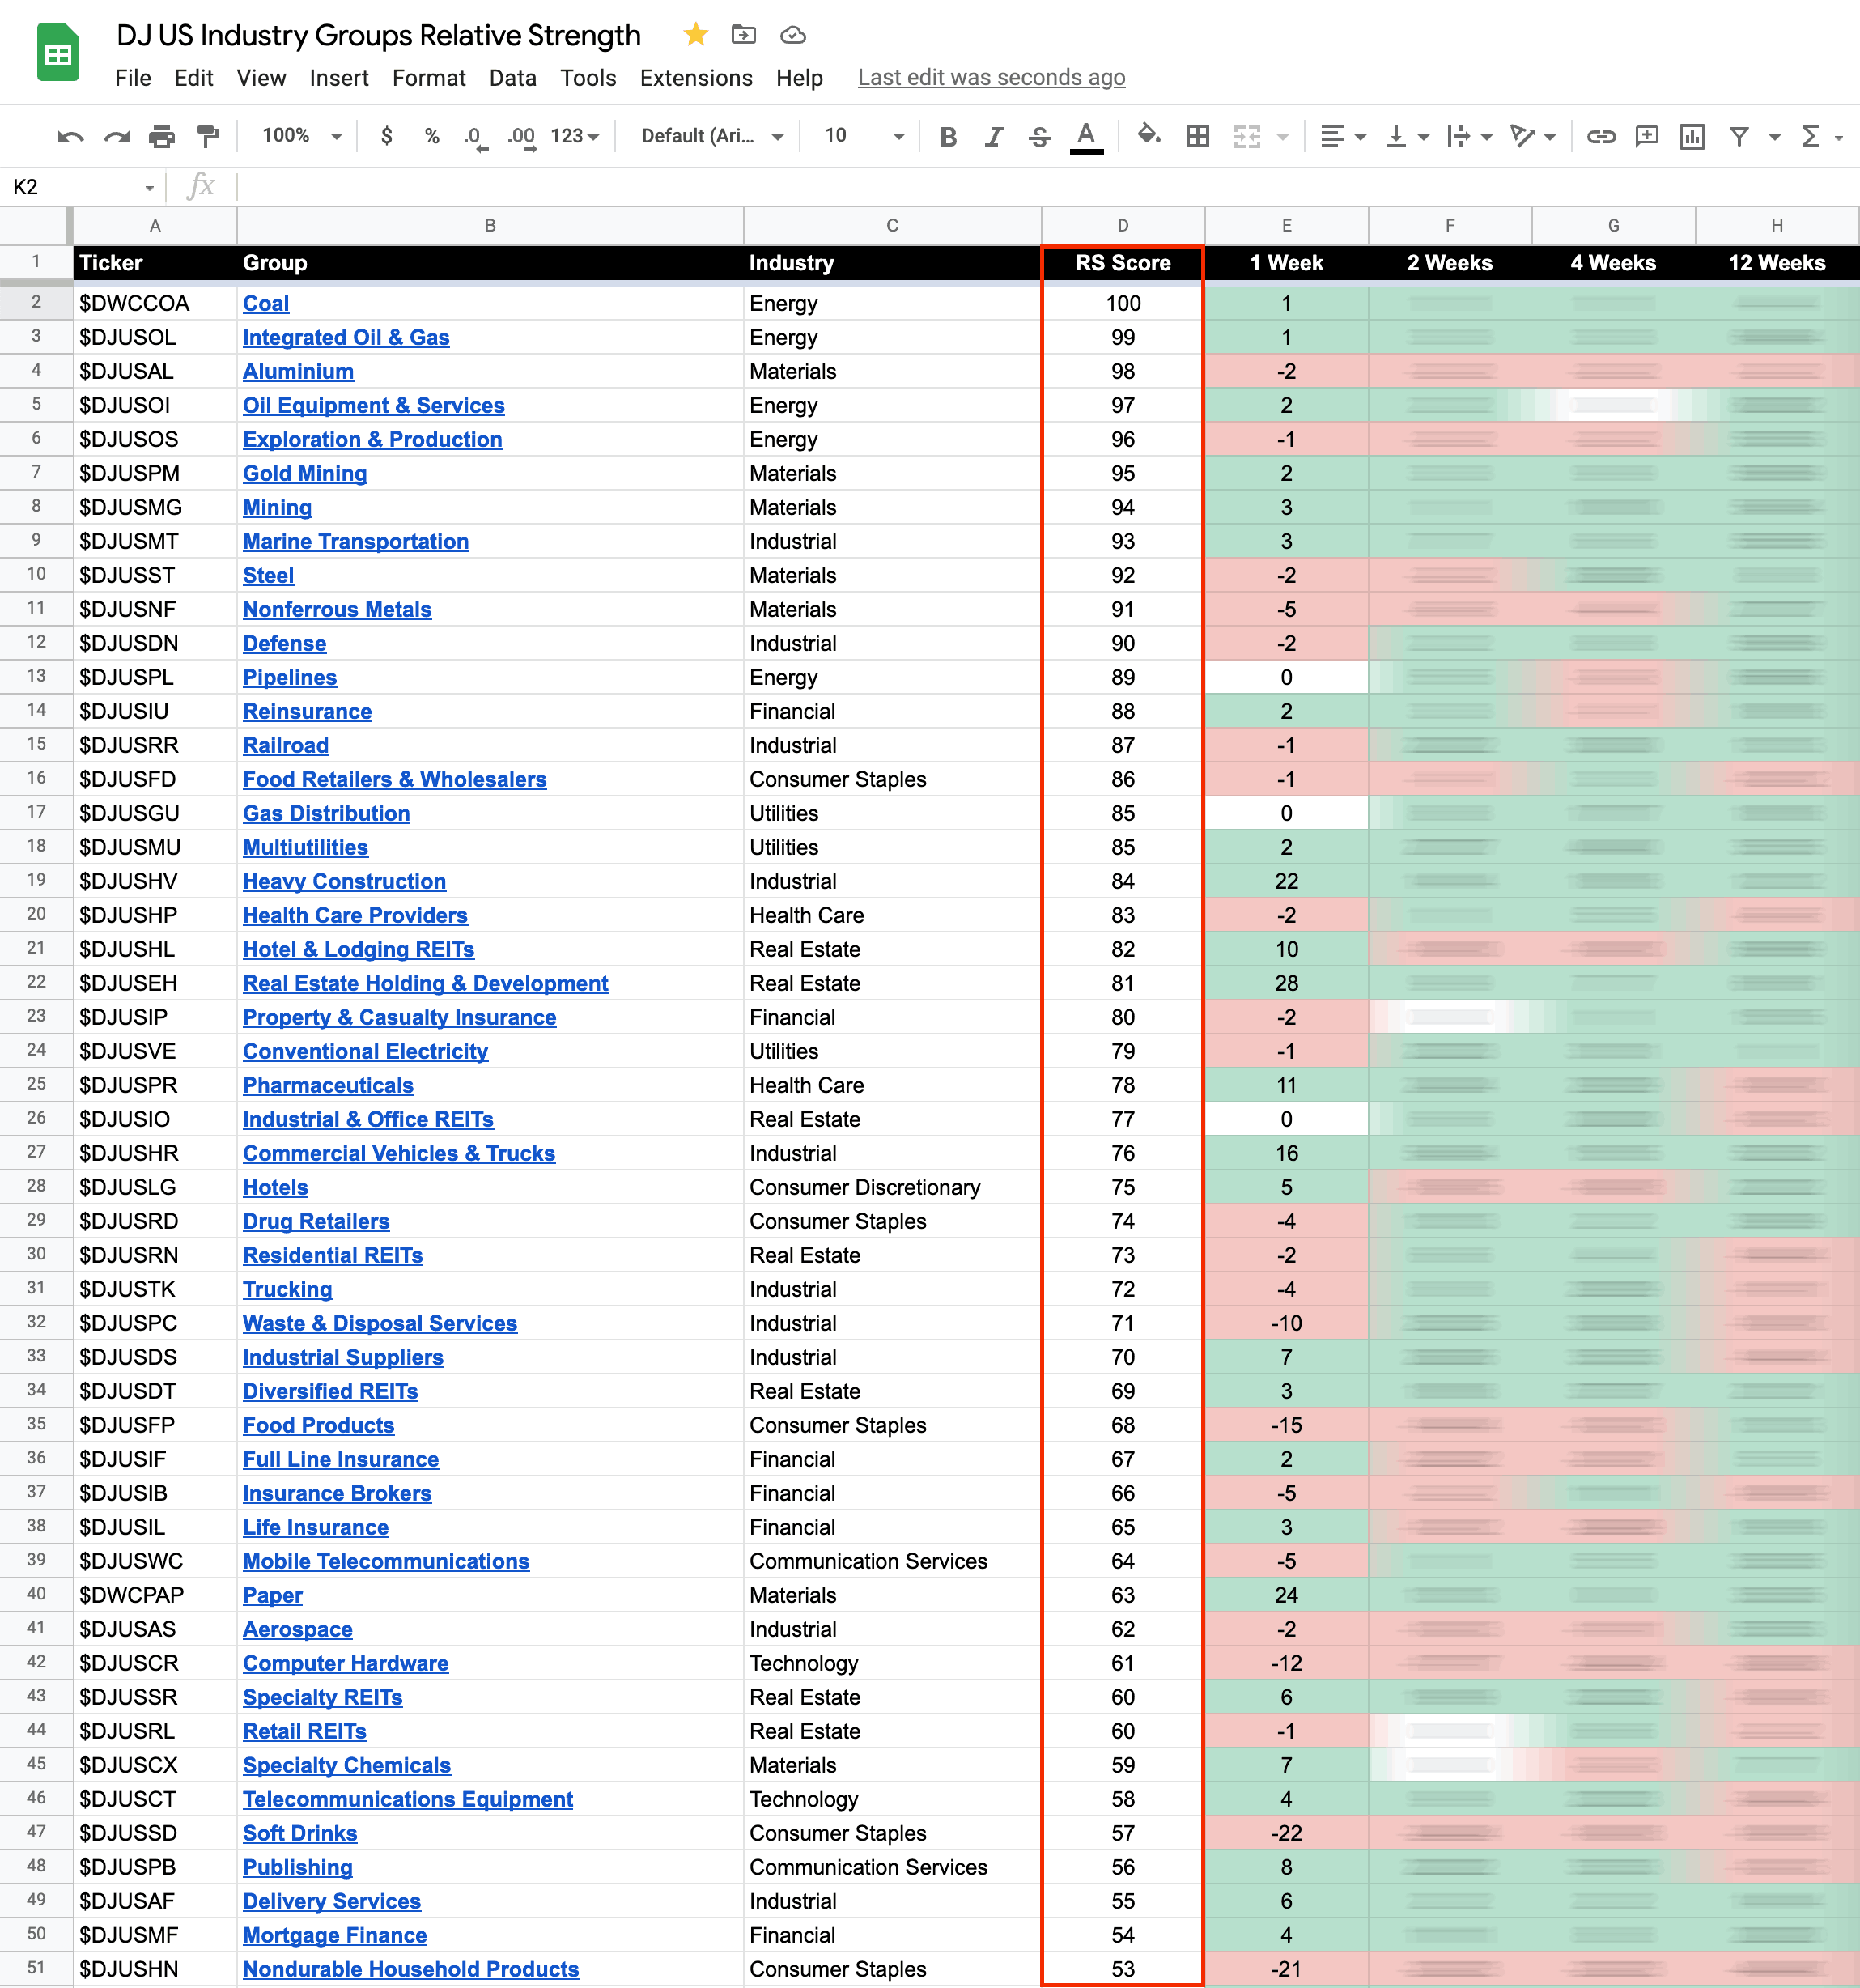
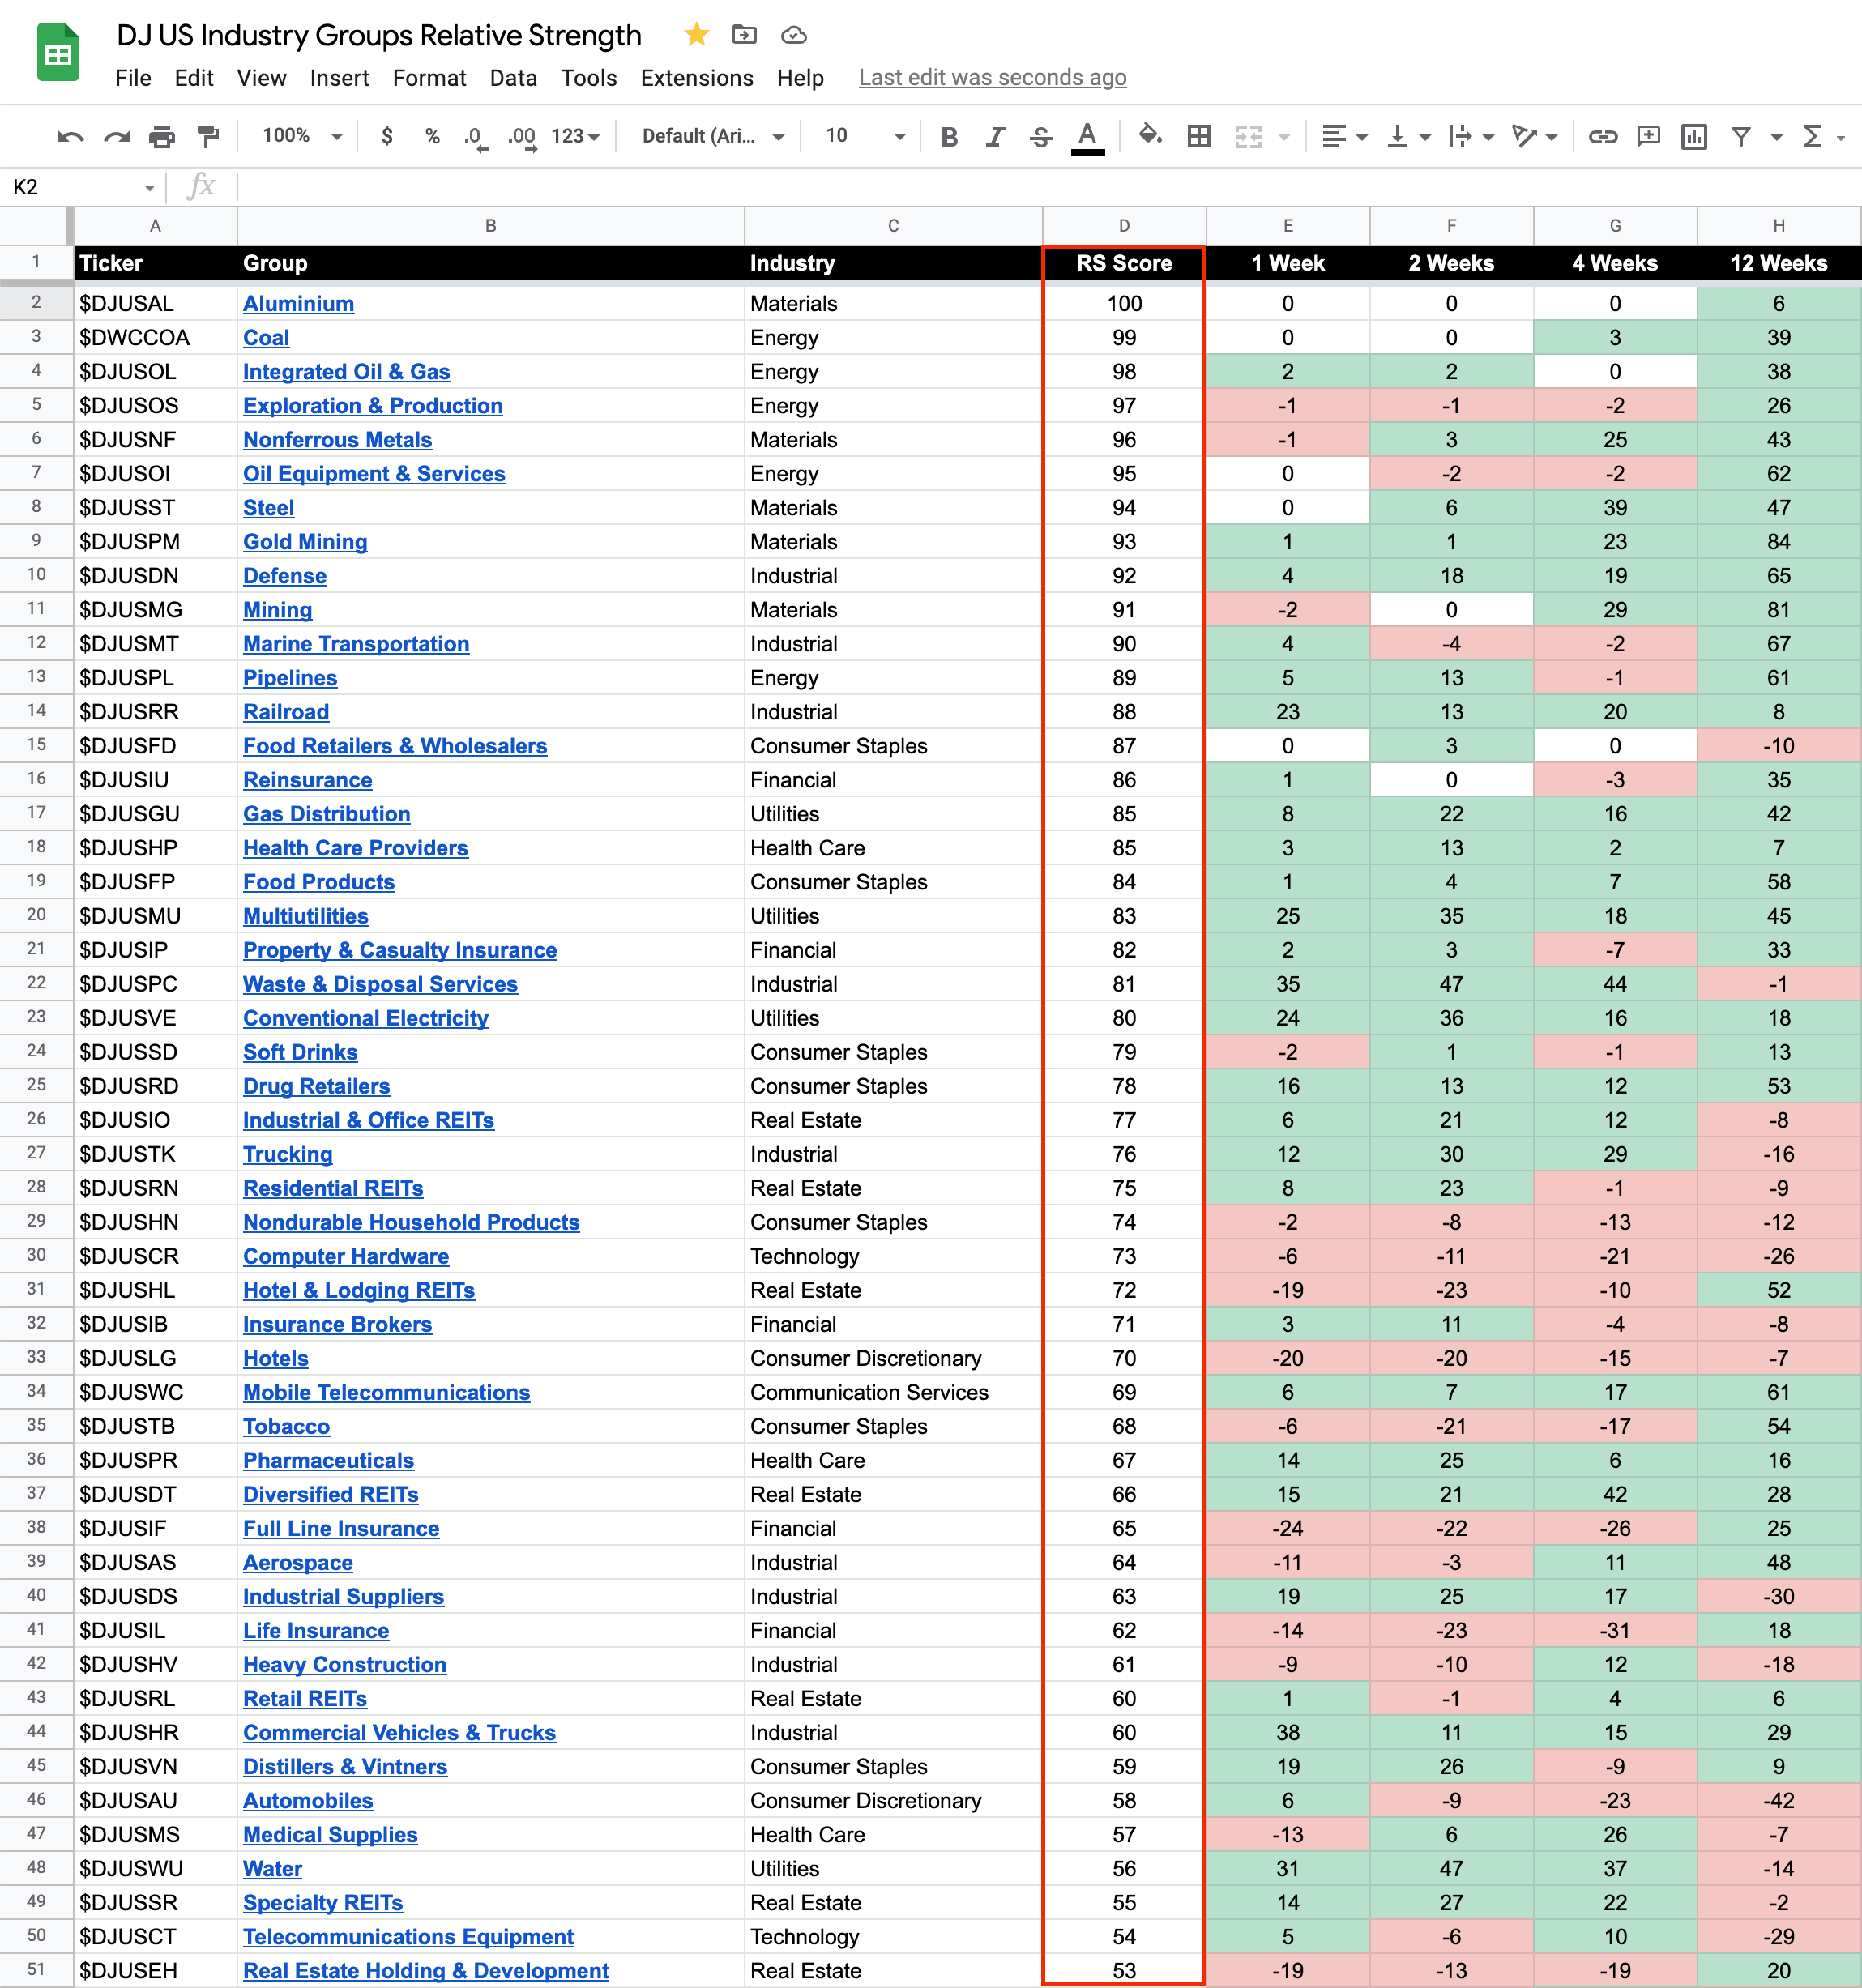
US Stocks Industry Groups Relative Strength Rankings
The purpose of the RS tables is to track the short, medium and long term RS changes of the individual groups to find the new leadership earlier than the crowd...
Read More
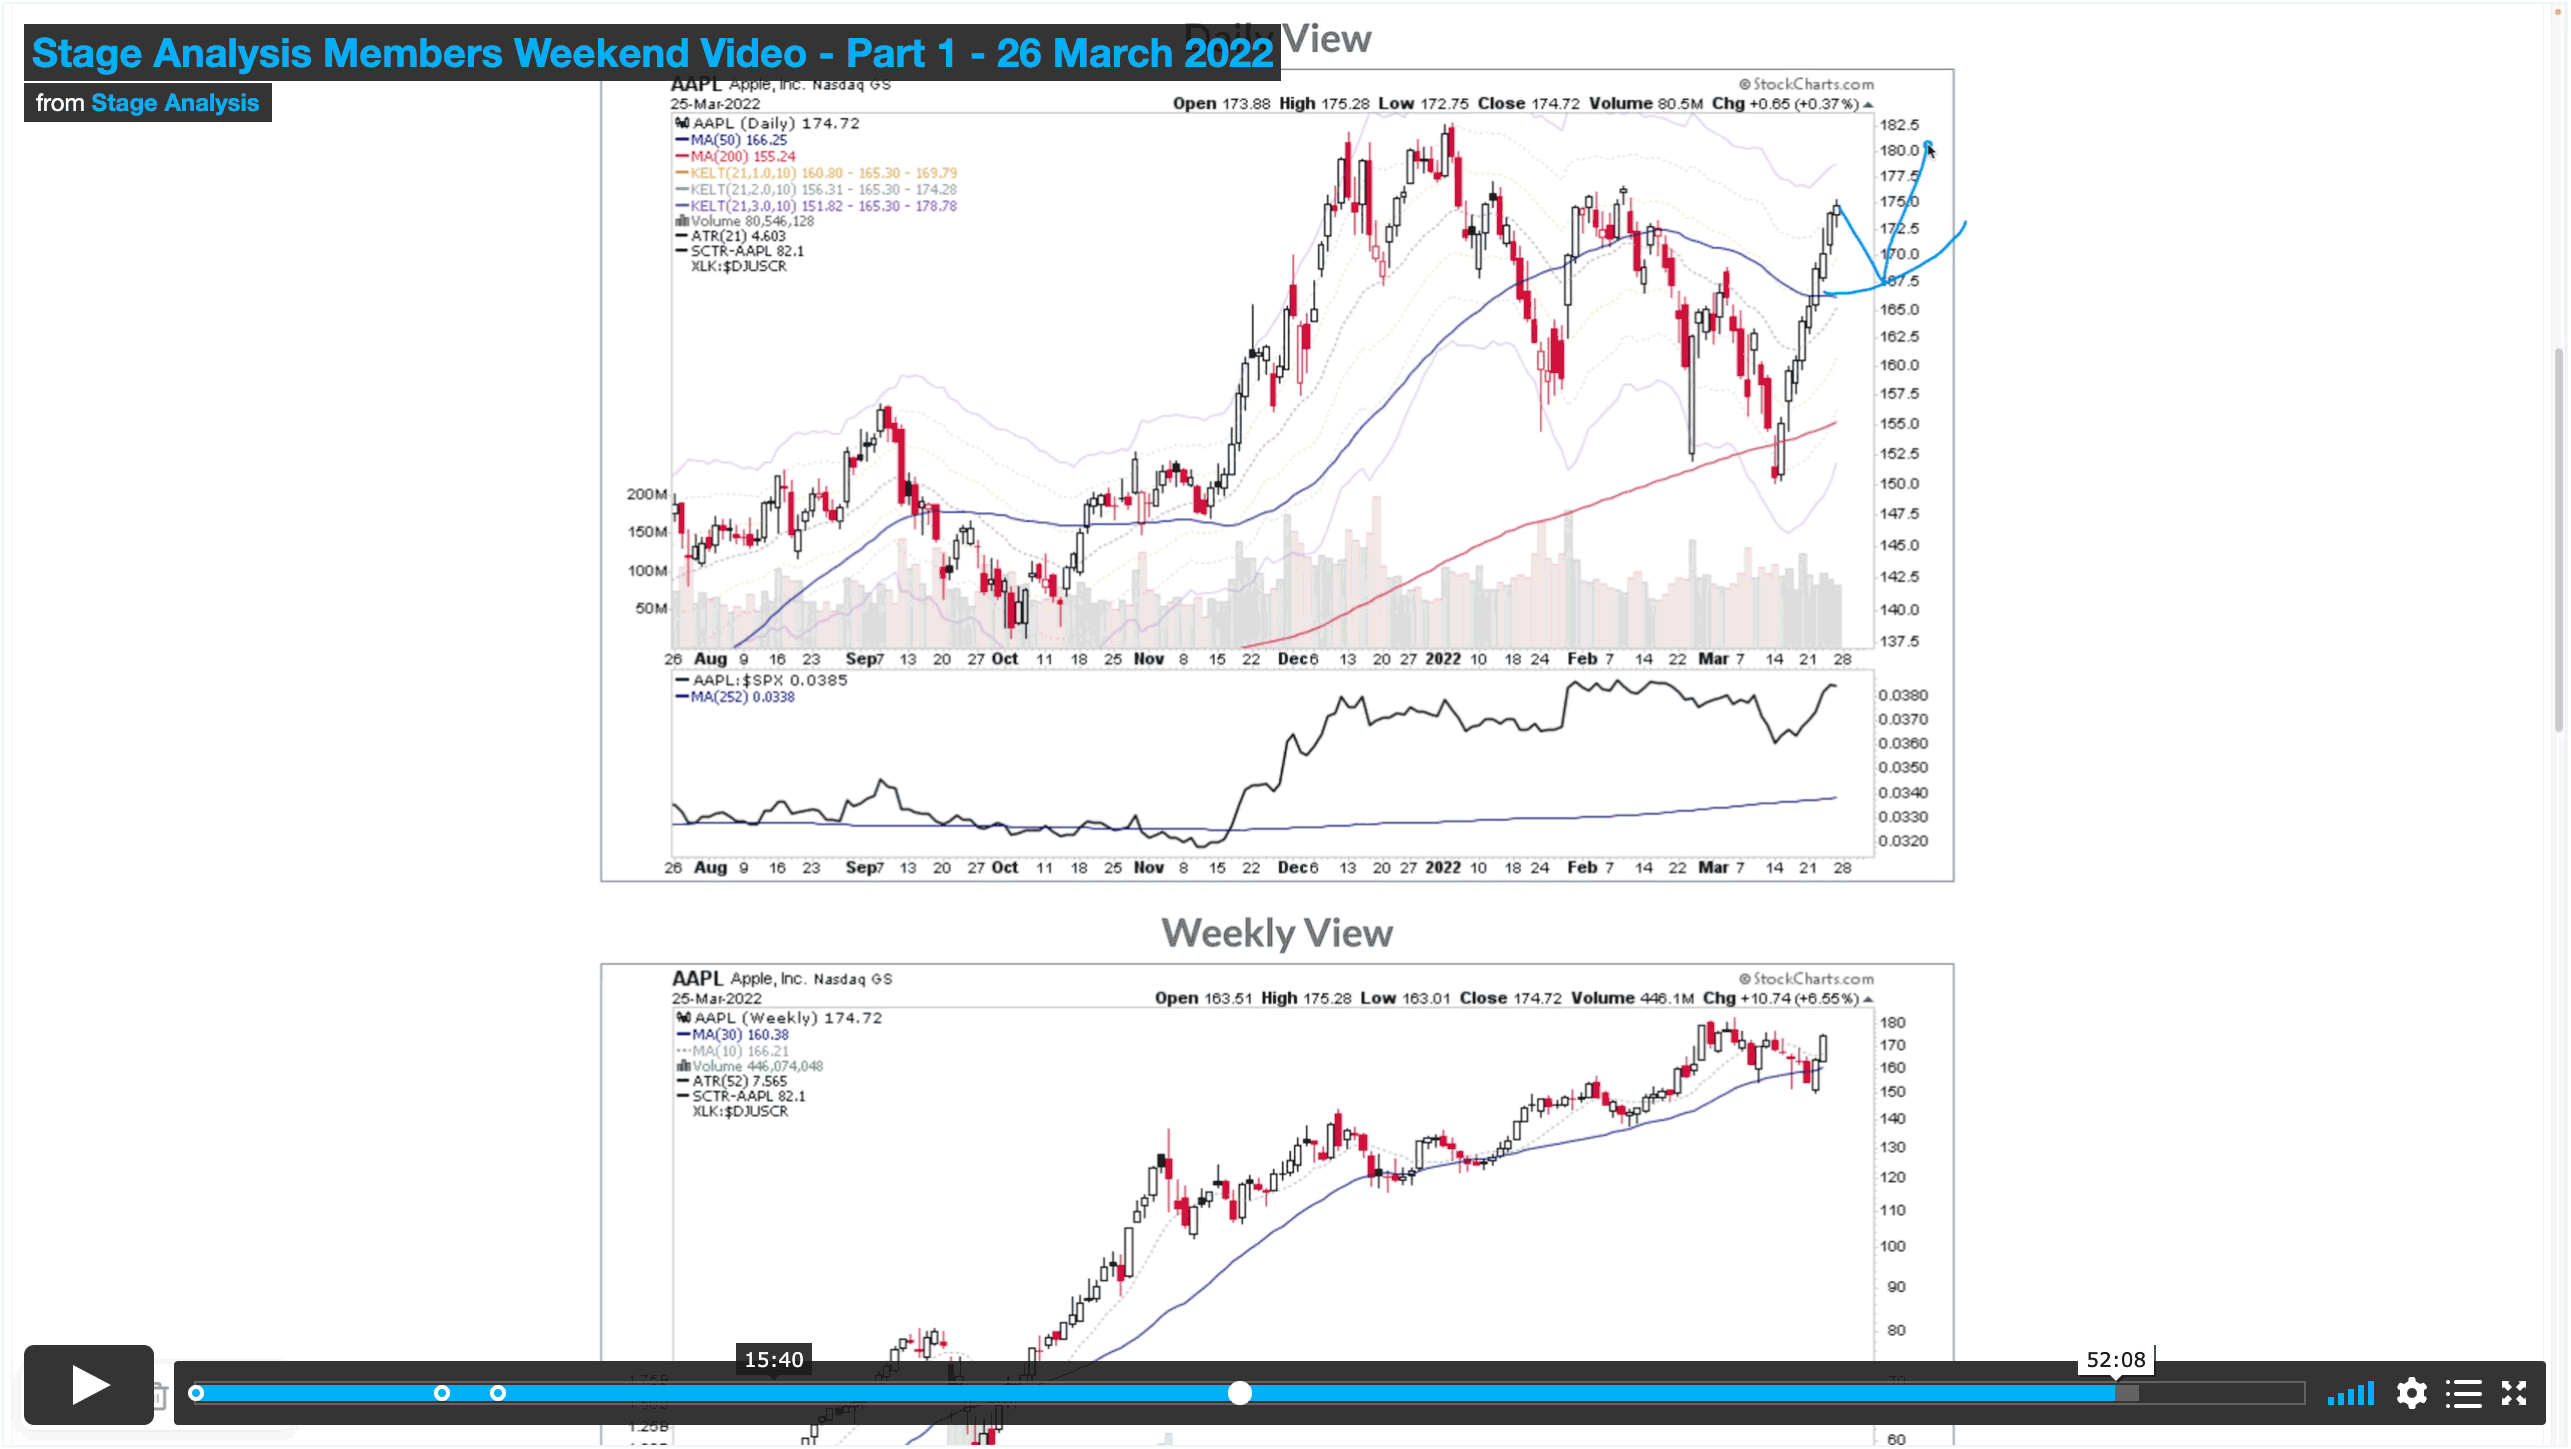
26 March, 2022
Stage Analysis Members Weekend Video – Part 1 – 26 March 2022 (57 mins)
In Part 1 of the Stage Analysis Members Video I cover the Major Indexes (i.e. S&P 500, Nasdaq Composite, Russell 2000 and the VIX etc), US Sectors Relative Strength Rankings and charts, Market Breadth charts to determine the Weight of Evidence, and the US Stocks Industry Group Relative Strength Tables and the Groups in focus this week.
Read More
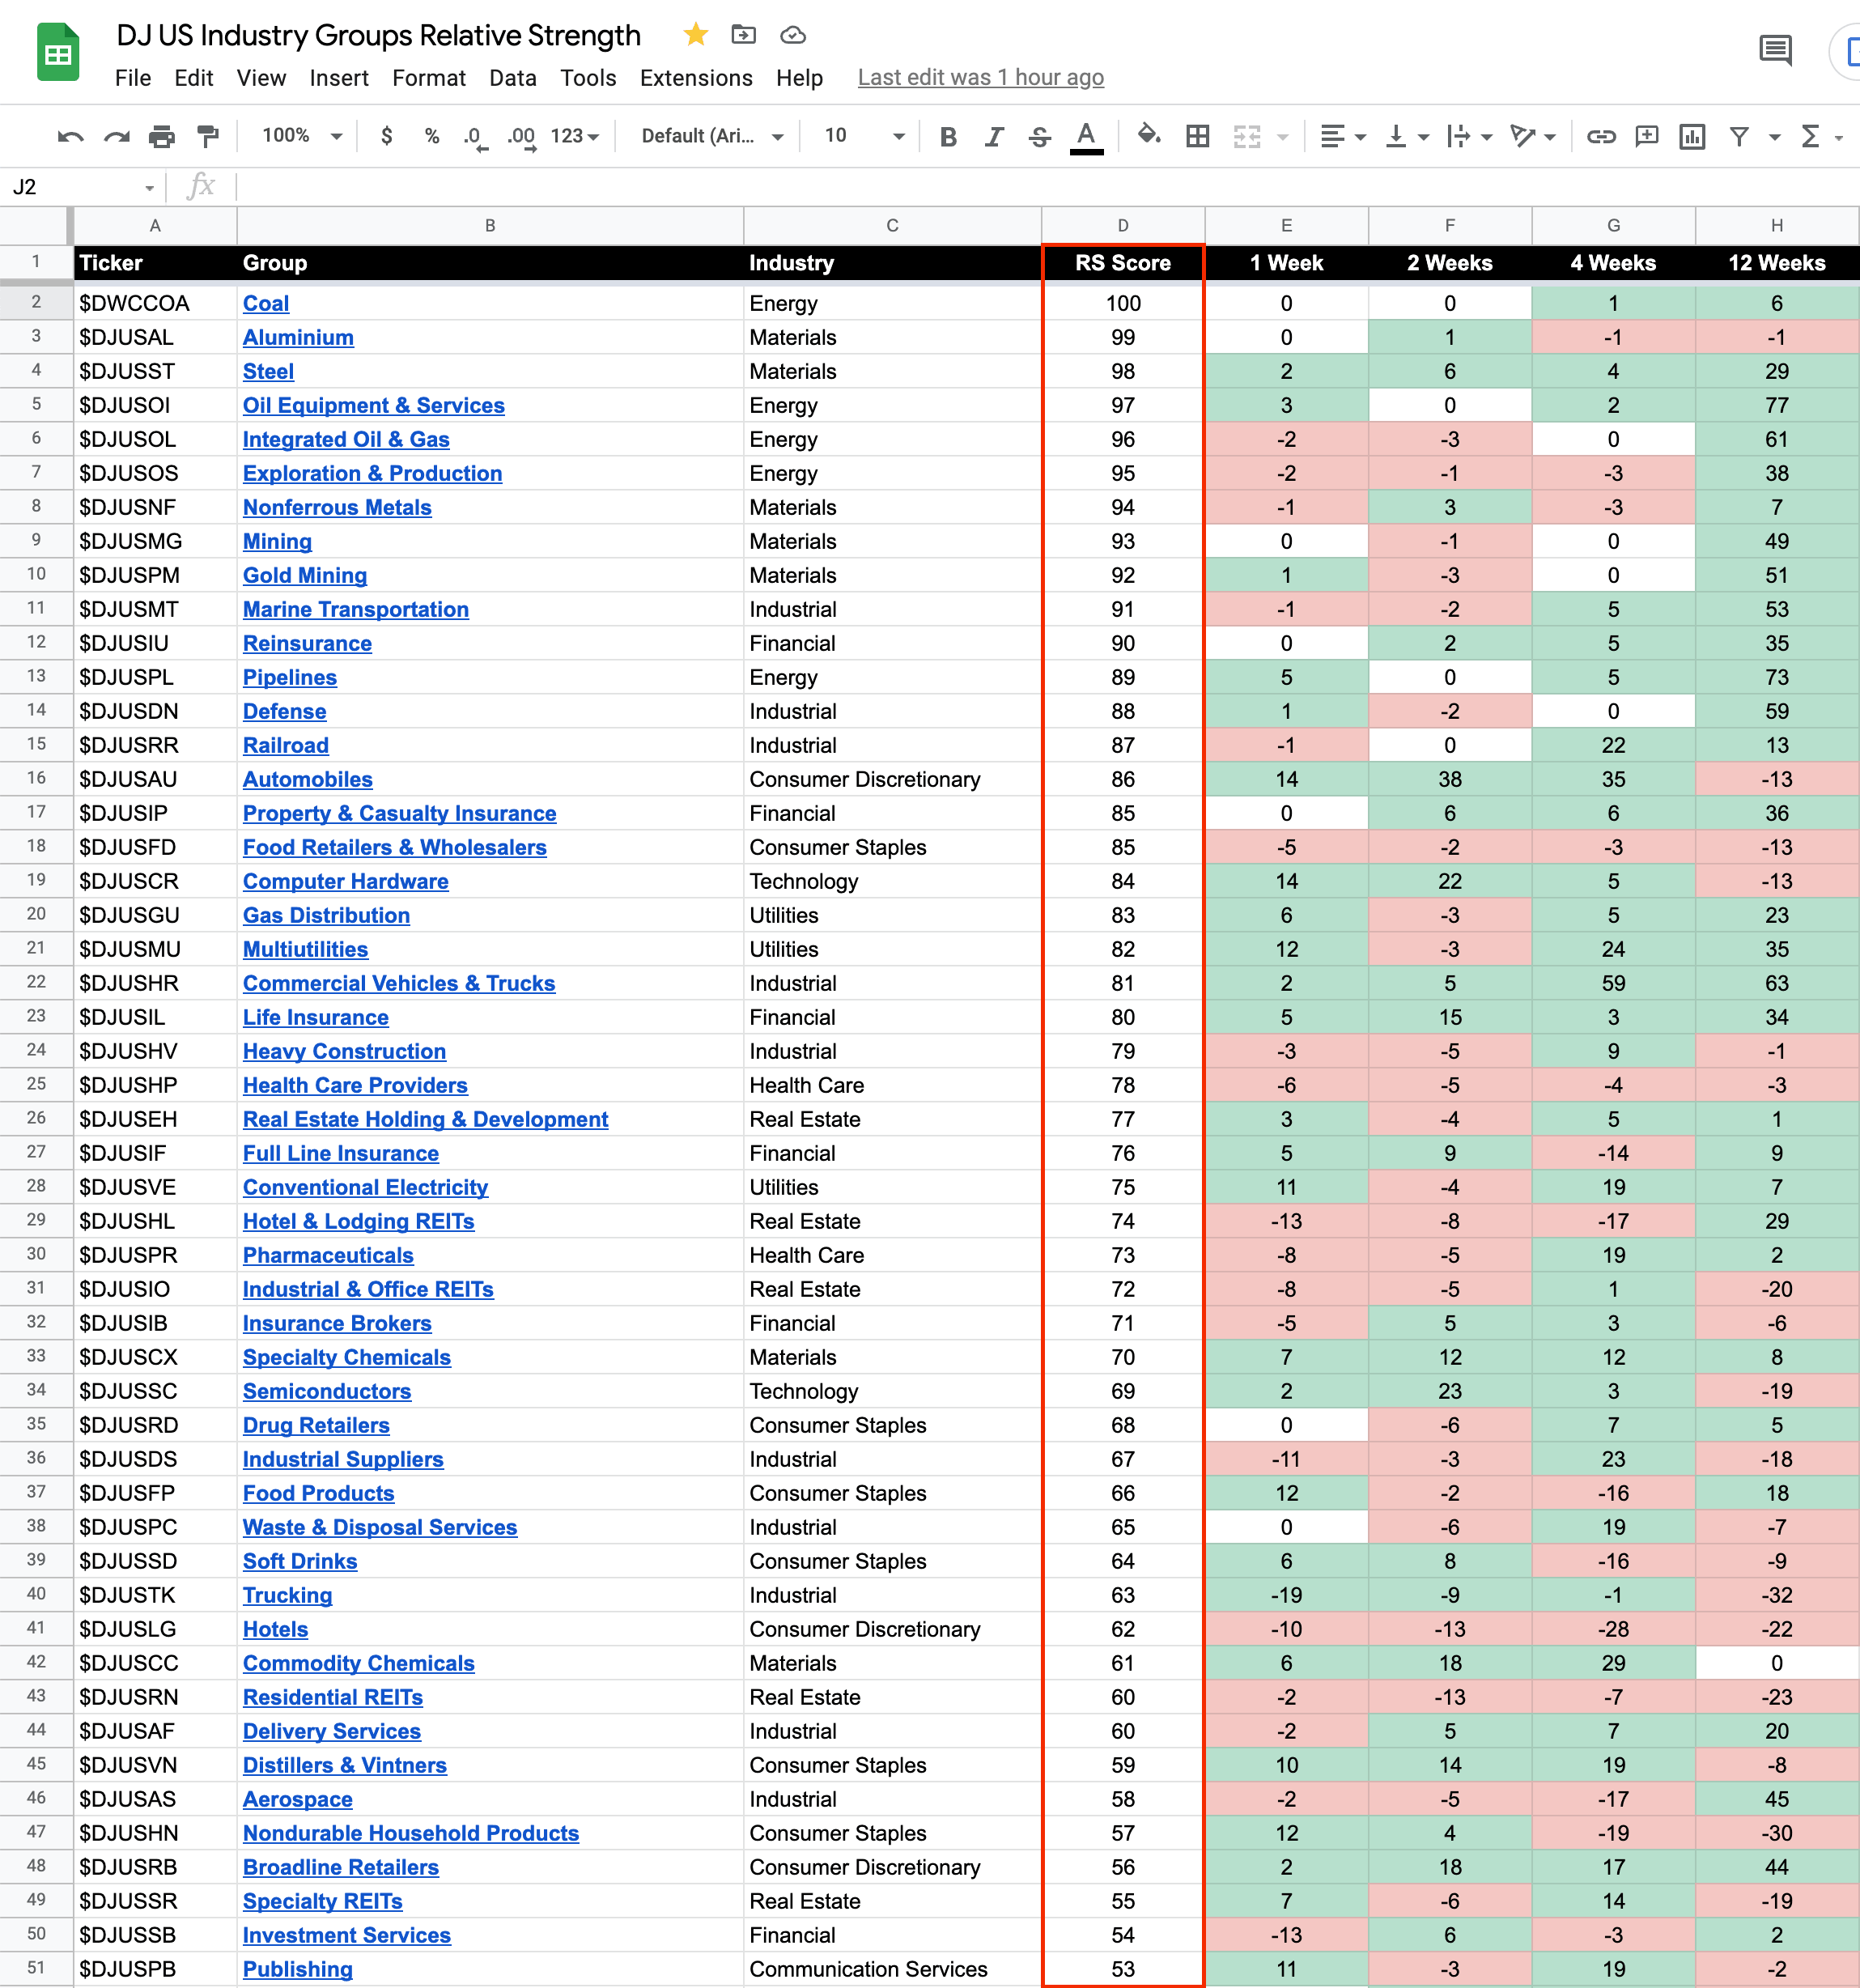
26 March, 2022
US Stocks Industry Groups Rankings
The purpose of the RS tables is to track the short, medium and long term RS changes of the individual groups to find the new leadership earlier than the crowd...
Read More
22 March, 2022
Industry Groups Bell Curve – Exclusive to Stage Analysis
Exclusive graphic of the 104 Dow Jones Industry Groups showing the Percentage of Stocks Above 30 week MA in each group visualised as a Bell Curve chart – inspired by the Sector Bell Curve work by Tom Dorsey in his Point & Figure book....
Read More
18 March, 2022
104 Dow Jones Industry Groups sorted by Relative Strength
The purpose of the RS tables is to track the short, medium and long term RS changes of the individual groups to find the new leadership earlier than the crowd...
Read More
11 March, 2022
104 Dow Jones Industry Groups sorted by Relative Strength
The purpose of the RS tables is to track the short, medium and long term RS changes of the individual groups to find the new leadership earlier than the crowd...
Read More
05 March, 2022
104 Dow Jones Industry Groups sorted by Relative Strength
The purpose of the RS tables is to track the short, medium and long term RS changes of the individual groups to find the new leadership earlier than the crowd...
Read More