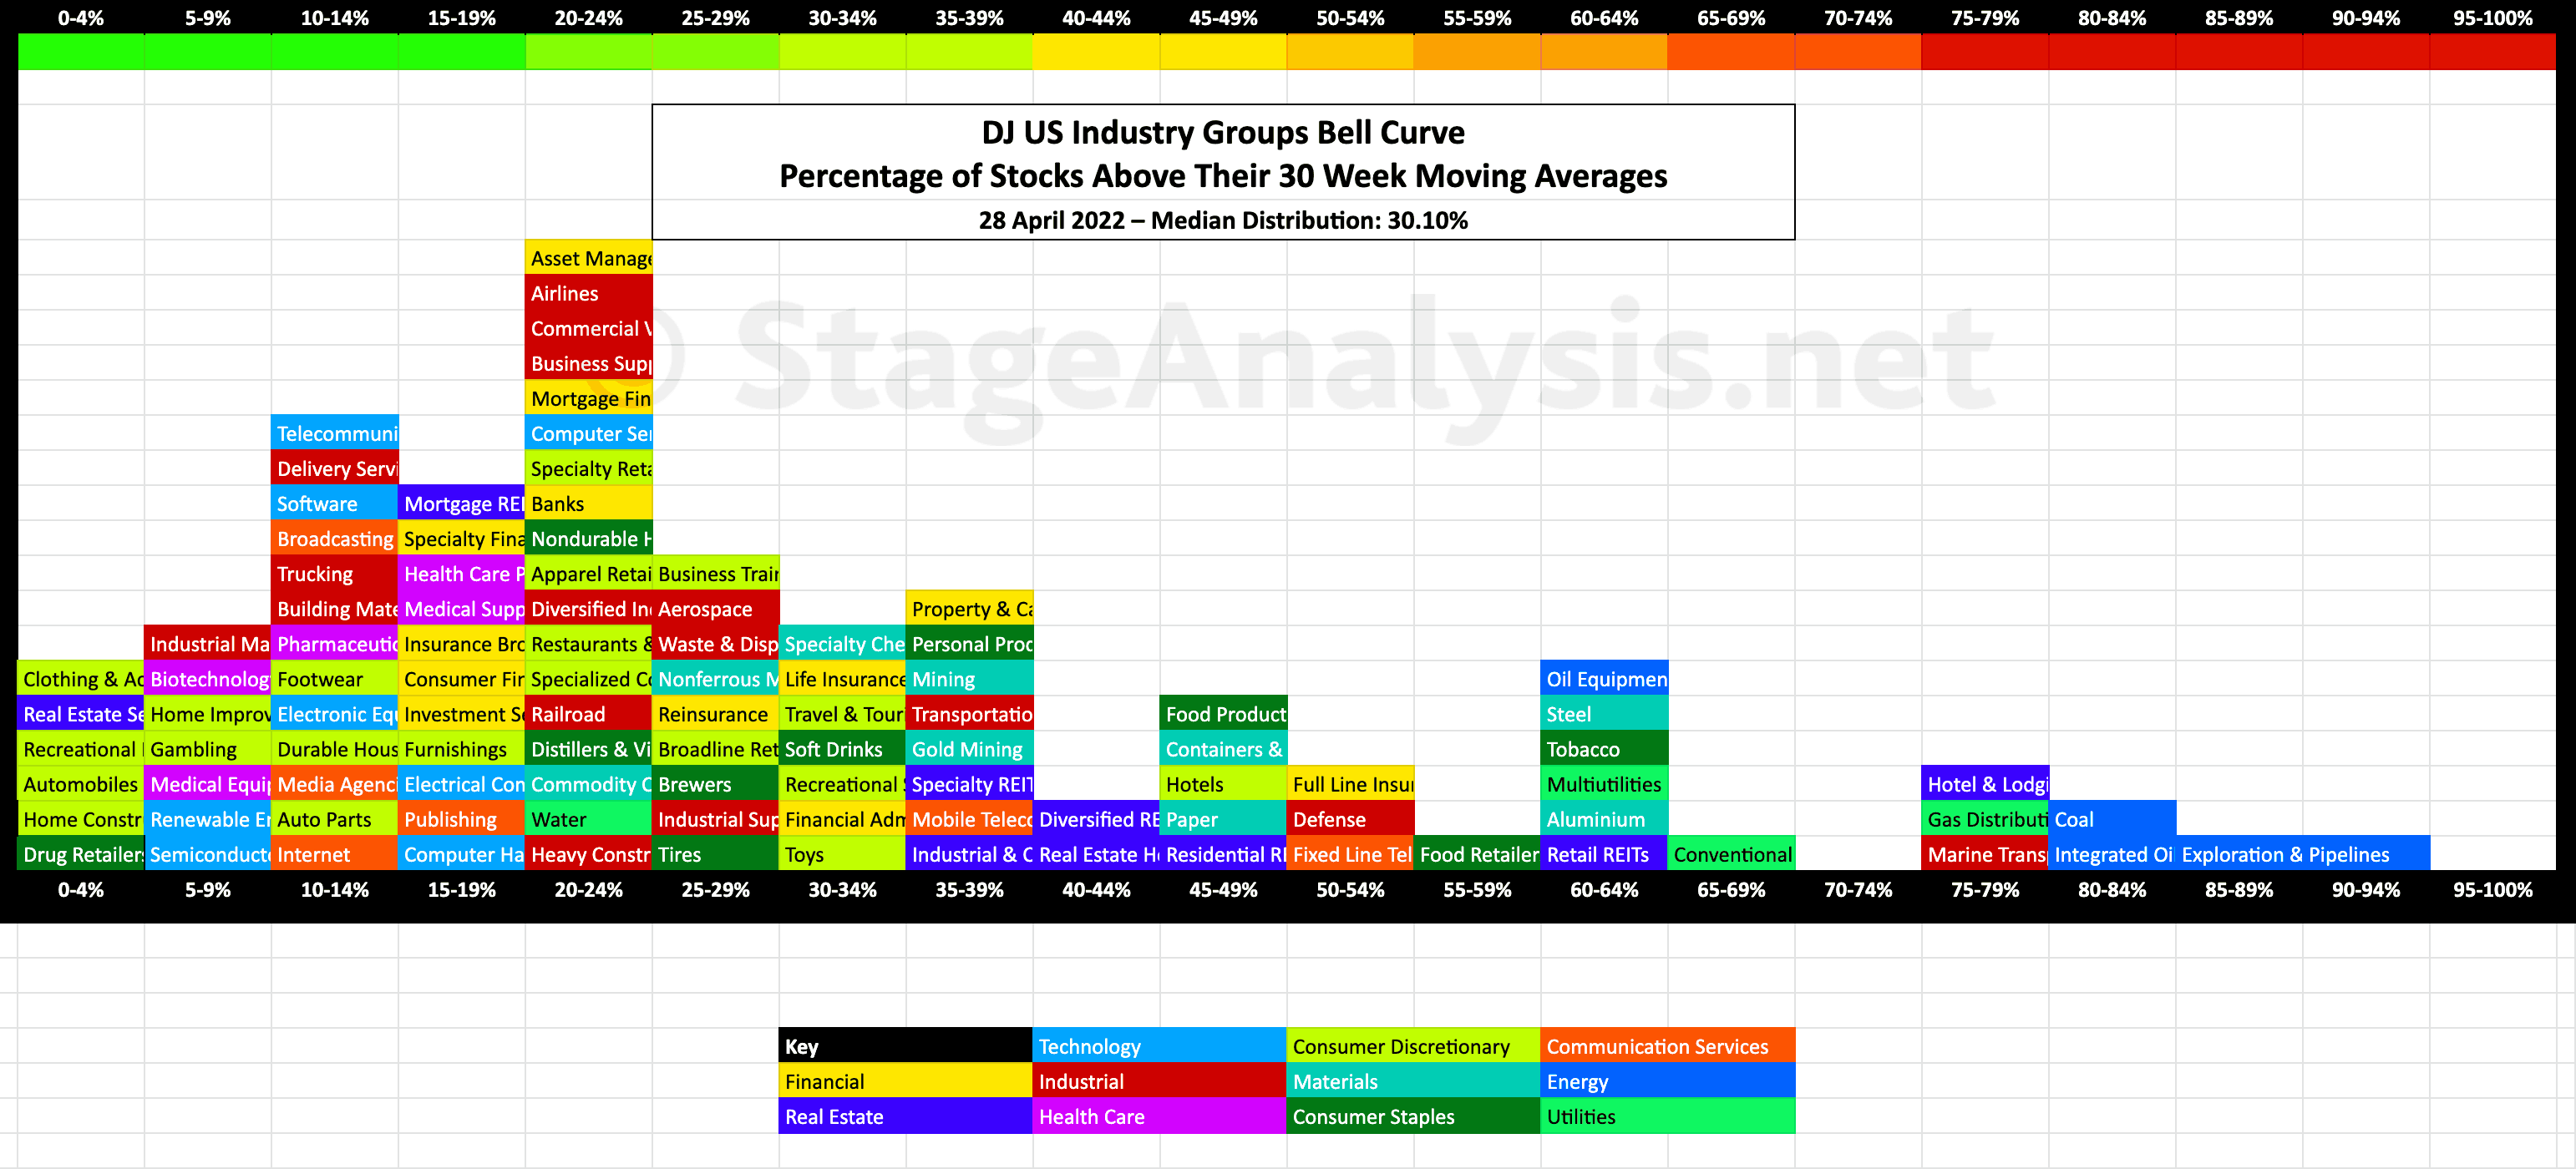
Exclusive graphic of the 104 Dow Jones Industry Groups showing the Percentage of Stocks Above 30 week MA in each group visualised as a Bell Curve chart – inspired by the Sector Bell Curve work by Tom Dorsey in his Point & Figure book....
Read More

Blog
28 April, 2022
US Industry Groups Bell Curve – Exclusive to Stage Analysis
24 April, 2022
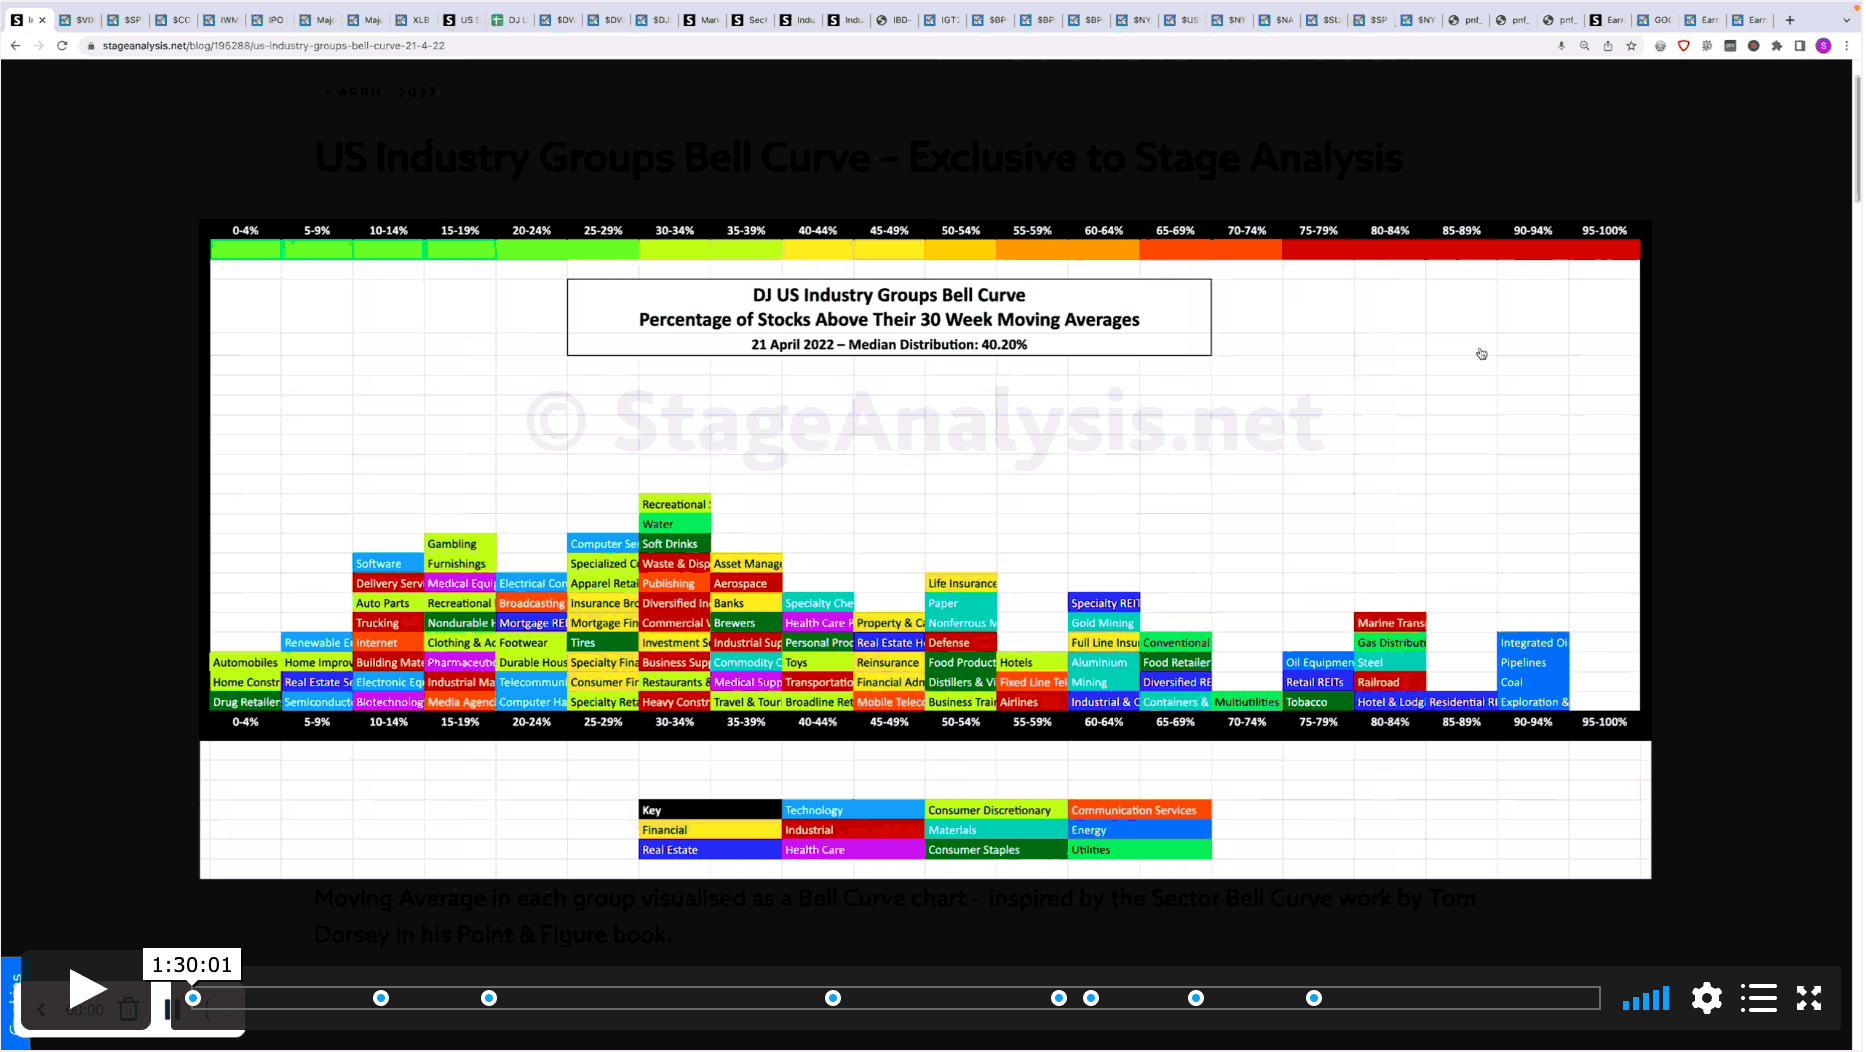
Stage Analysis Members Weekend Video - 24 April 2022 (1hr 30mins)
This weekends Stage Analysis Members Video features analysis of the Major US Stock Market Indexes – S&P 500, Nasdaq Composite, Russell 2000 and the individual US Market Sectors Stages. Plus the a detailed look at the US Industry Groups Relative Strength focusing on the Change of Behaviour in the strongest RS groups...
Read More
23 April, 2022
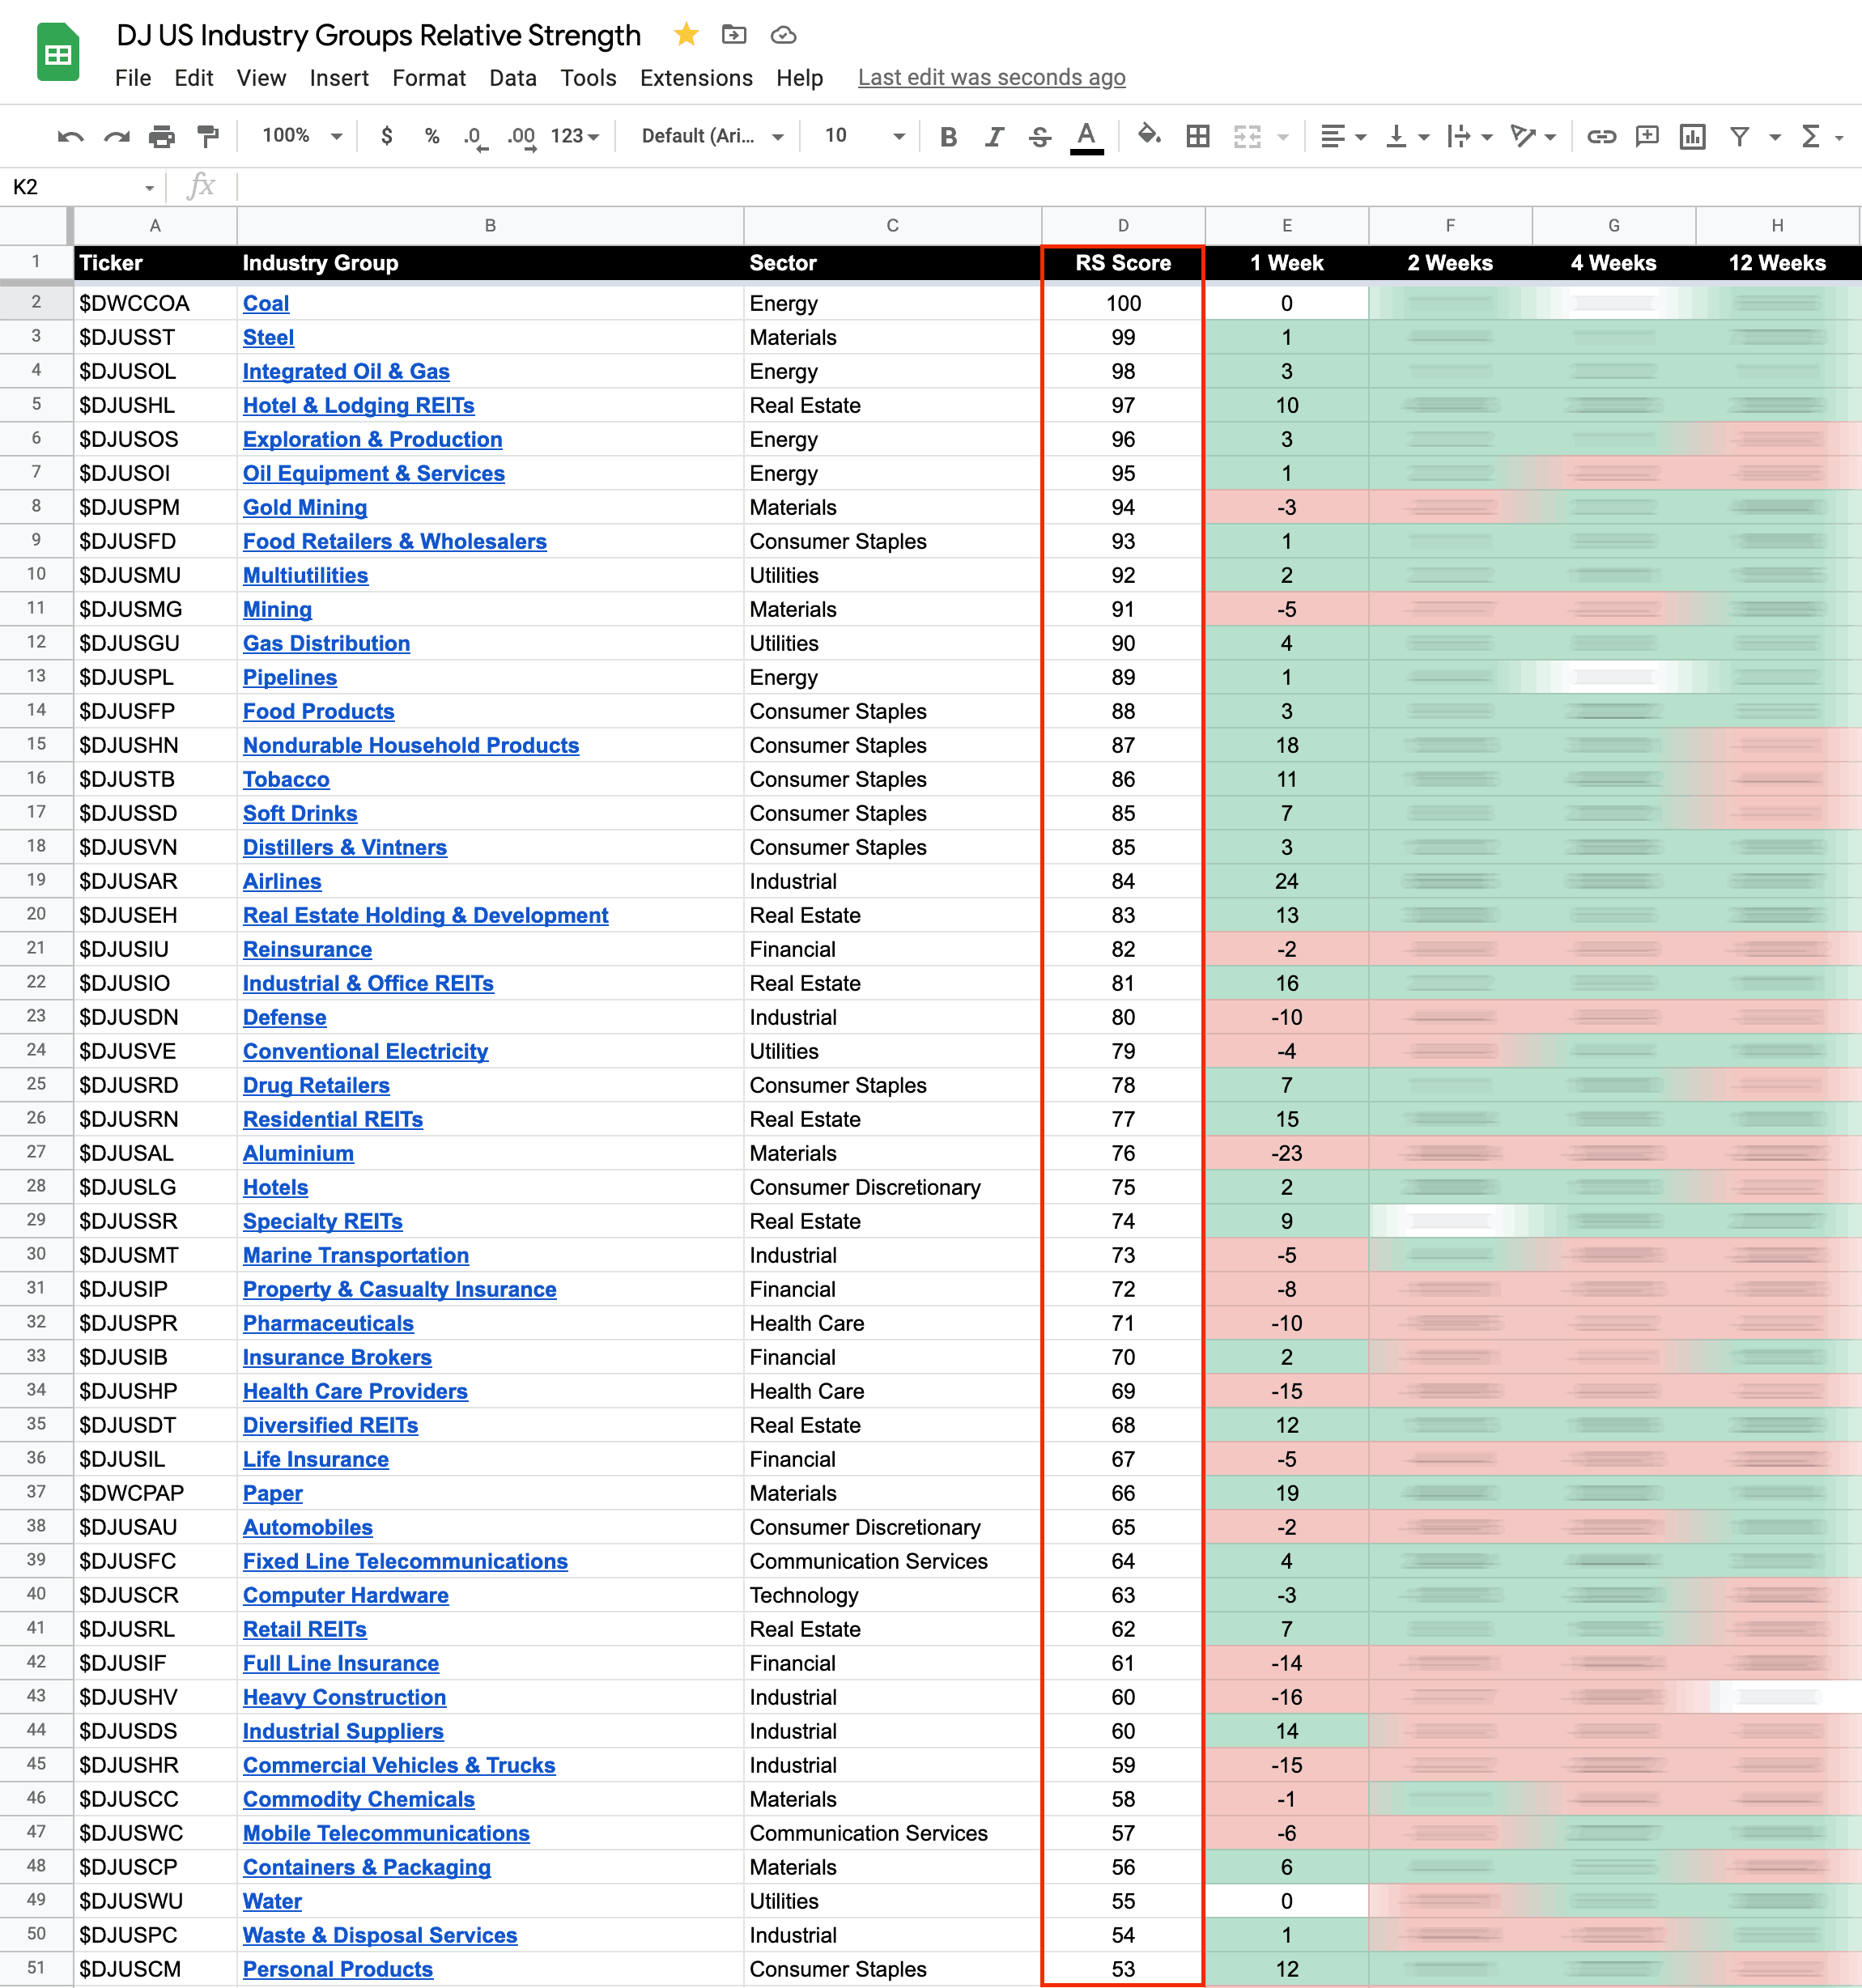
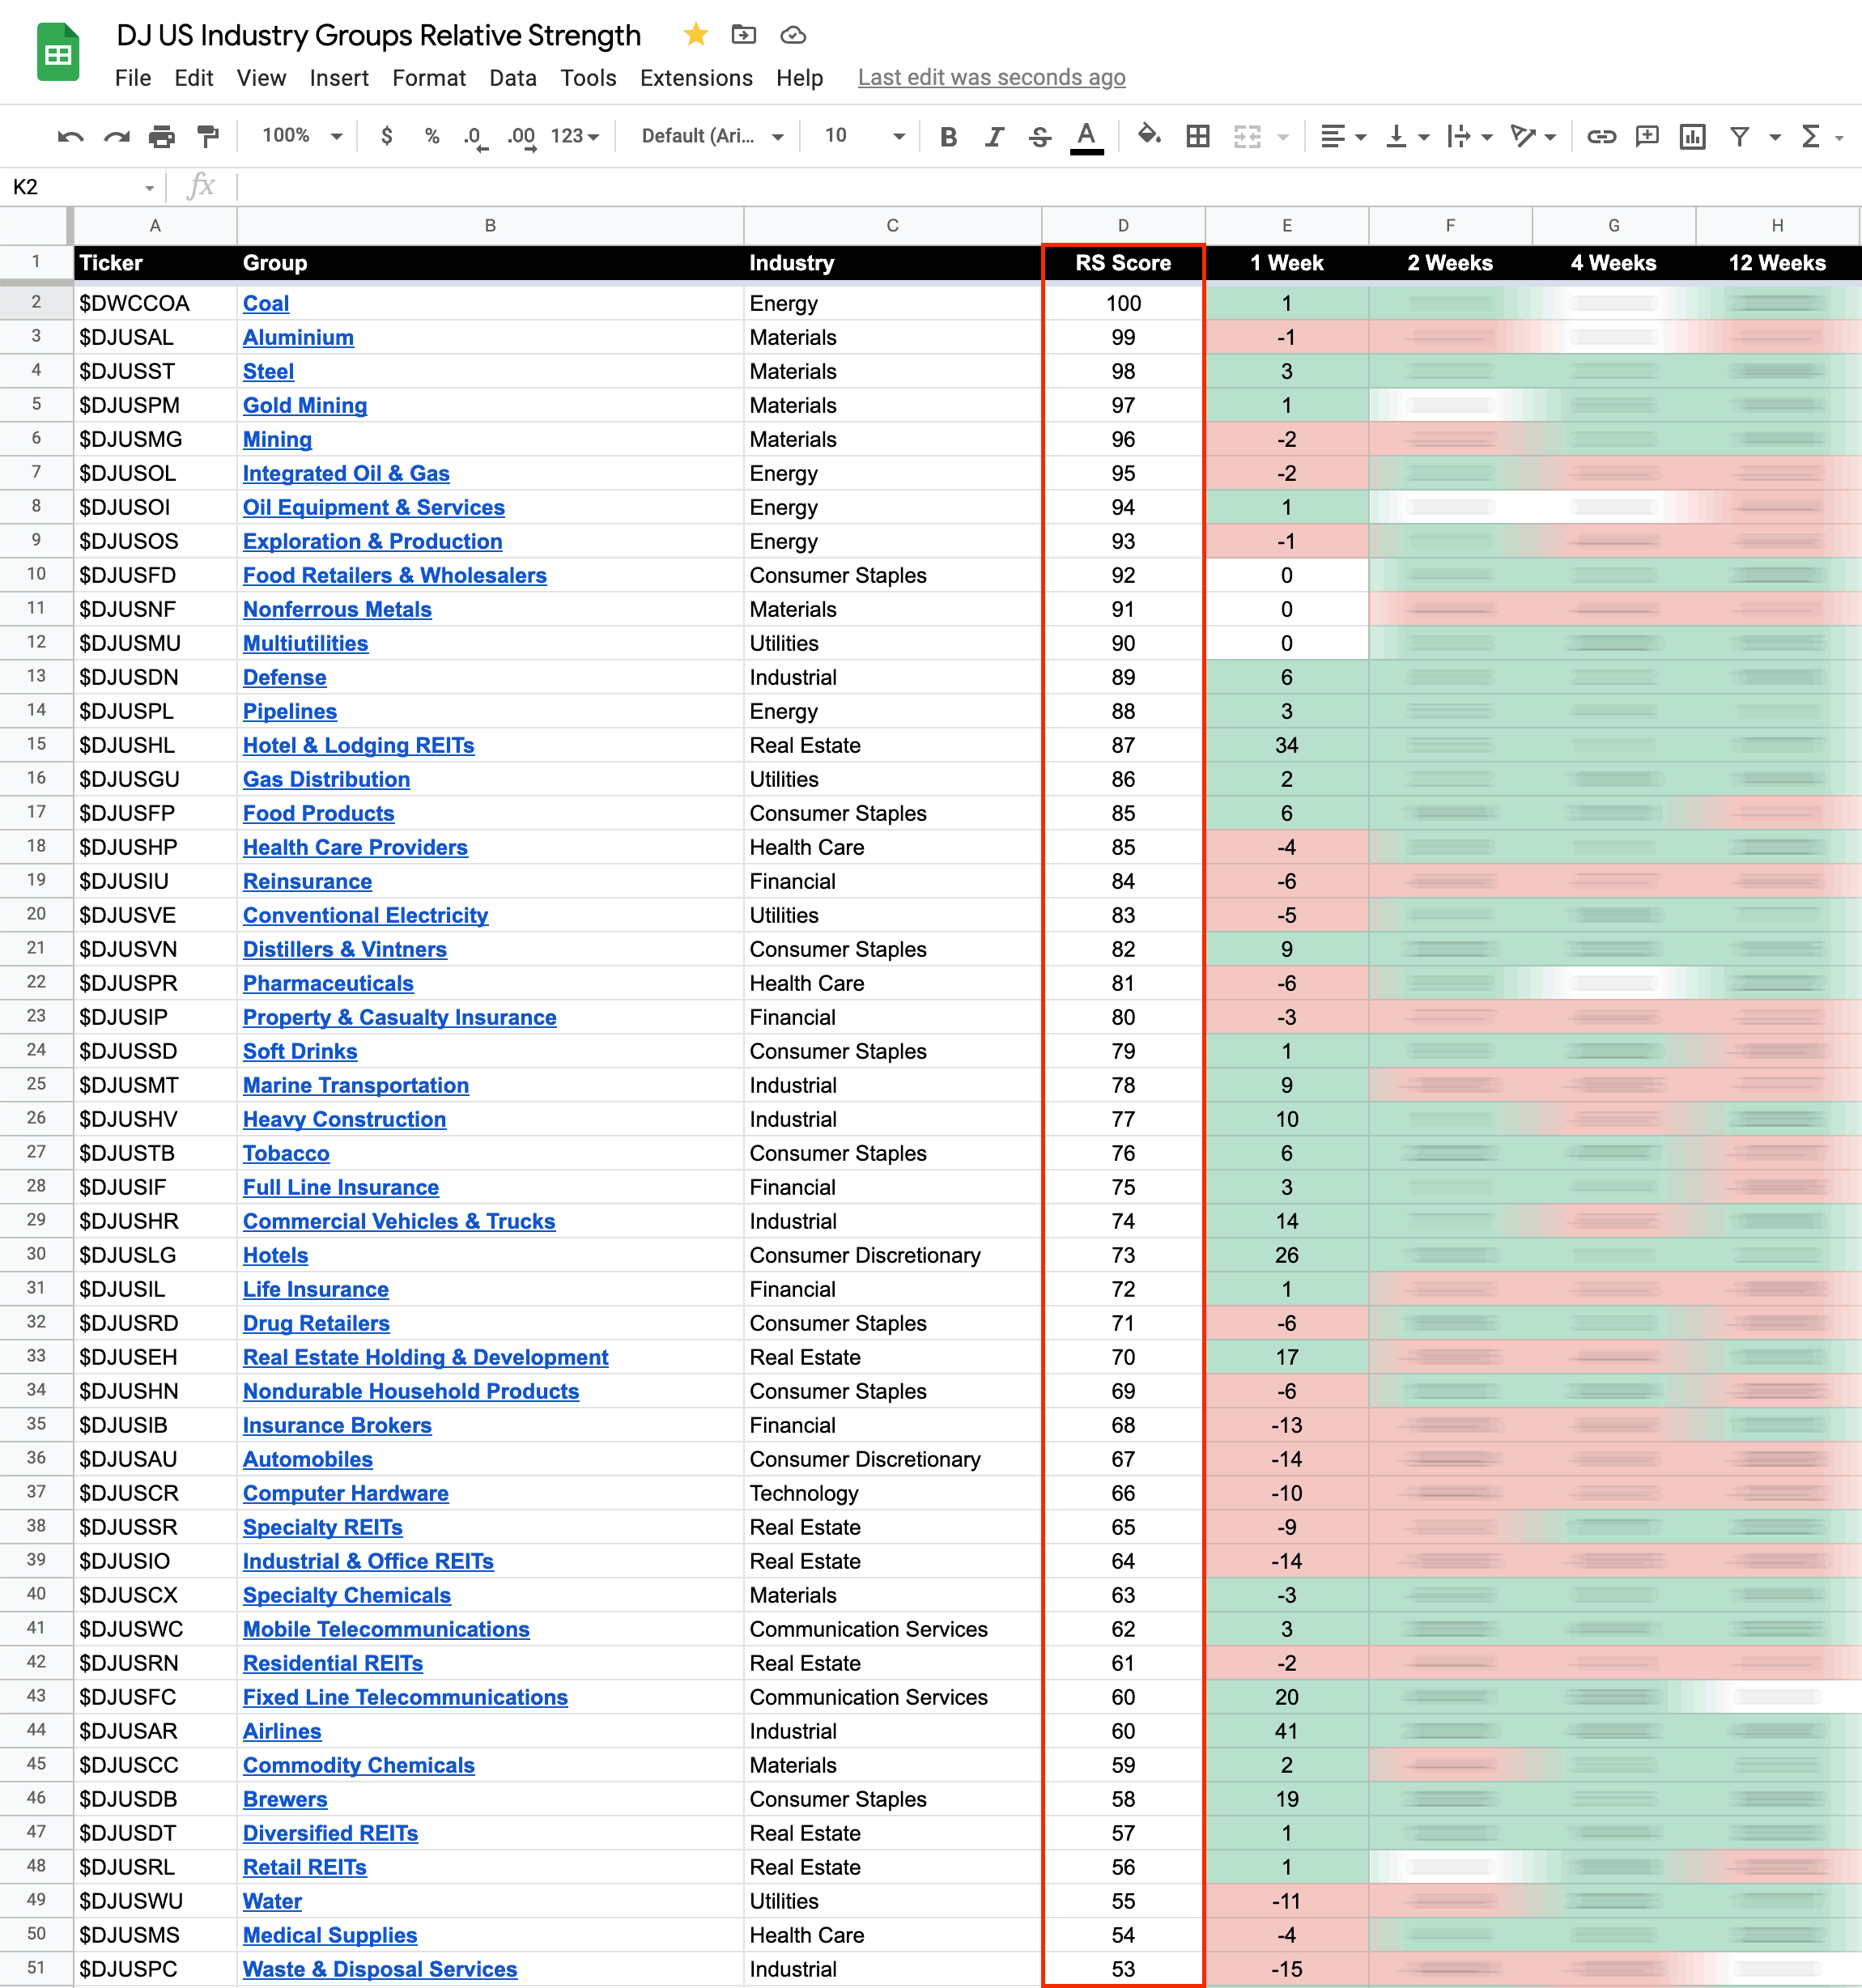
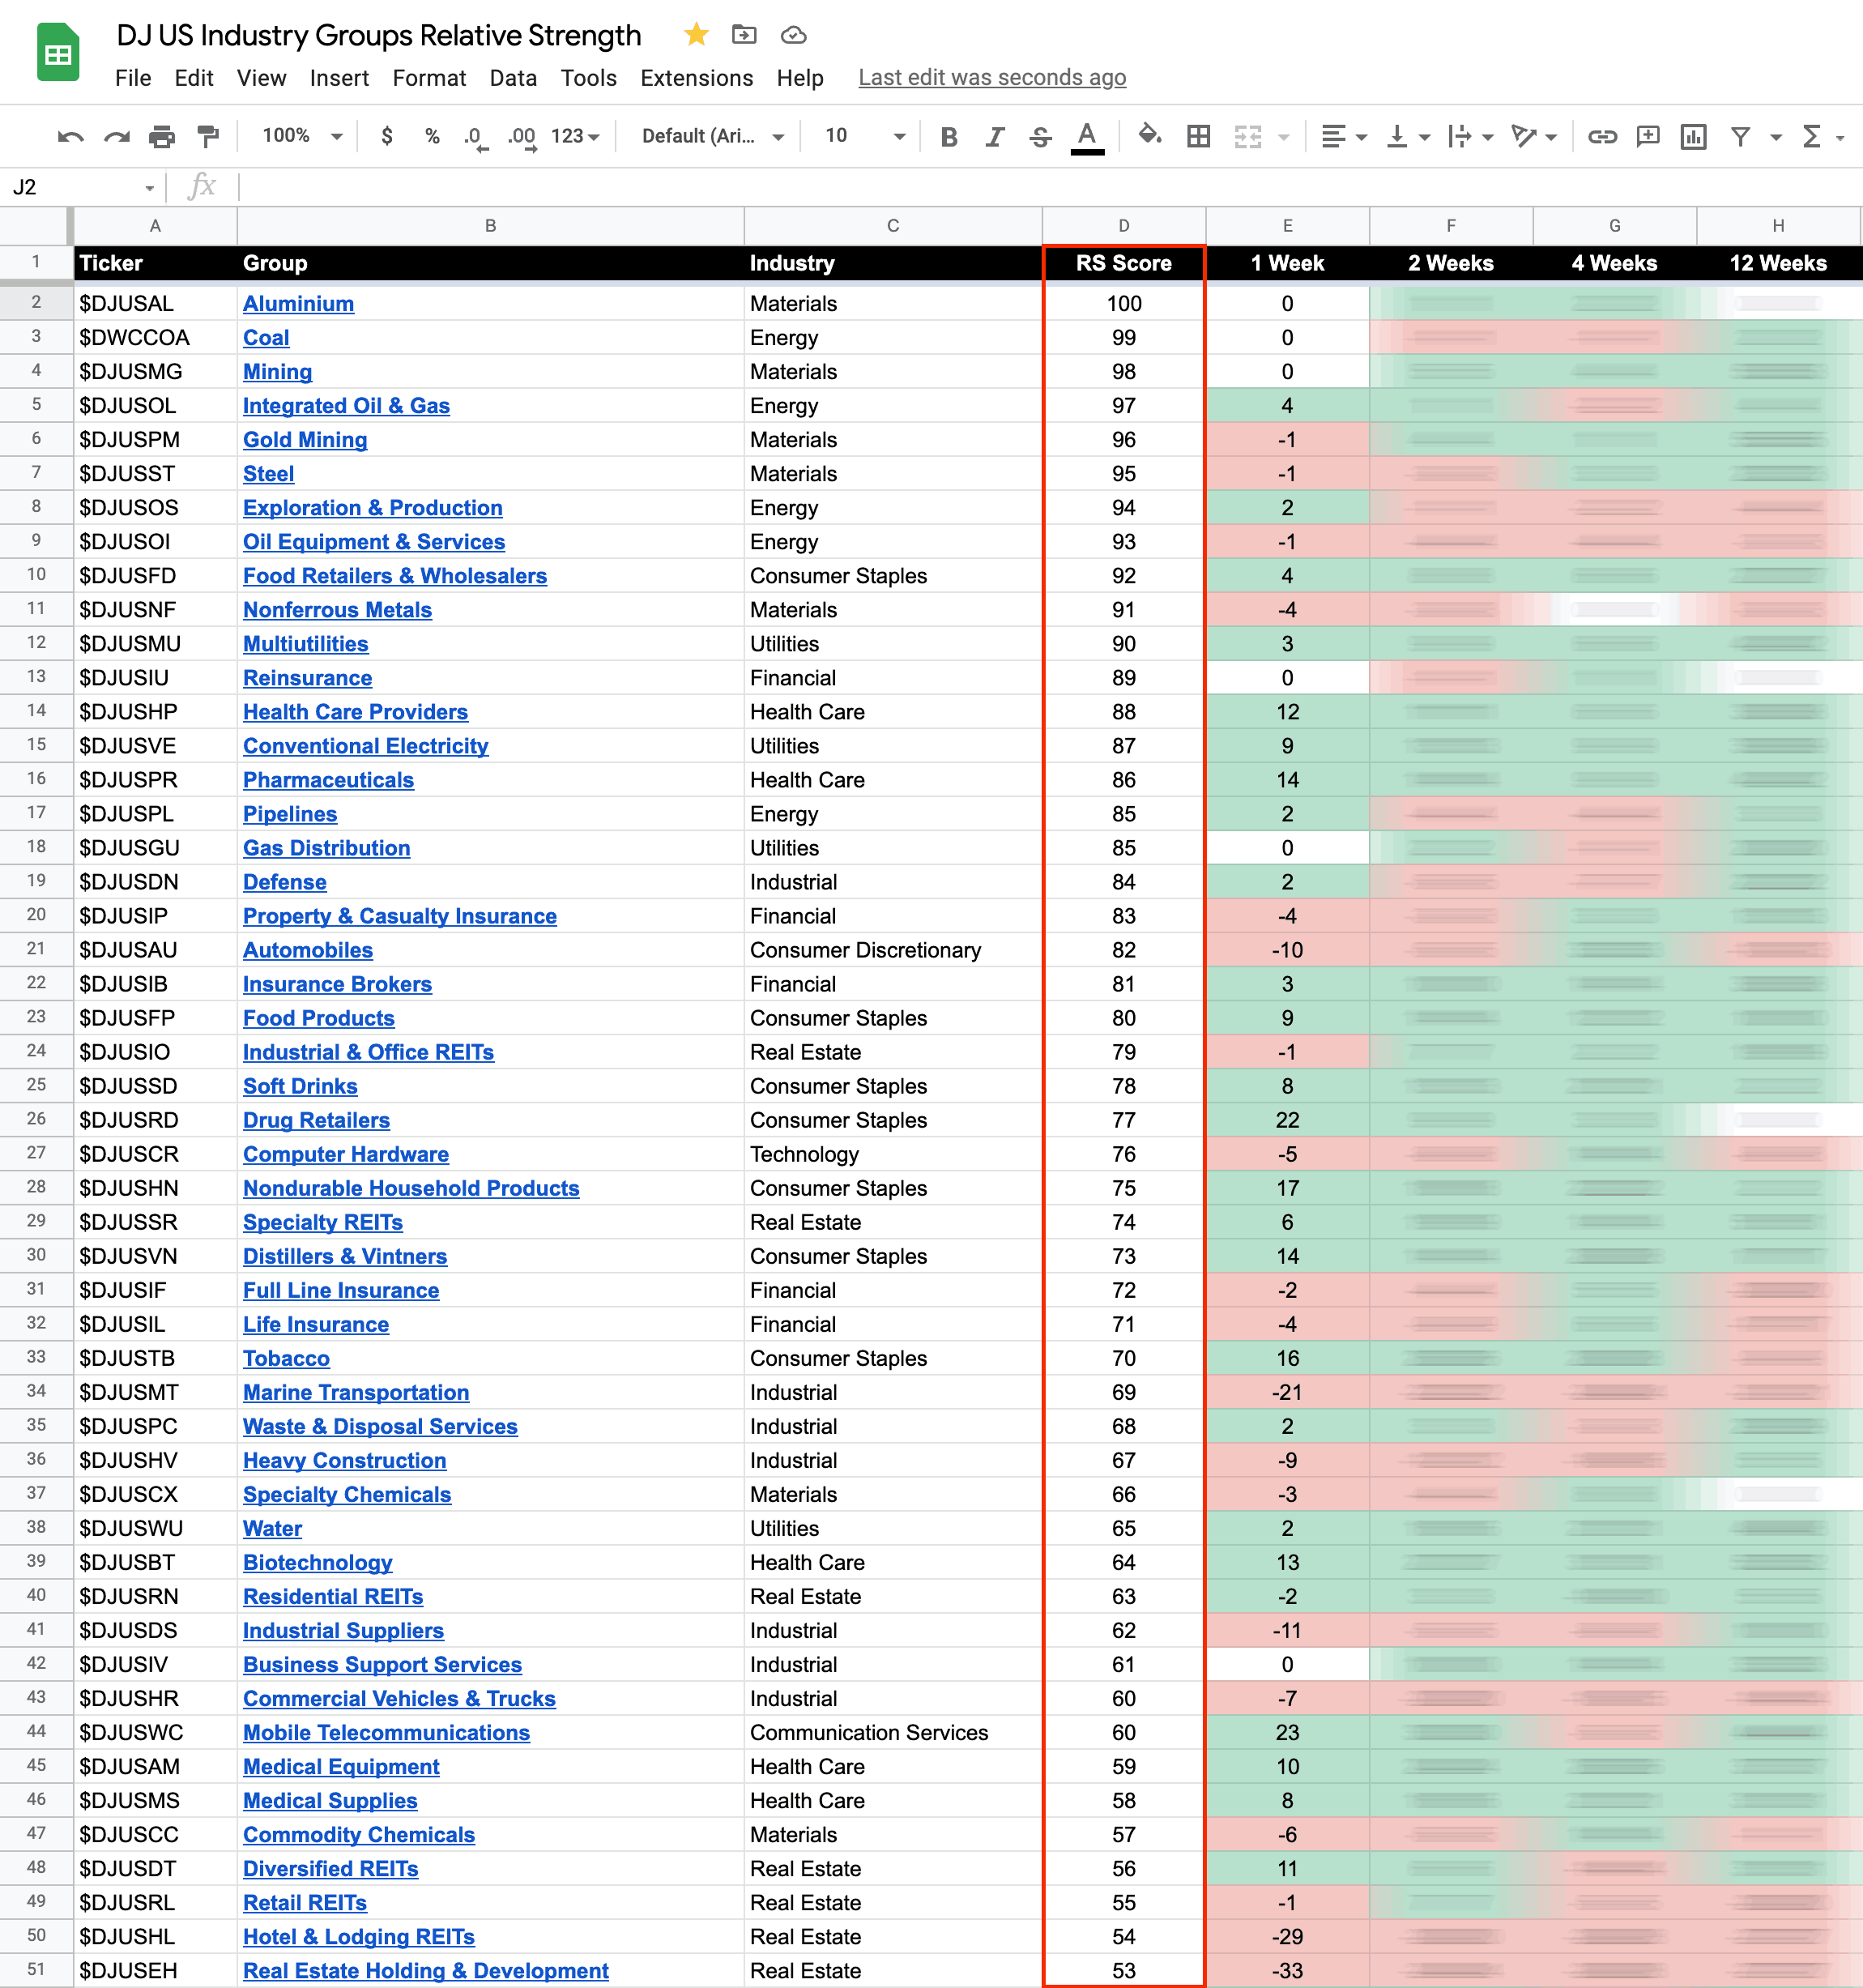
US Stocks Industry Groups Relative Strength Rankings
The purpose of the Relative Strength (RS) tables is to track the short, medium and long term RS changes of the individual groups to find the new leadership earlier than the crowd...
Read More
21 April, 2022
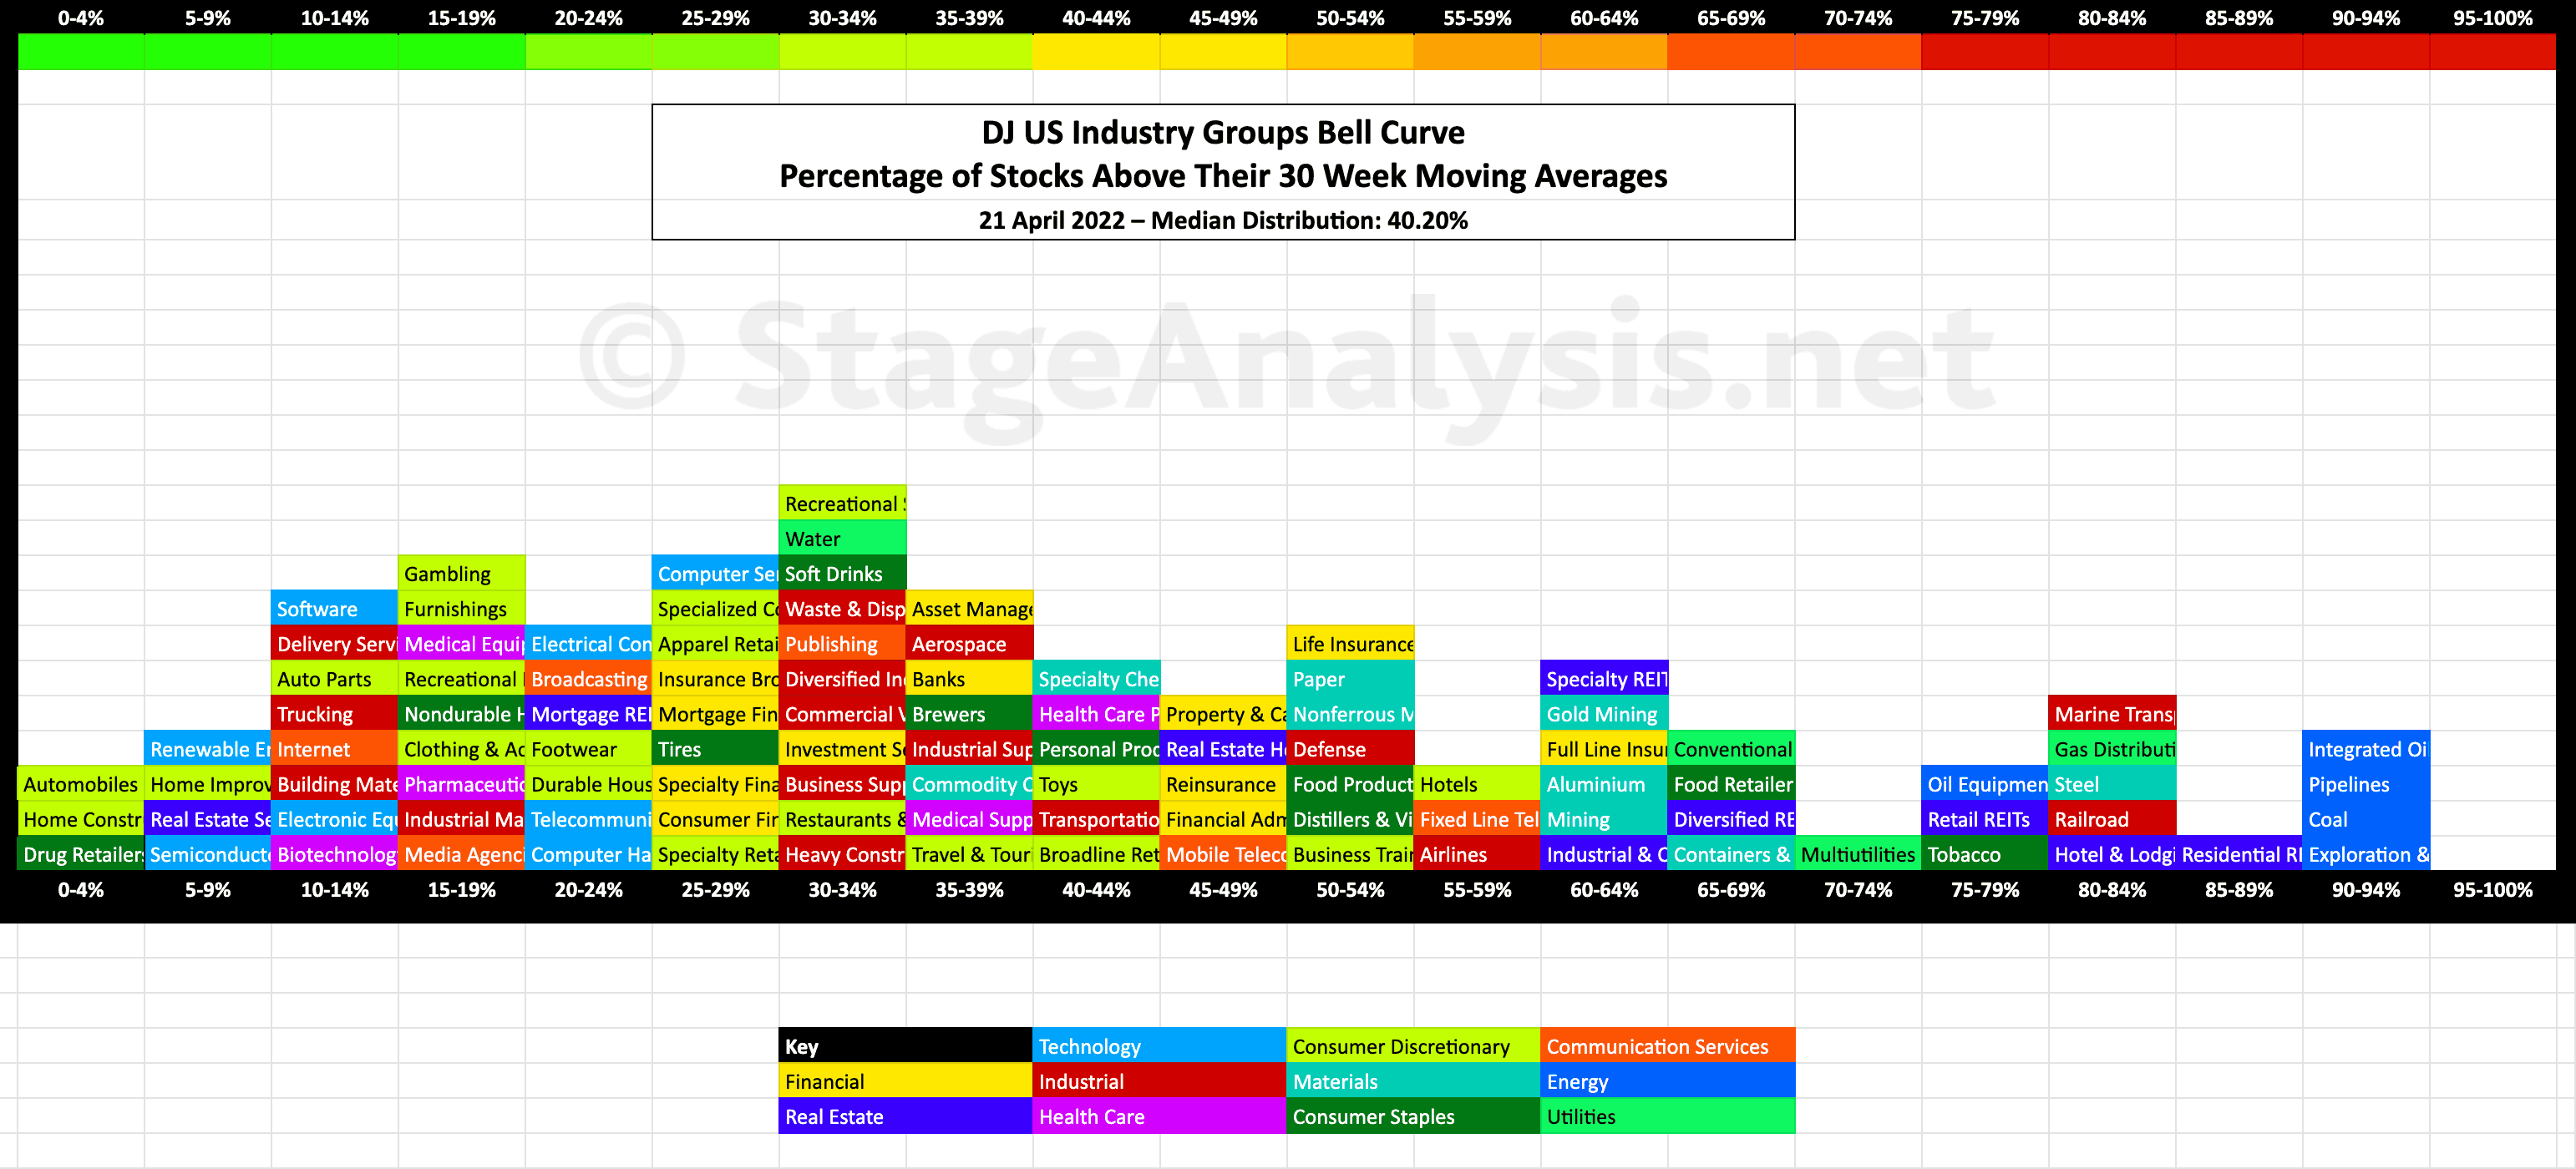
US Industry Groups Bell Curve – Exclusive to Stage Analysis
Exclusive graphic of the 104 Dow Jones Industry Groups showing the Percentage of Stocks Above 30 week MA in each group visualised as a Bell Curve chart – inspired by the Sector Bell Curve work by Tom Dorsey in his Point & Figure book....
Read More
17 April, 2022
Stage Analysis Members Weekend Video – 17 April 2022 (1hr 14mins)
This weekends Stage Analysis Members Video features analysis of the Major US Stock Market Indexes – S&P 500, Nasdaq Composite, Russell 2000 etc, plus a detailed run through of the key Market Breadth charts (with exclusive charts only on Stage Analysis) in order to determine the Weight of Evidence...
Read More
15 April, 2022
US Stocks Industry Groups Relative Strength Rankings
The purpose of the Relative Strength (RS) tables is to track the short, medium and long term RS changes of the individual groups to find the new leadership earlier than the crowd...
Read More
14 April, 2022
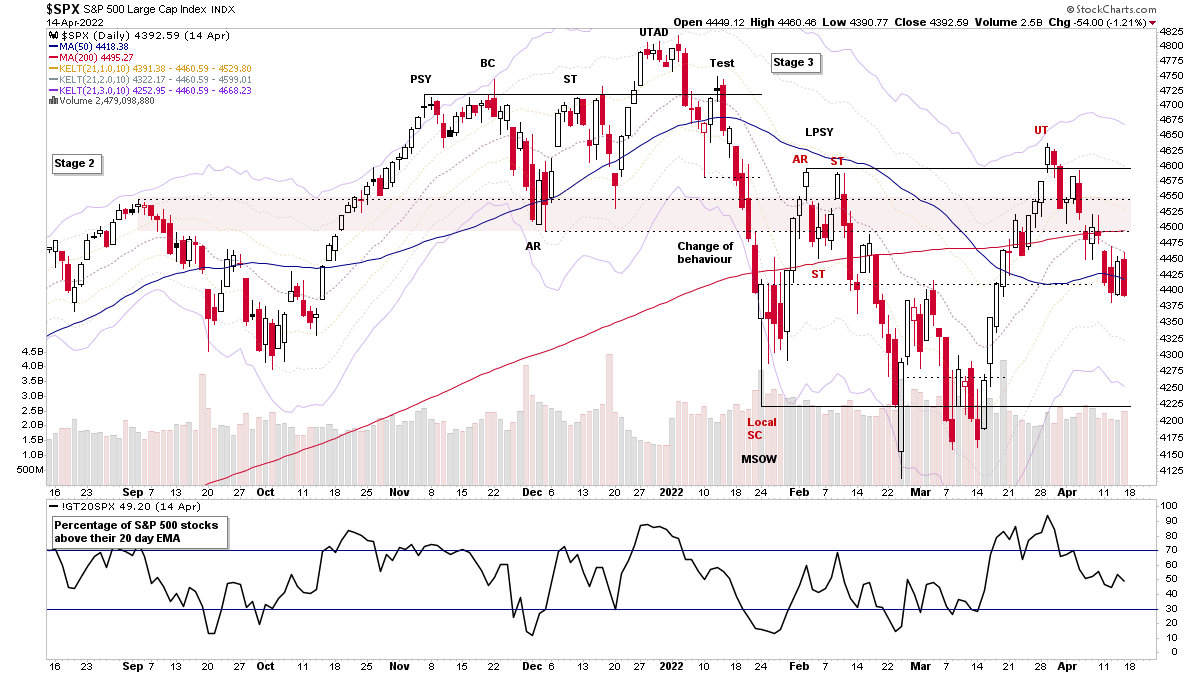
Stage Analysis Members Midweek Video - 14 April 2022 (50 mins)
The Stage Analysis Members Midweek Video covers the major indexes, short term market breadth charts, AAPL and TSLA attempts to the hold their short term MAs.The group themes from the last week, and the US watchlist stocks in more detail...
Read More
10 April, 2022
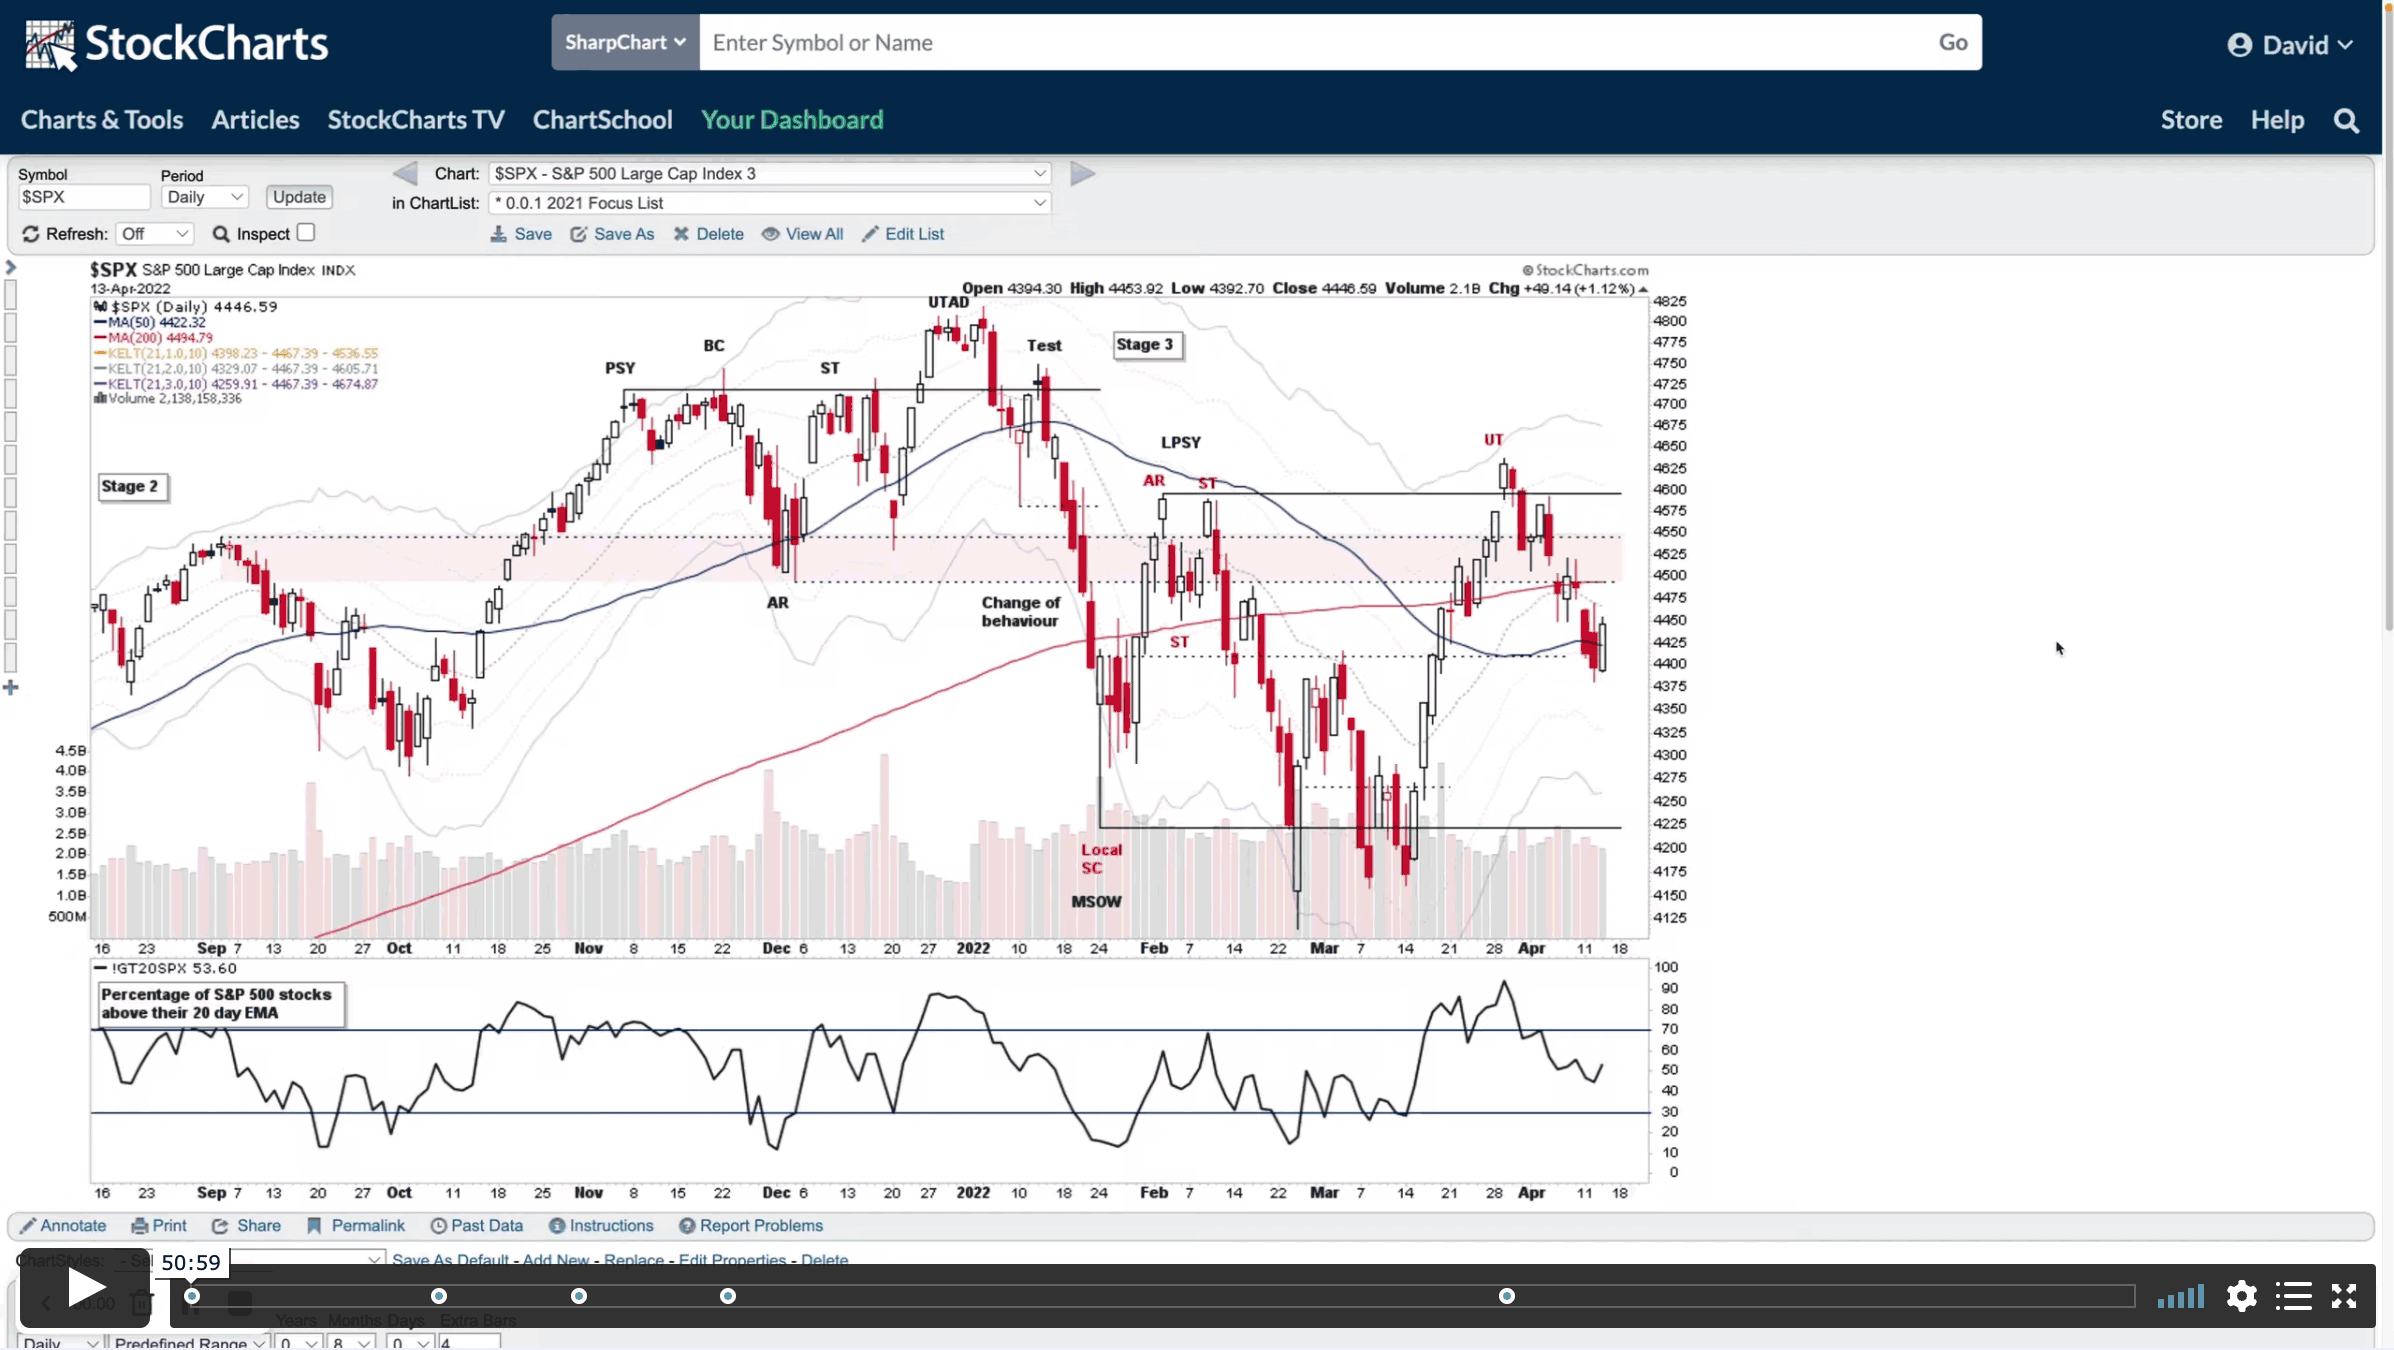
Stage Analysis Members Weekend Video – 10 April 2022 (1hr 42mins)
This weekends Stage Analysis Members Video features the Major Indexes – Nasdaq, S&P 500, Russell 2000, Sector Relative Strength, Market Breadth charts to determine the Weight of Evidence, Industry Group Relative Strength. A Group Focus on the Uranium Stocks and the US Stocks Watchlist in detail with marked up charts and explanations of the group themes and what I'm looking for in various stocks.
Read More
09 April, 2022
US Stocks Industry Groups Relative Strength Rankings
The purpose of the Relative Strength (RS) tables is to track the short, medium and long term RS changes of the individual groups to find the new leadership earlier than the crowd...
Read More
07 April, 2022
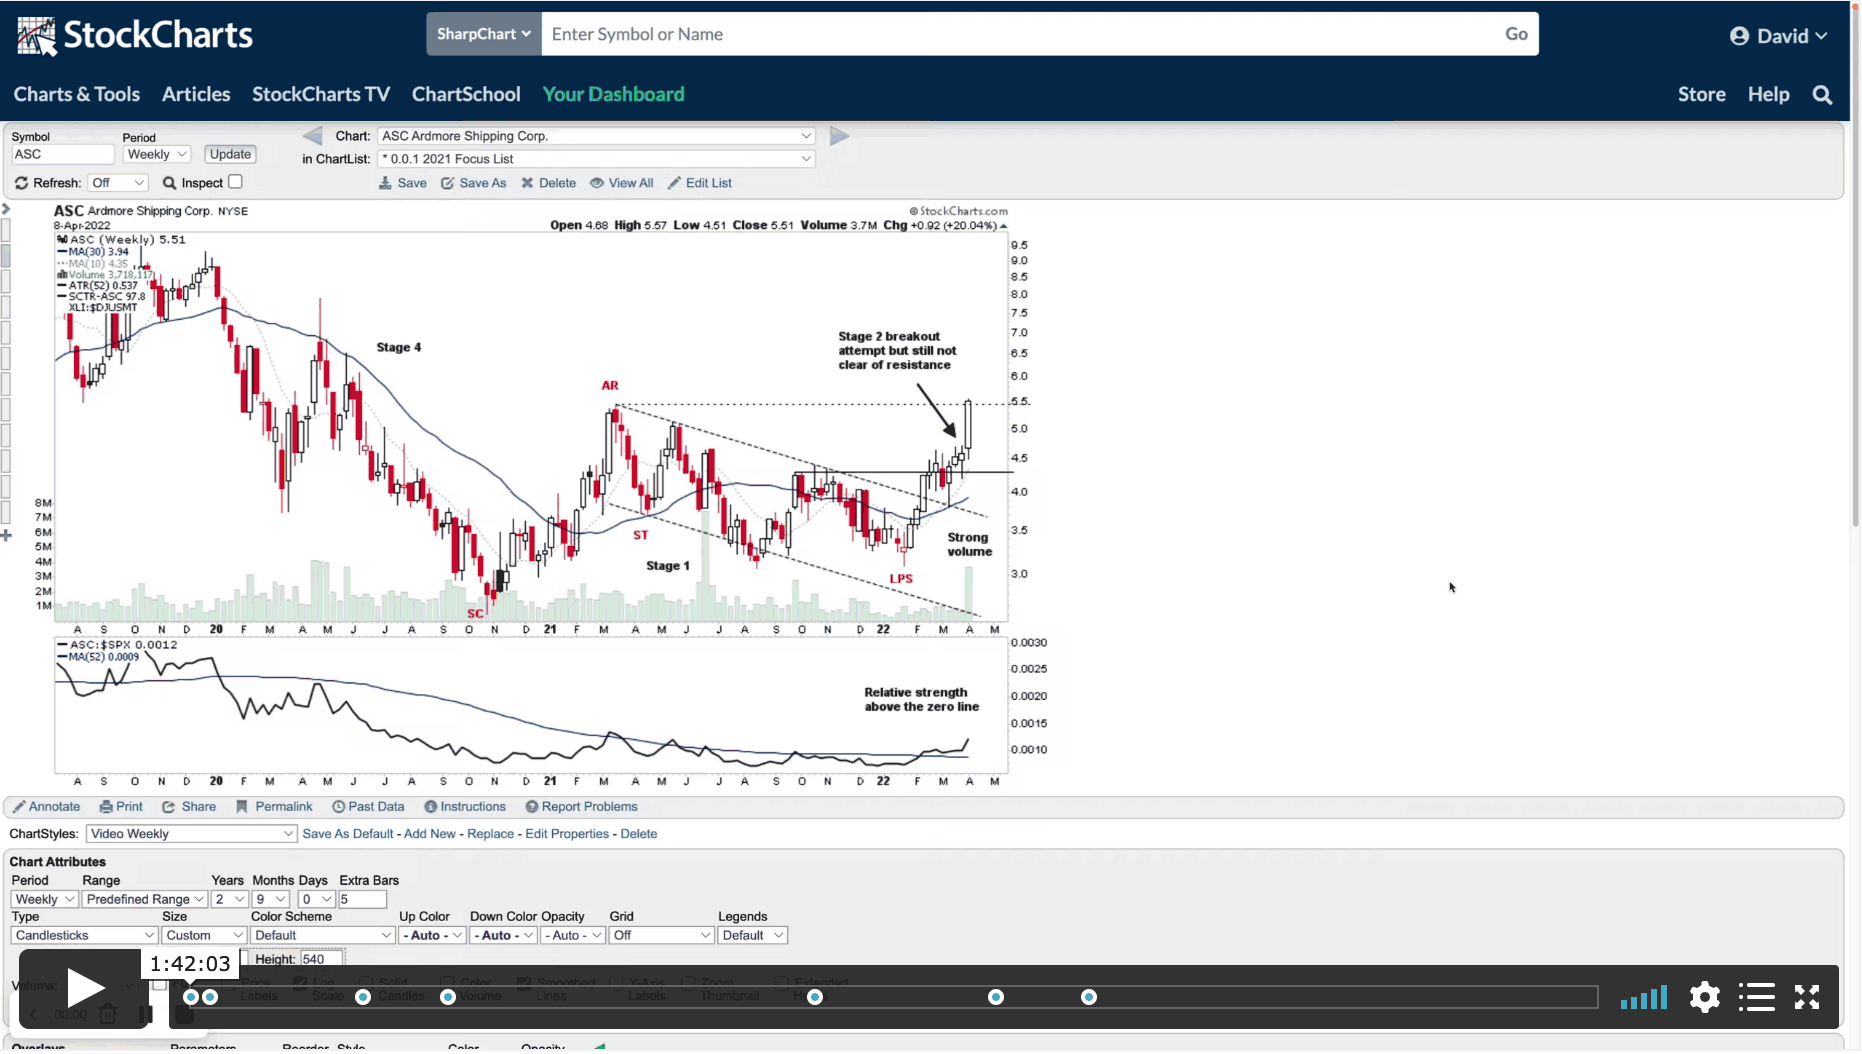
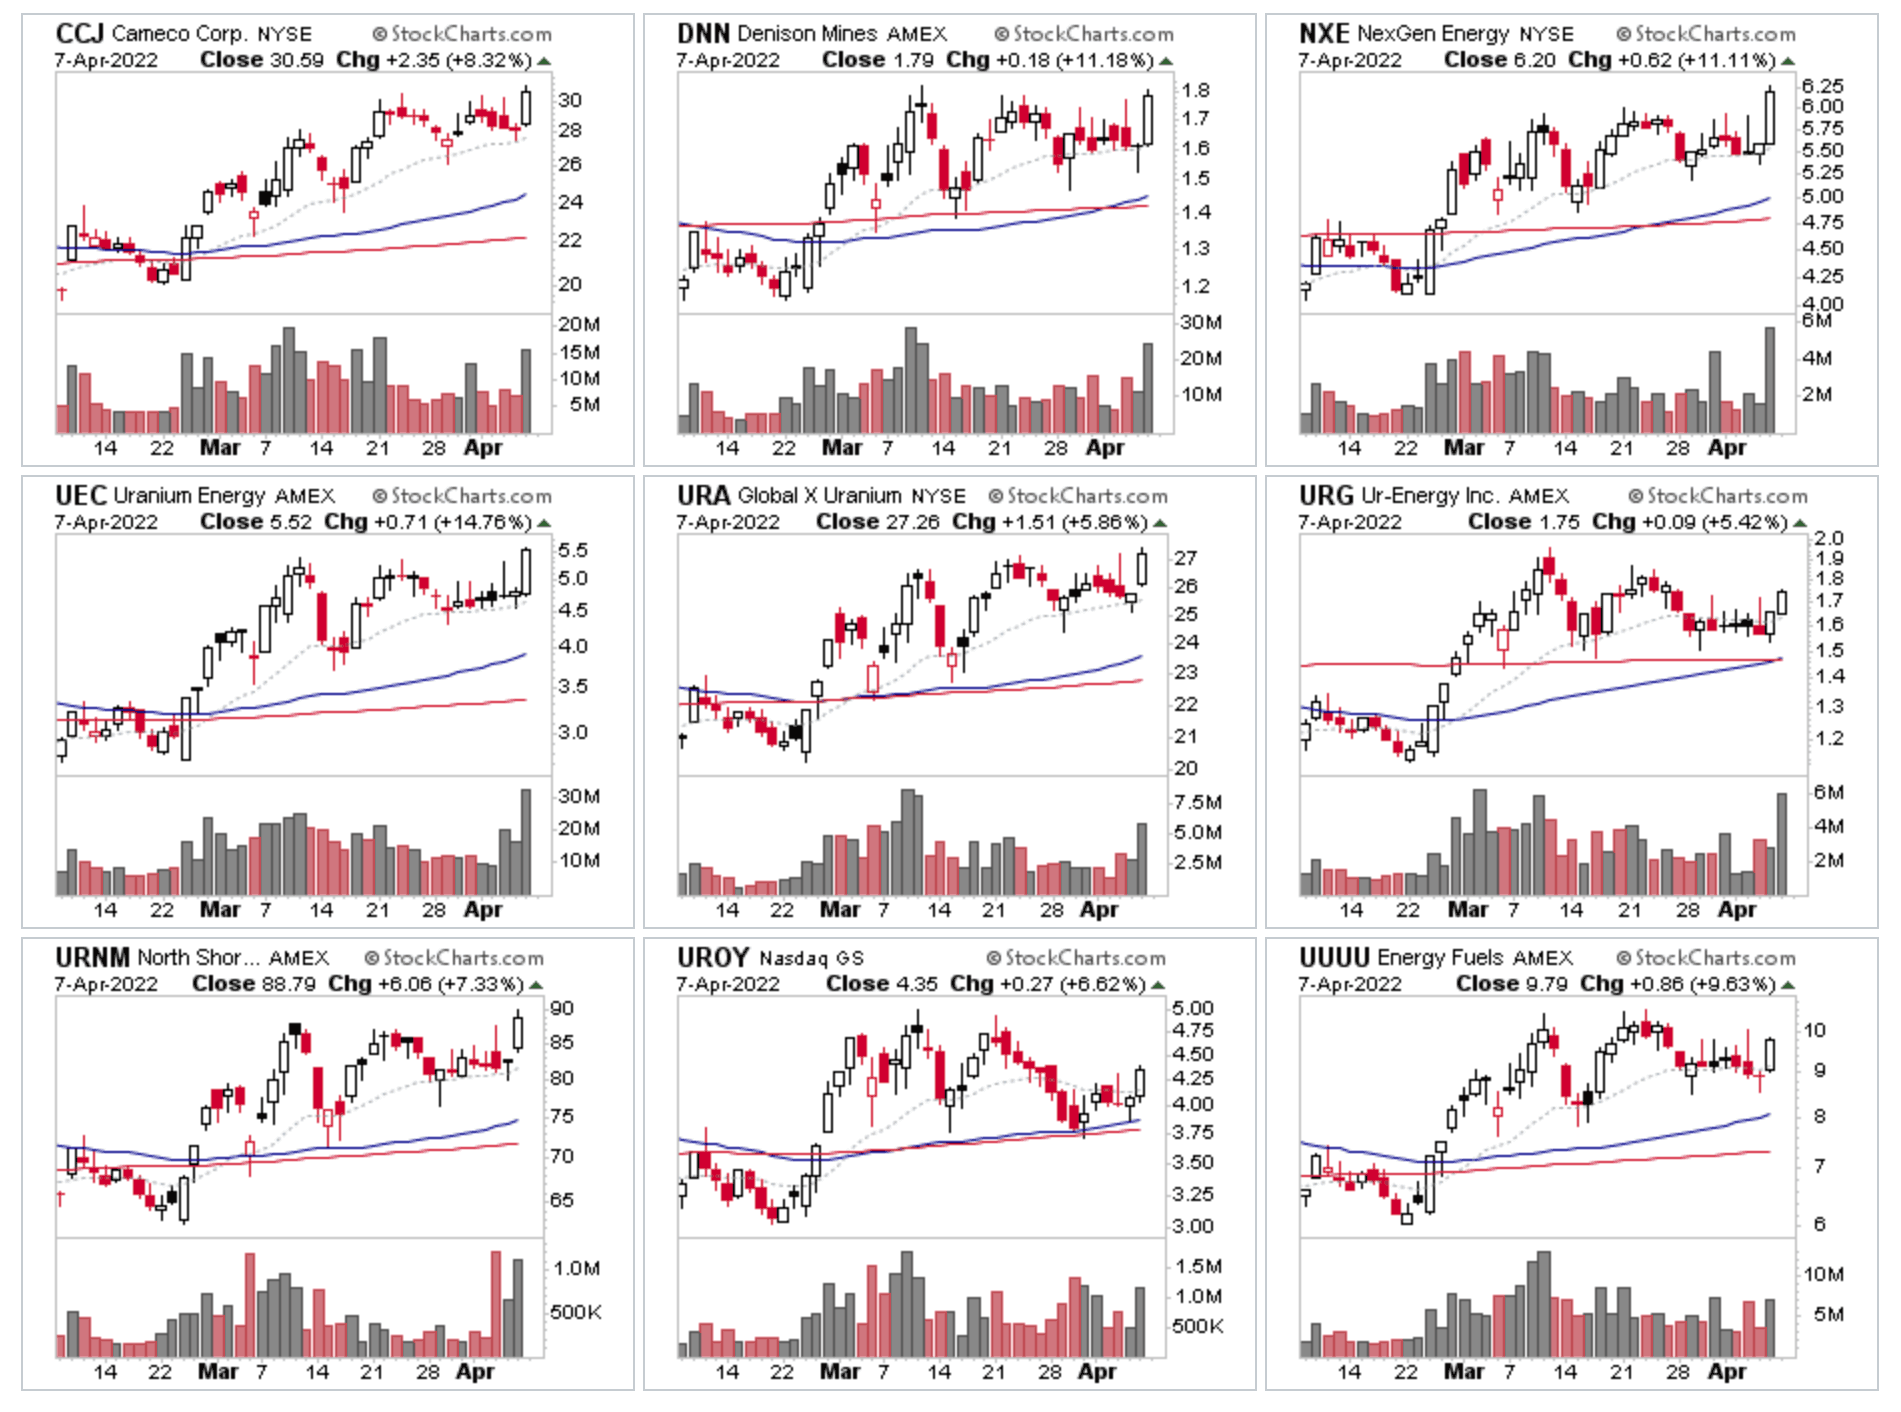
Uranium Stocks & ETFs Attempting to Breakout and the US Stocks Watchlist – 7 April 2022
Strong relative volume came into the Uranium stocks & ETFs today, with multiple stocks from the group testing the highs of their recent ranges, with closes near the highs of the day and the majority moving greater than 5% including the group ETFs. So there's potential for a new Stage 2 breakout "attempt". But as always – and especially in the current market environment – be on alert for signs of failure on any breakout attempt, as failed breakouts can quickly turn into an Upthrust...
Read More