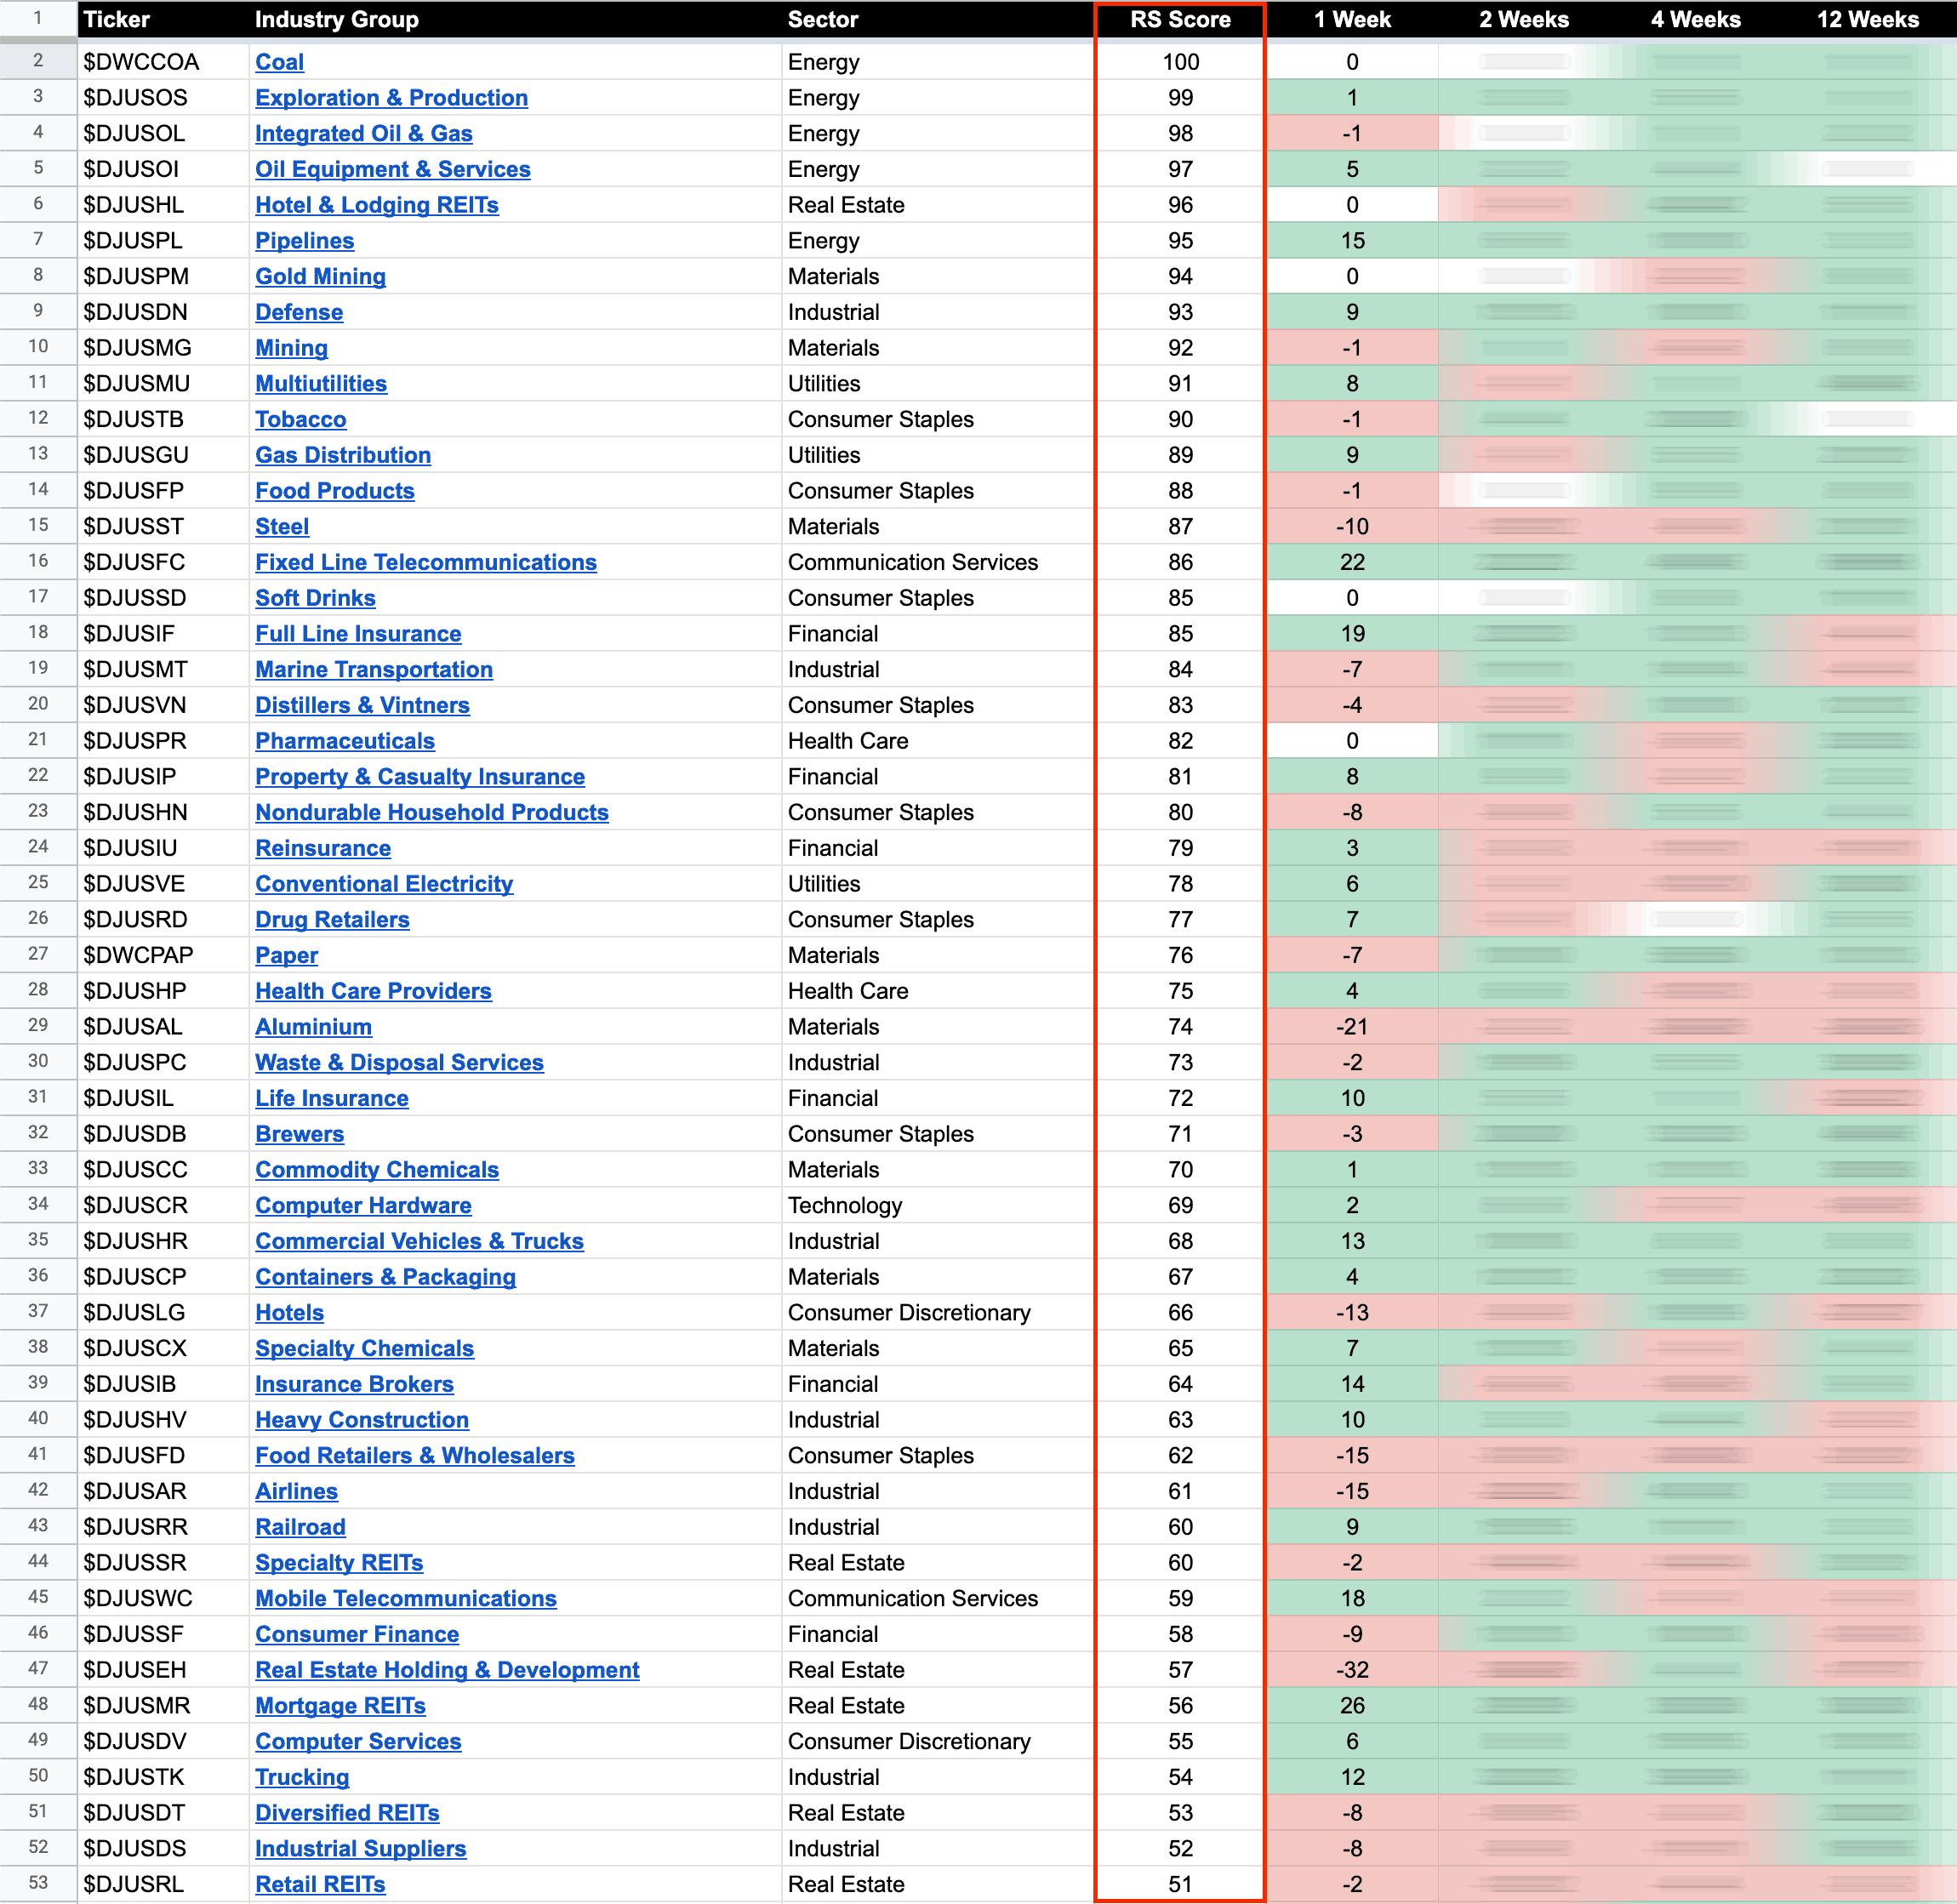
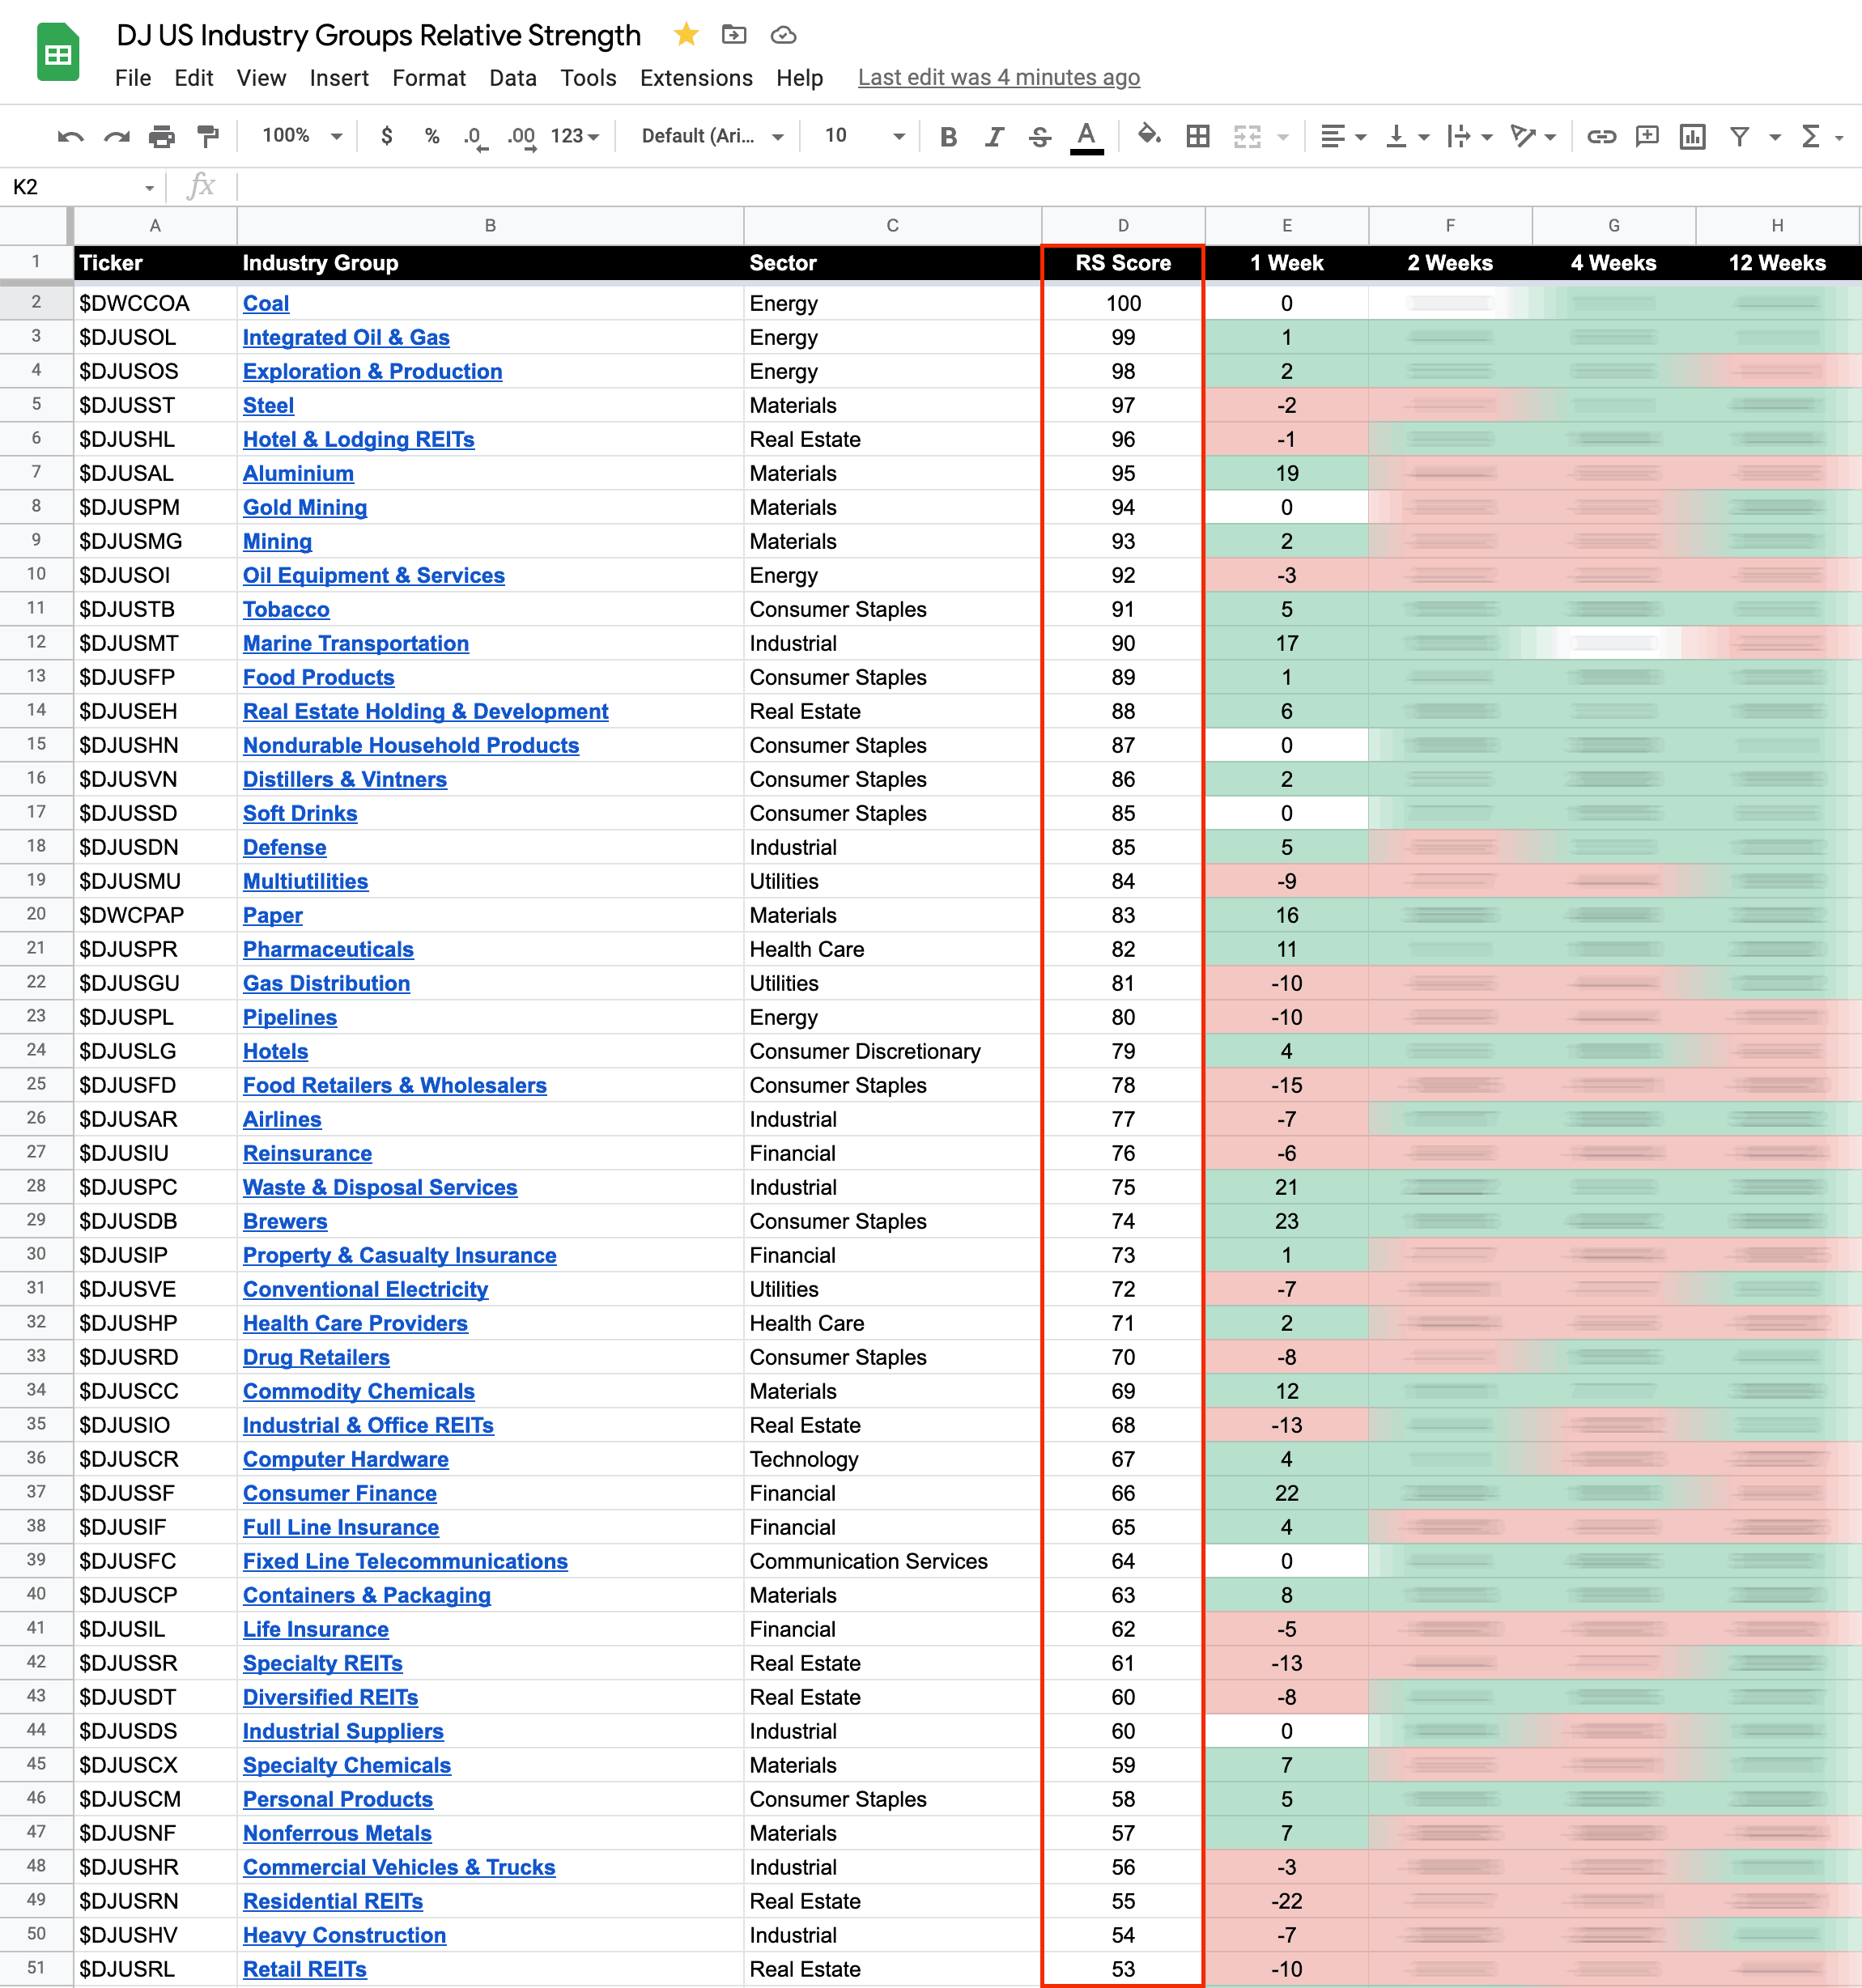
The purpose of the Relative Strength (RS) tables is to track the short, medium and long term RS changes of the individual groups to find the new leadership earlier than the crowd...
Read More

Blog
20 May, 2022
US Stocks Industry Groups Relative Strength Rankings
19 May, 2022
Stage Analysis Members Midweek Video – 18 May 2022 (1hr 17mins)
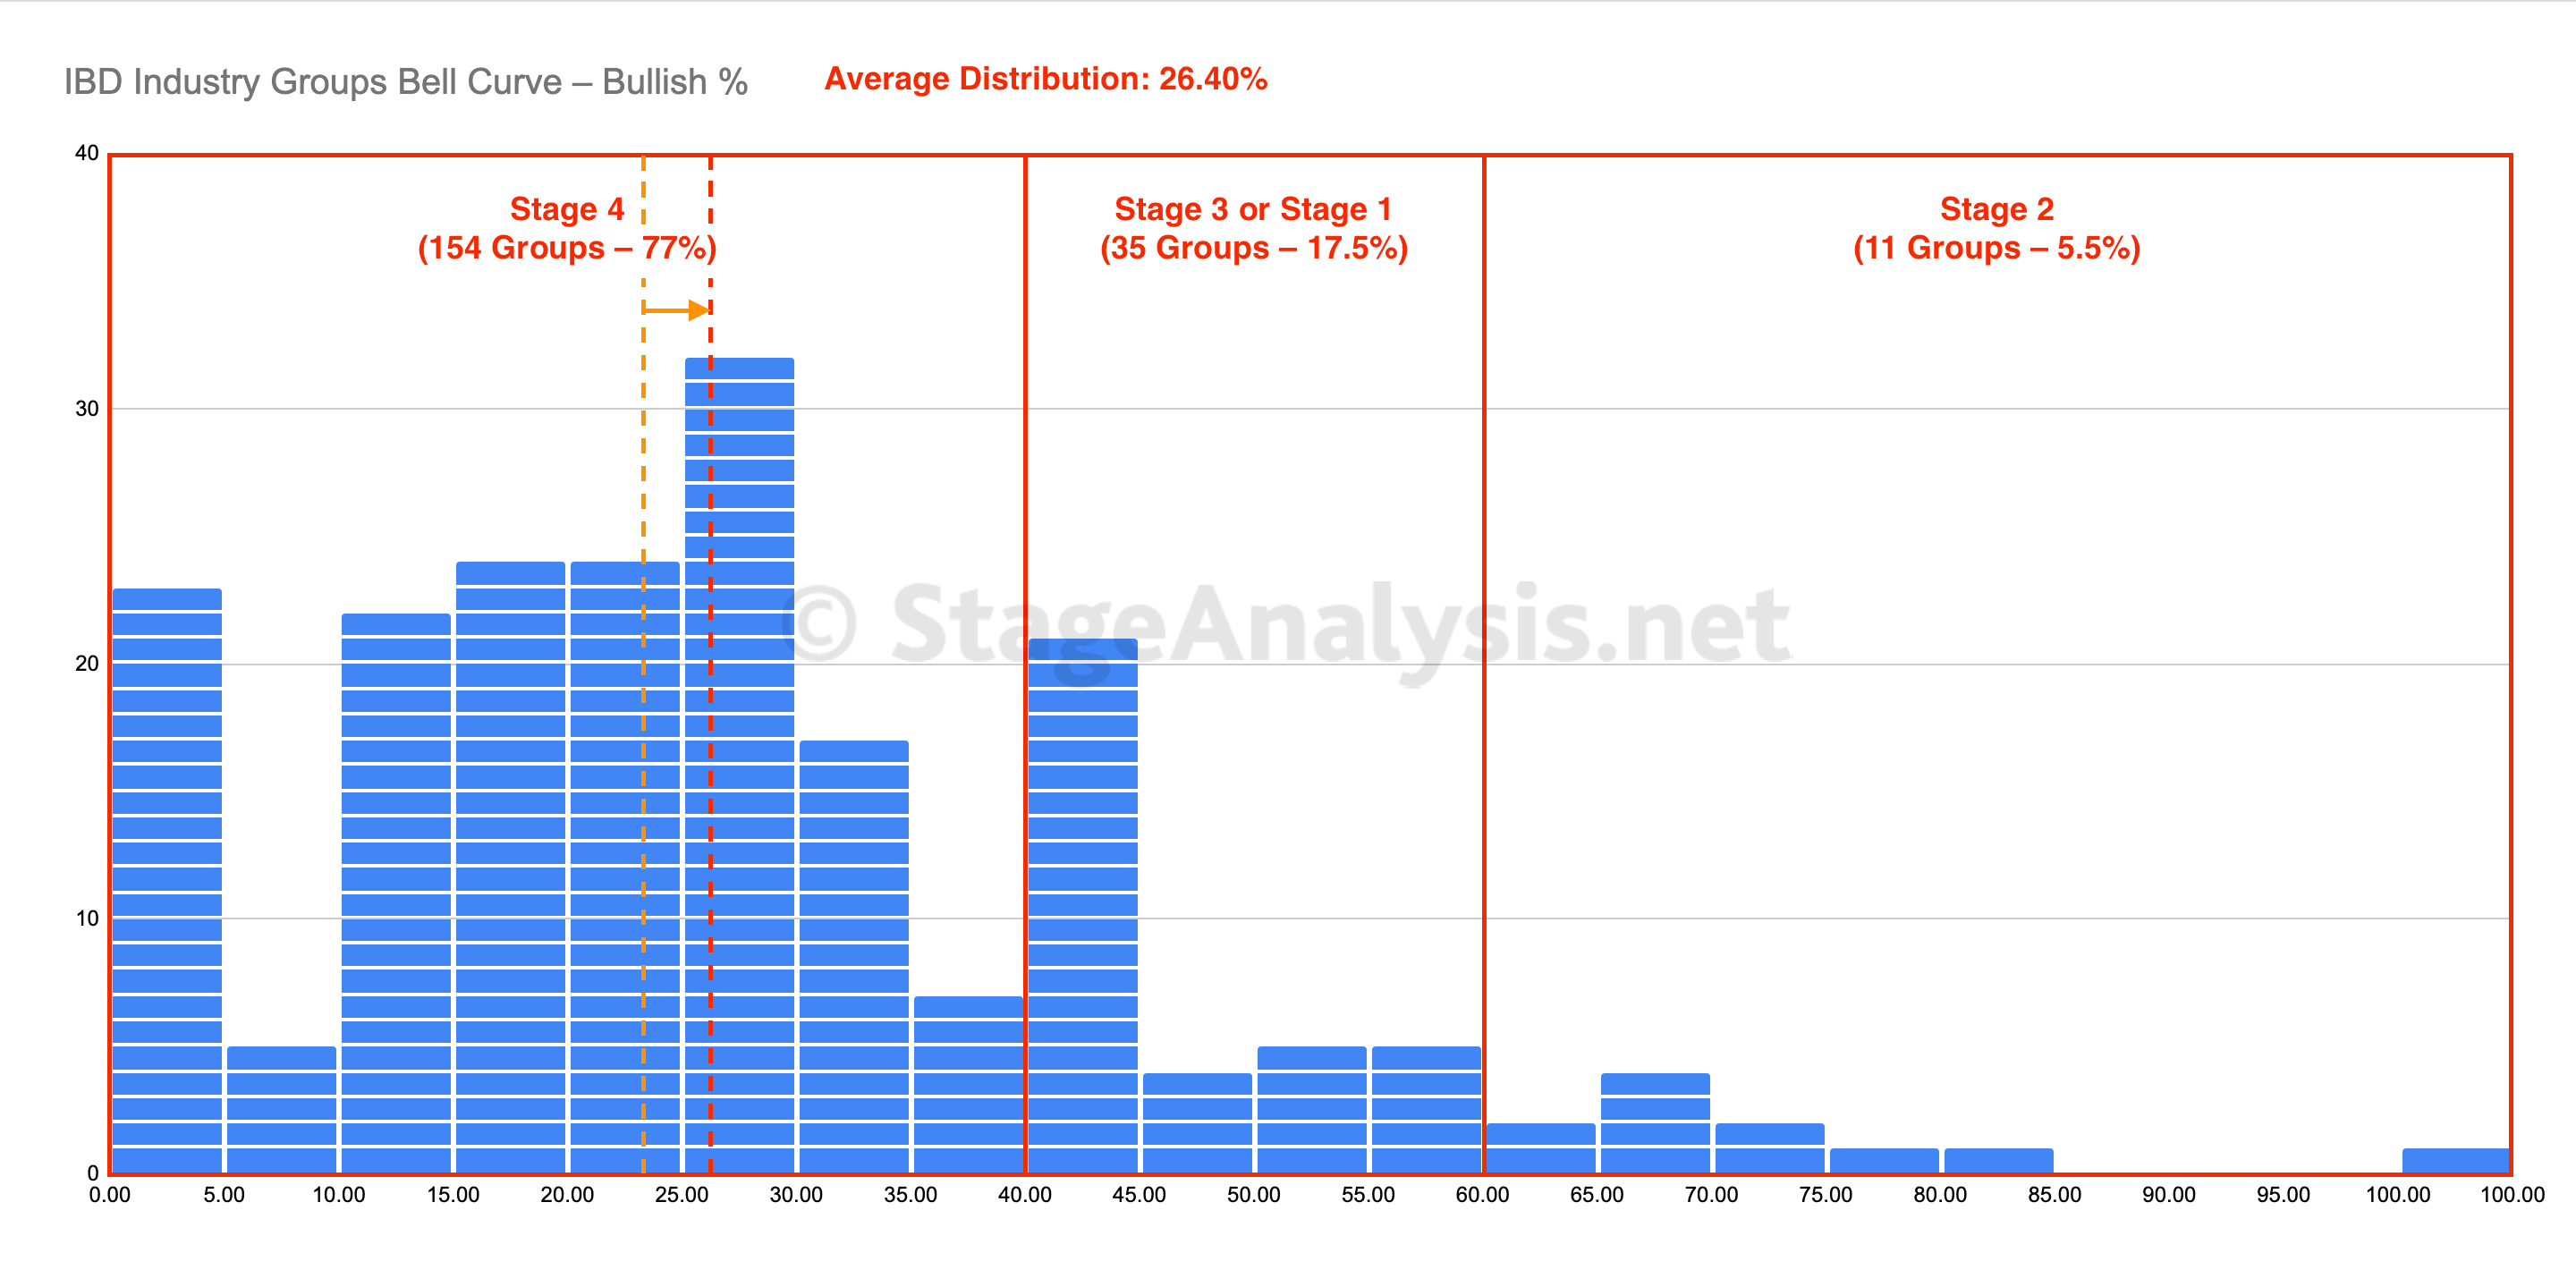
The Stage Analysis Members Midweek Video features Analysis of the Stages of the major US sectors, as well as a look at the sector breadth visual the custom IBD Industry Groups Bell Curve – Bullish % chart that I do for the members that shows the distribution of the 200 IBD Industry Groups as a bell curve chart...
Read More
13 May, 2022
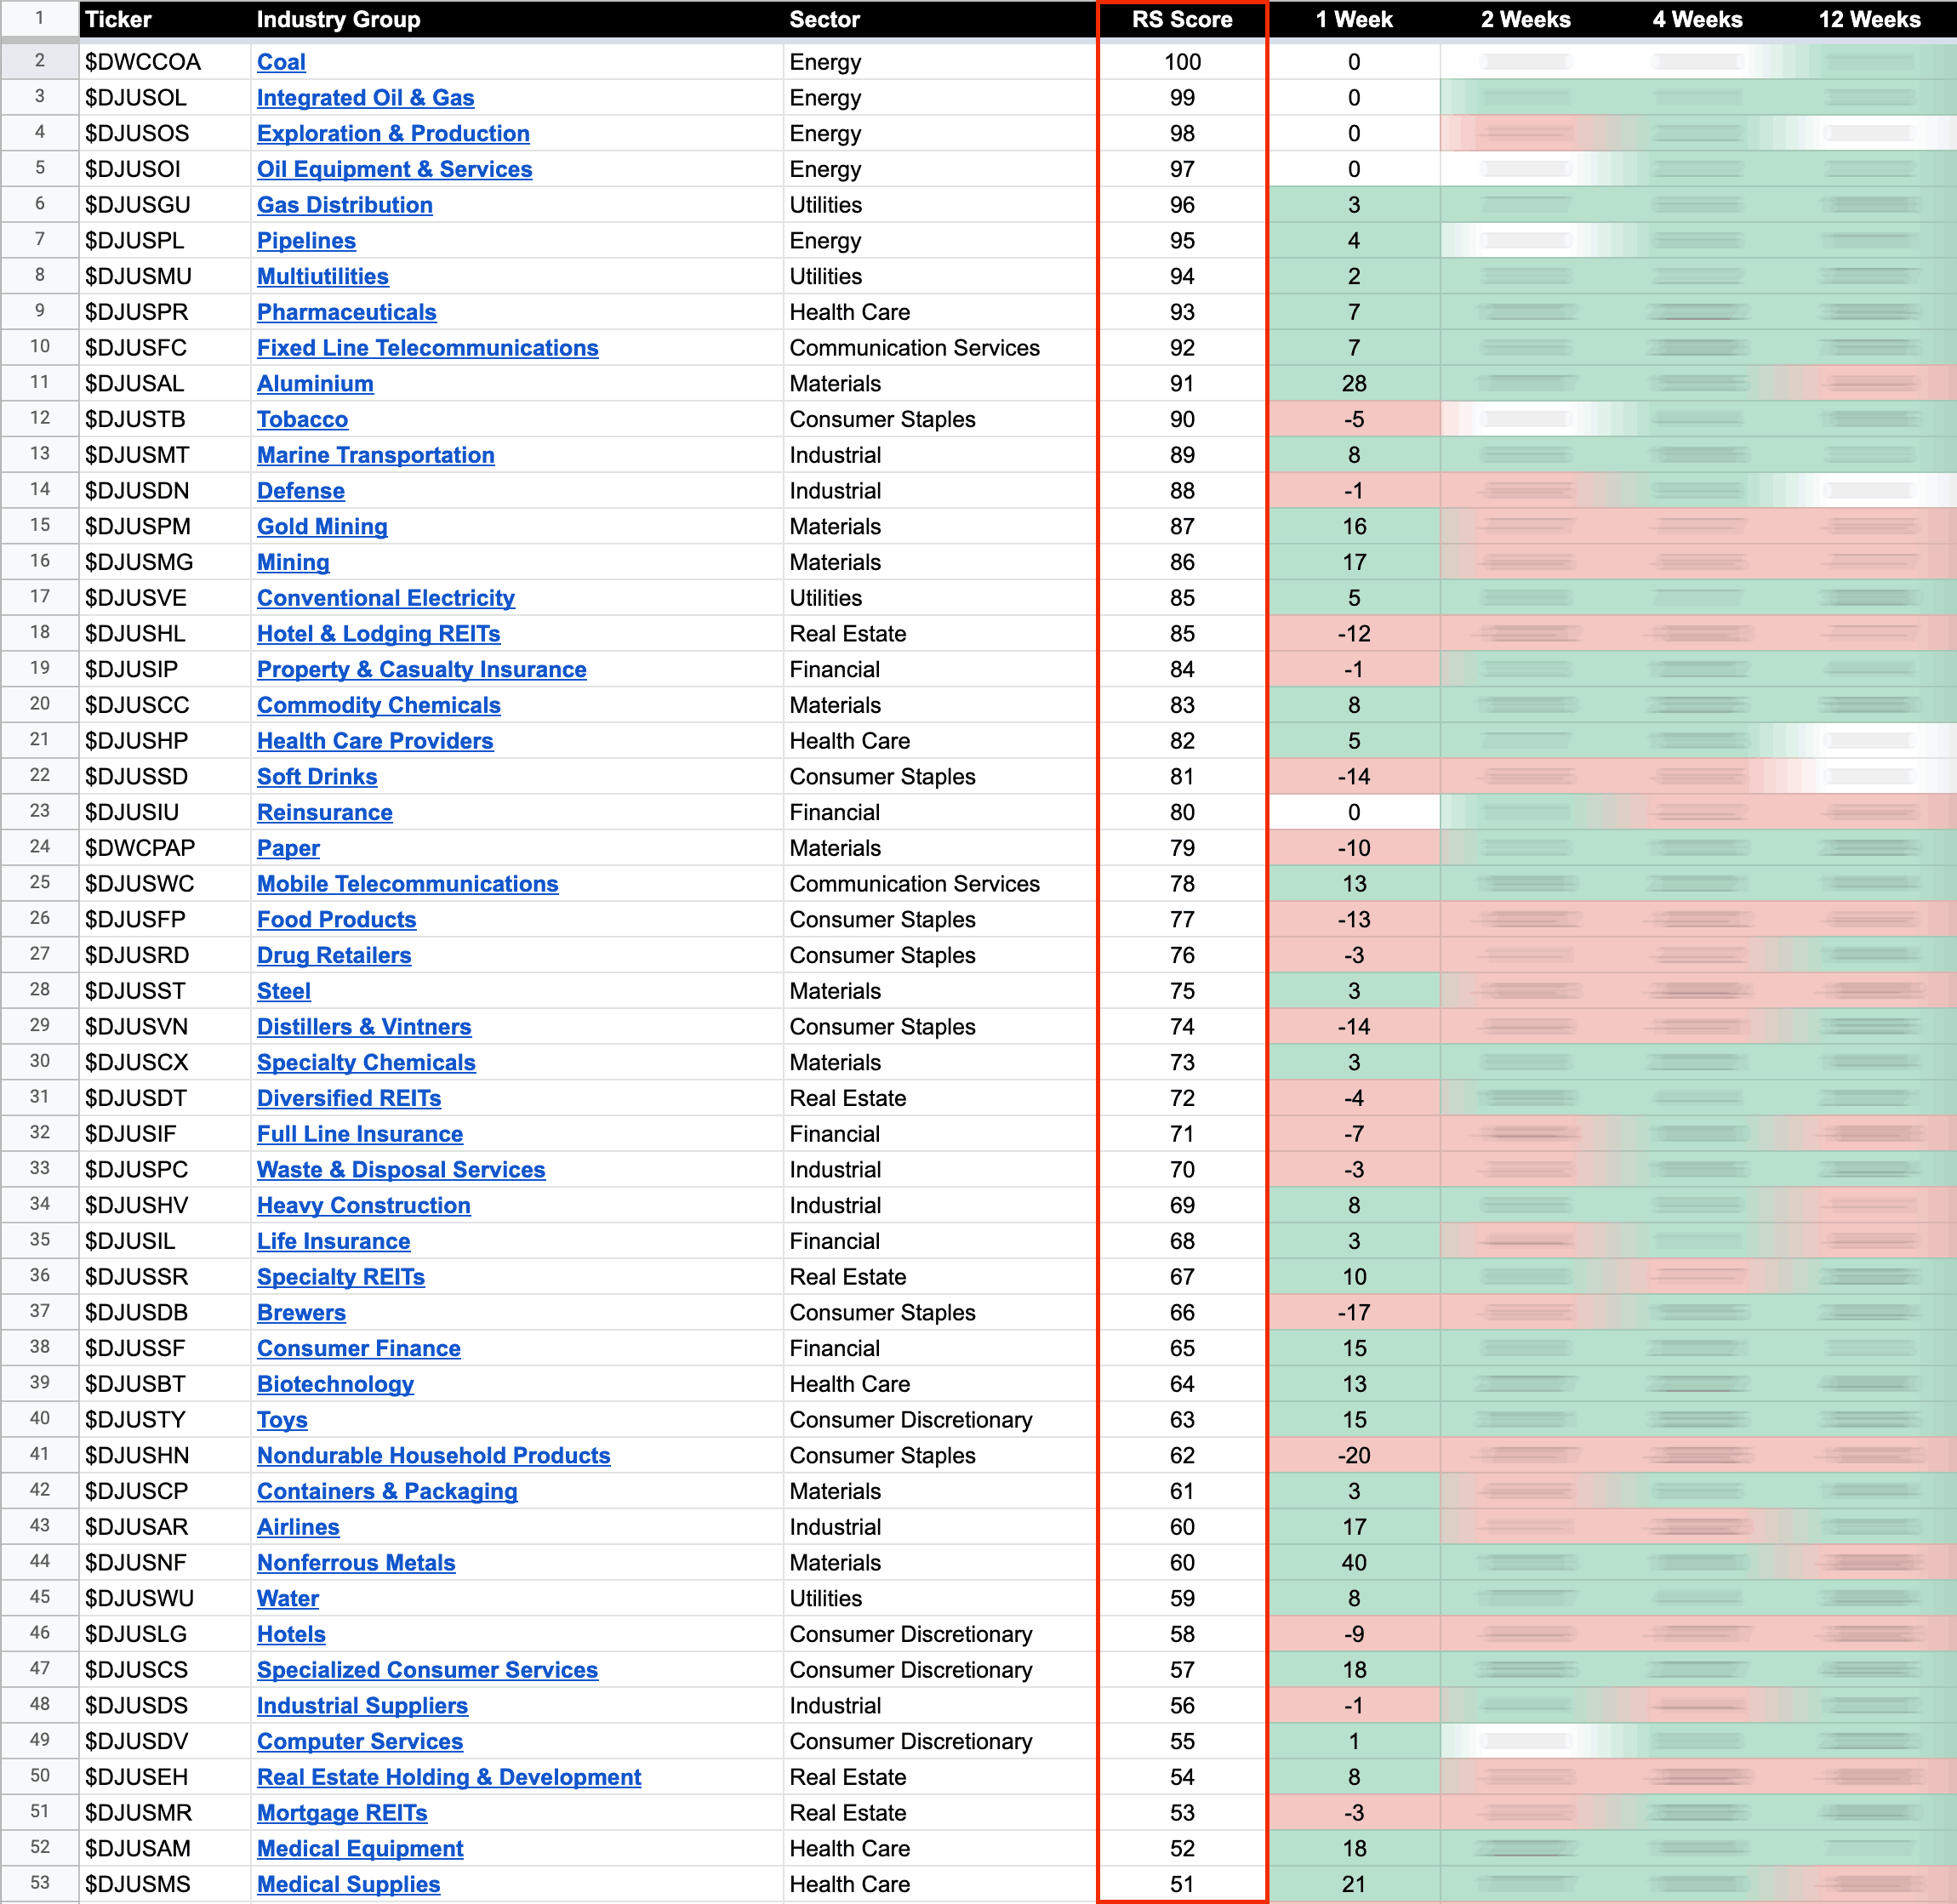
US Stocks Industry Groups Relative Strength Rankings
The purpose of the Relative Strength (RS) tables is to track the short, medium and long term RS changes of the individual groups to find the new leadership earlier than the crowd...
Read More
12 May, 2022
Stage Analysis Members Midweek Video – 11 May 2022 (1hr 14mins)
This weeks Stage Analysis Members Midweek Video features analysis of the major indexes Stage 4 declines and the VIX. Plus a detailed look at the mega caps stocks with AAPL (Apple) attempting to breakdown in Stage 4 today and join the other large cap stocks already in Stage 4...
Read More
08 May, 2022
Stage Analysis Members Weekend Video – 8 May 2022 (1hr 29mins)
This weekends Stage Analysis Members Video features analysis of the multiple Stage 2 breakouts and significant bars. Market analysis of the major indexes, US Industry Groups Relative Strength tables. The market breadth update to help to determine the weight of evidence. US stocks watchlist and finally a look at some of the most interesting stocks with earnings this coming week.
Read More
06 May, 2022
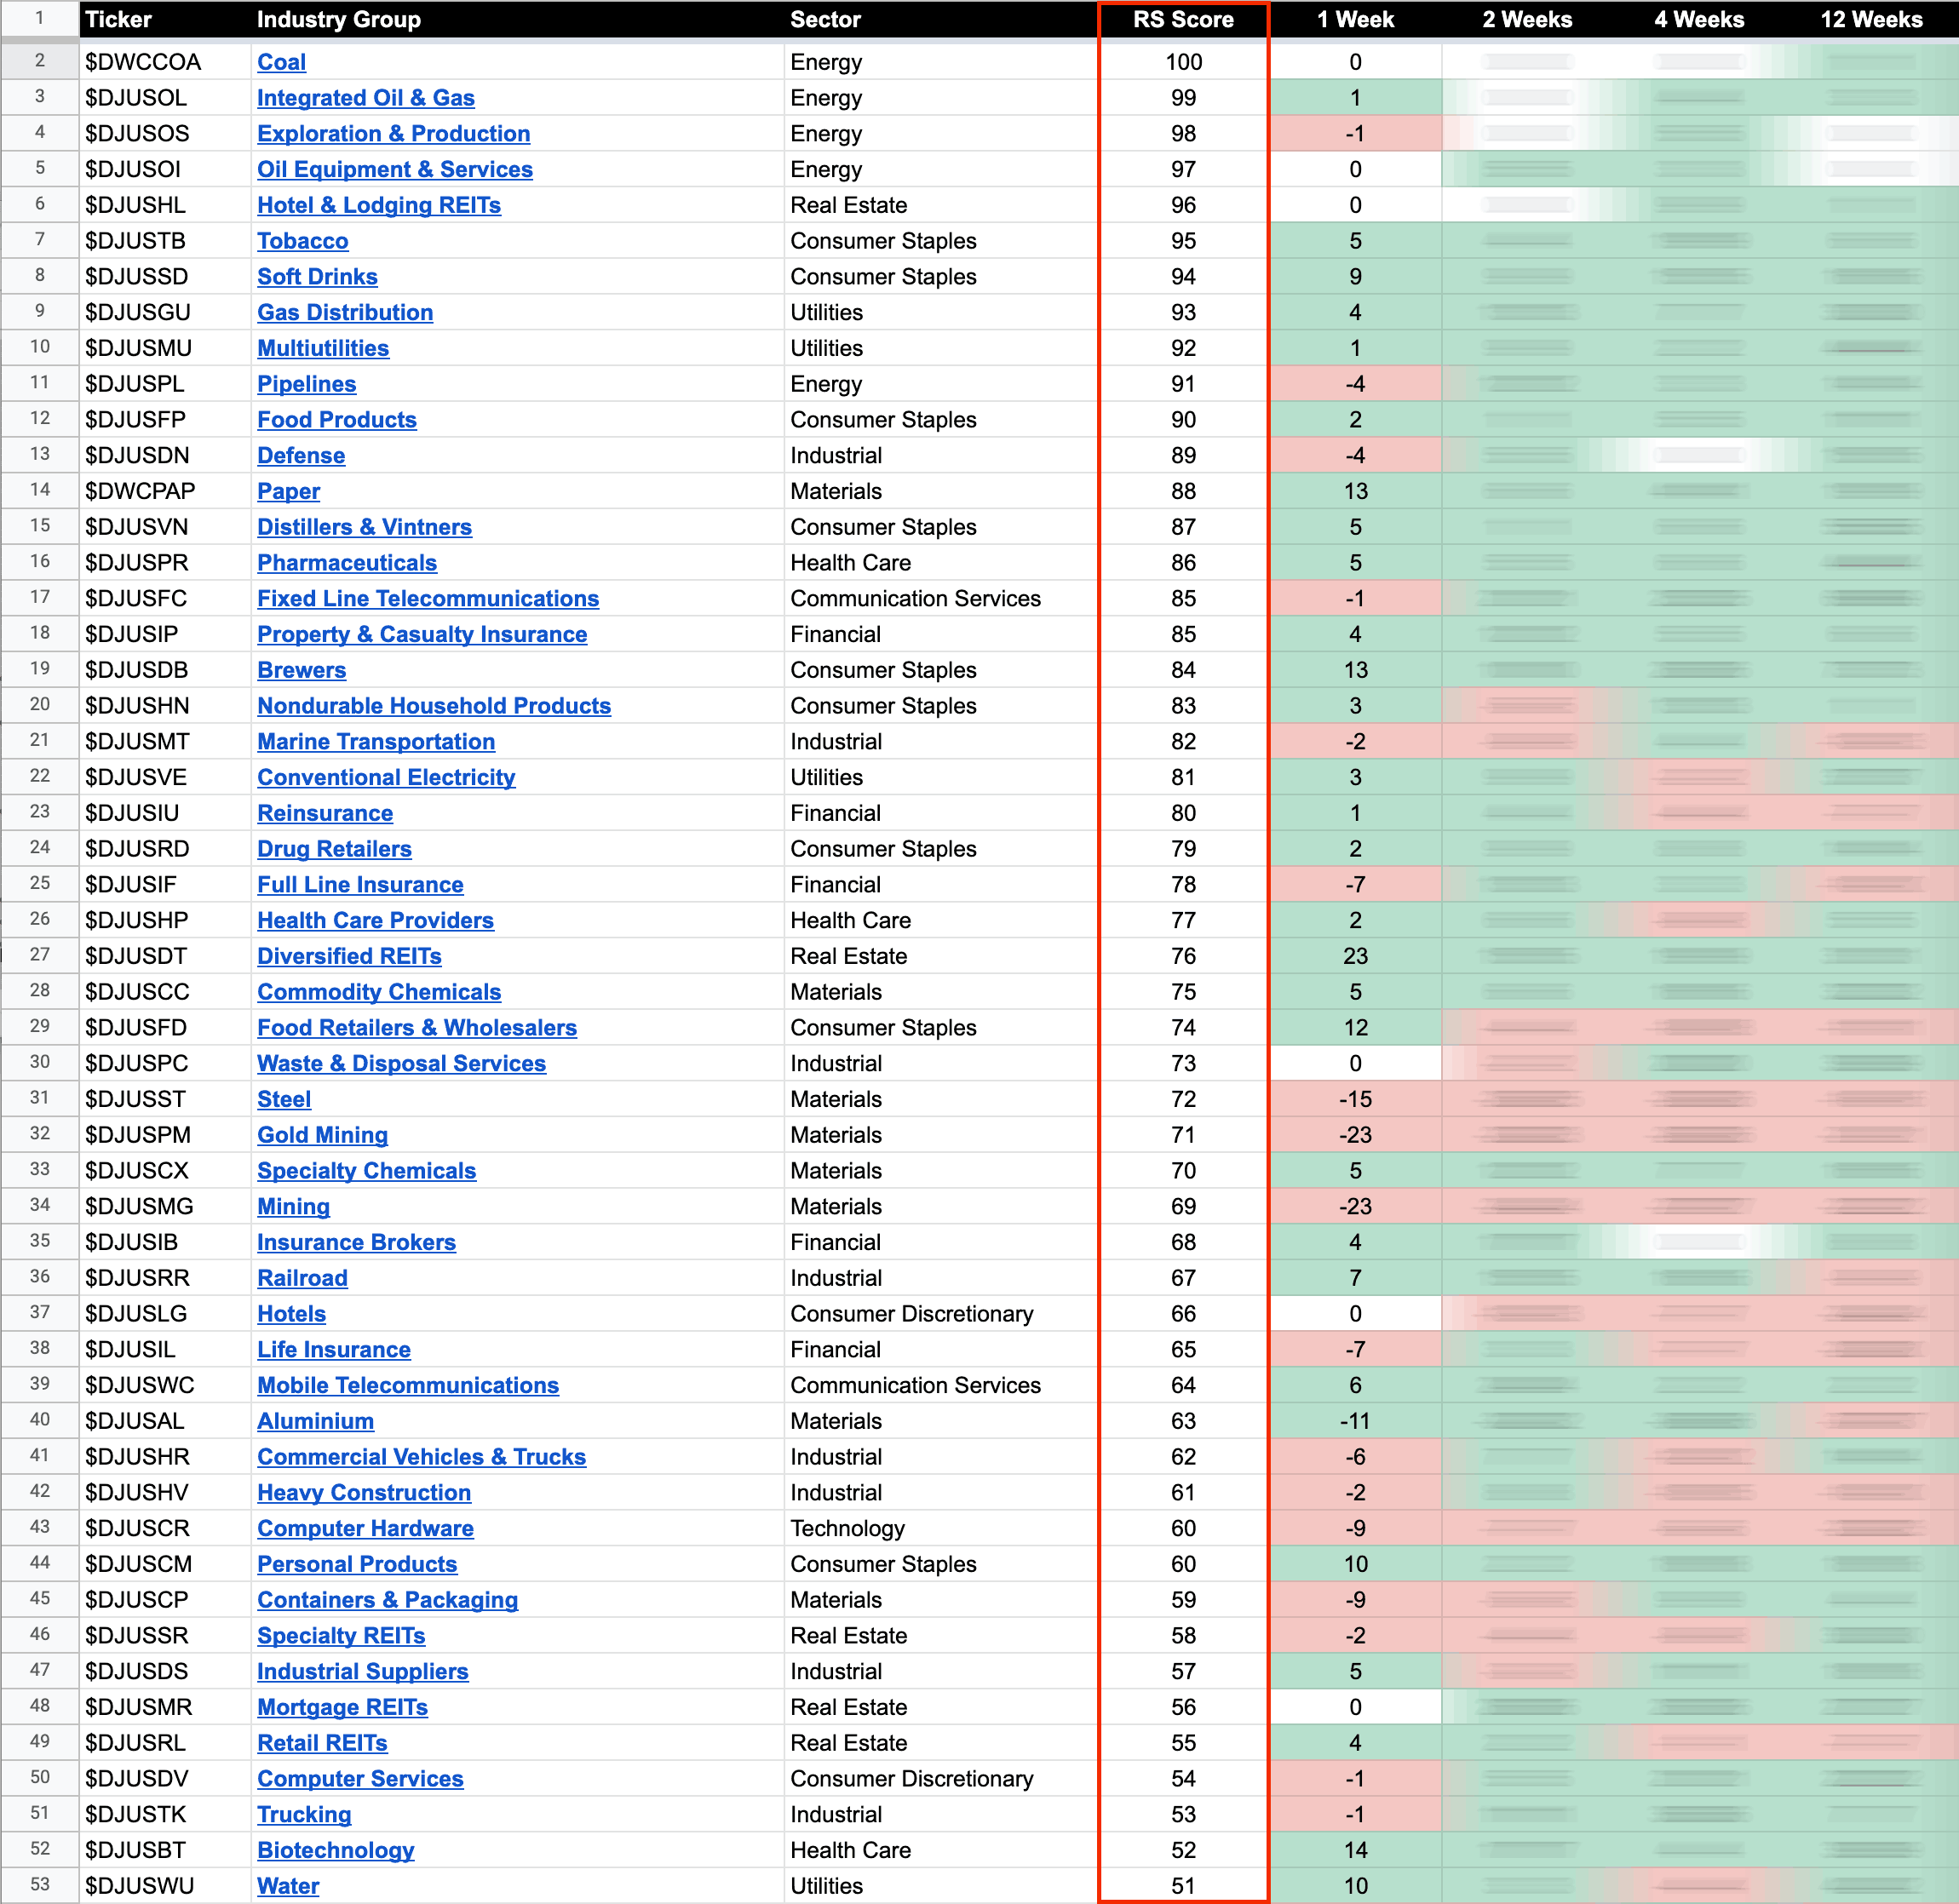
US Stocks Industry Groups Relative Strength Rankings
The purpose of the Relative Strength (RS) tables is to track the short, medium and long term RS changes of the individual groups to find the new leadership earlier than the crowd...
Read More
03 May, 2022
Earnings Season Continues to Provide Opportunity and the US Stocks Watchlist – 3 May 2022
Tuesday was a heavy day for earning results with 118 before the open and a further 280 after the close (Data from Earnings Whispers)...
Read More
01 May, 2022
Stage Analysis Members Weekend Video – 1 May 2022 (1hr 22mins)
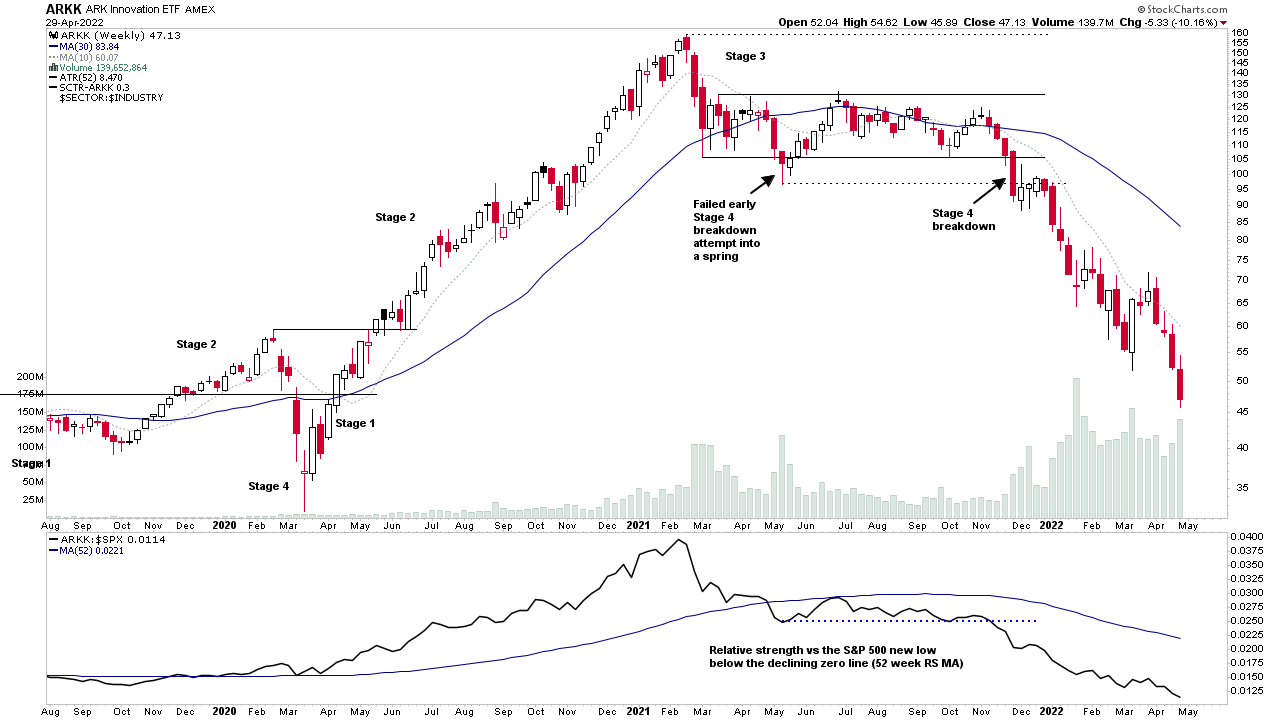
This weekends Stage Analysis Members Video features analysis of the Major US Stock Market Indexes and ETFs – S&P 500, Nasdaq Composite, Russell 2000, IBD 50, ARKK, plus the VIX and also a look at the earnings reactions of some of the mega cap stocks that reported over the last week, including GOOGL, AAPL, MSFT, AMZN and more.
Read More
01 May, 2022
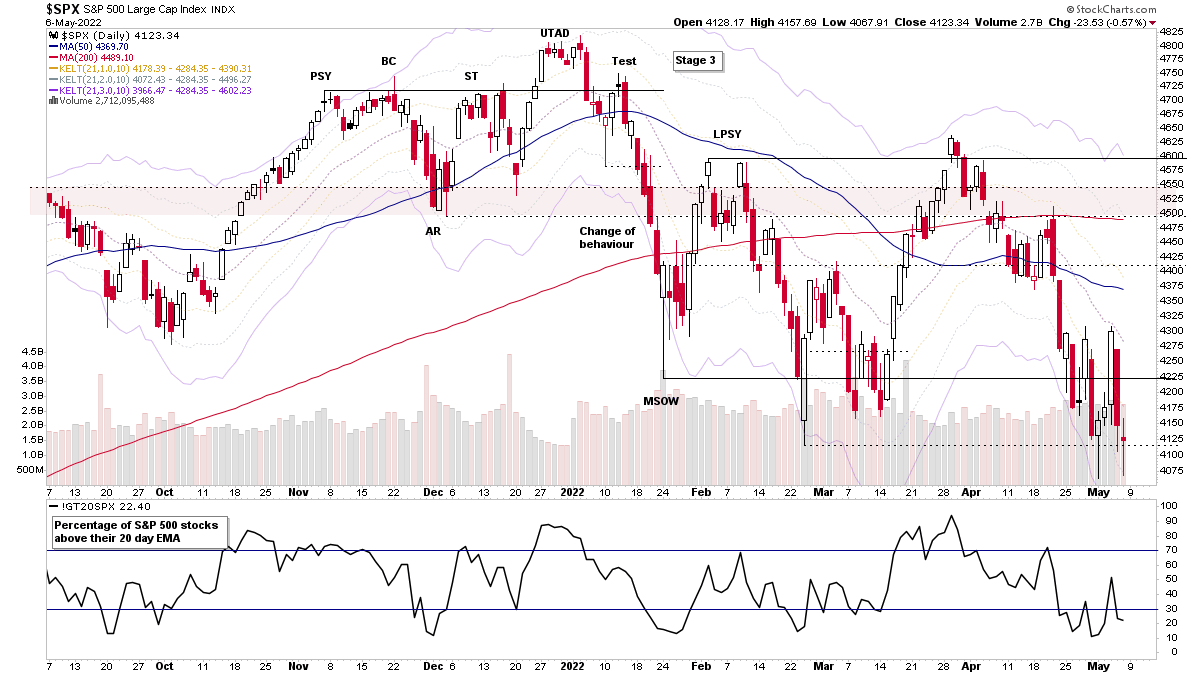
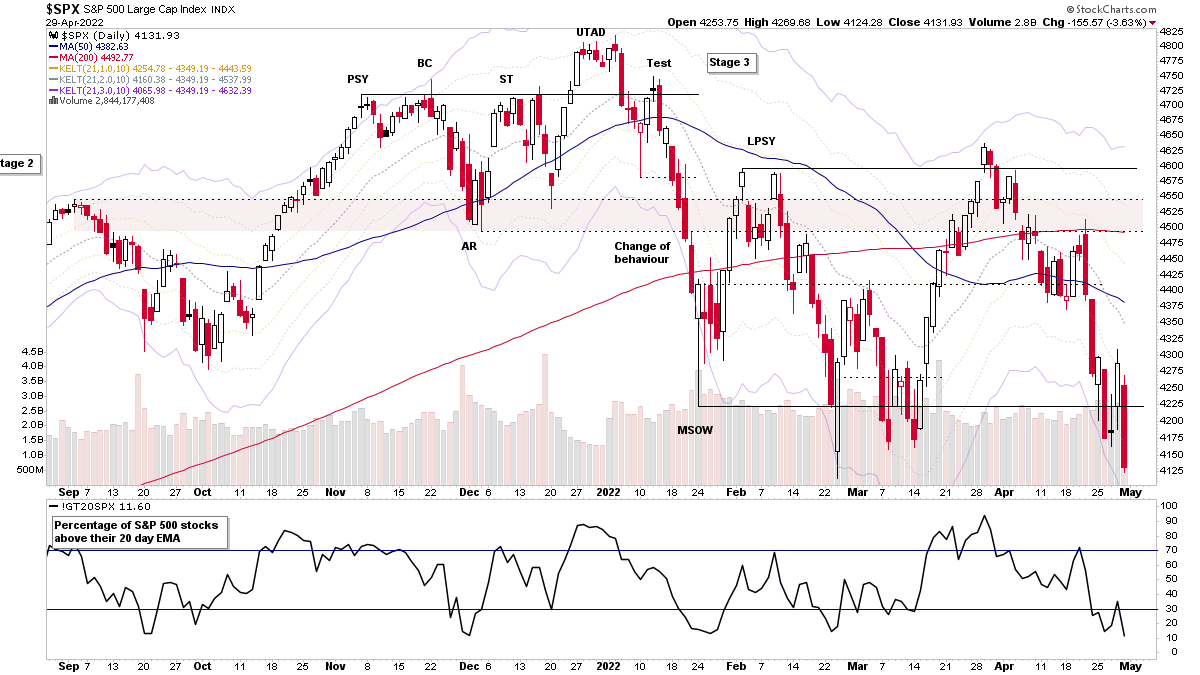
Major Stock Indexes Testing the Stage 4 Breakdown Level
The major US indexes (i.e. the S&P 500, NYSE, Nasdaq Composite and Russell 2000 etc) all closed the week at the lows, after Thursdays bounce attempt was convincingly rejected, and with multiple indexes already in Stage 4, the holdouts have now started to breakdown as well – with the S&P 500 and NYSE both making Stage 4 breakdown attempts at the end of the week. So risk is extremely elevated of the Stage 4 decline accelerating.
Read More
30 April, 2022
US Stocks Industry Groups Relative Strength Rankings
The purpose of the Relative Strength (RS) tables is to track the short, medium and long term RS changes of the individual groups to find the new leadership earlier than the crowd...
Read More