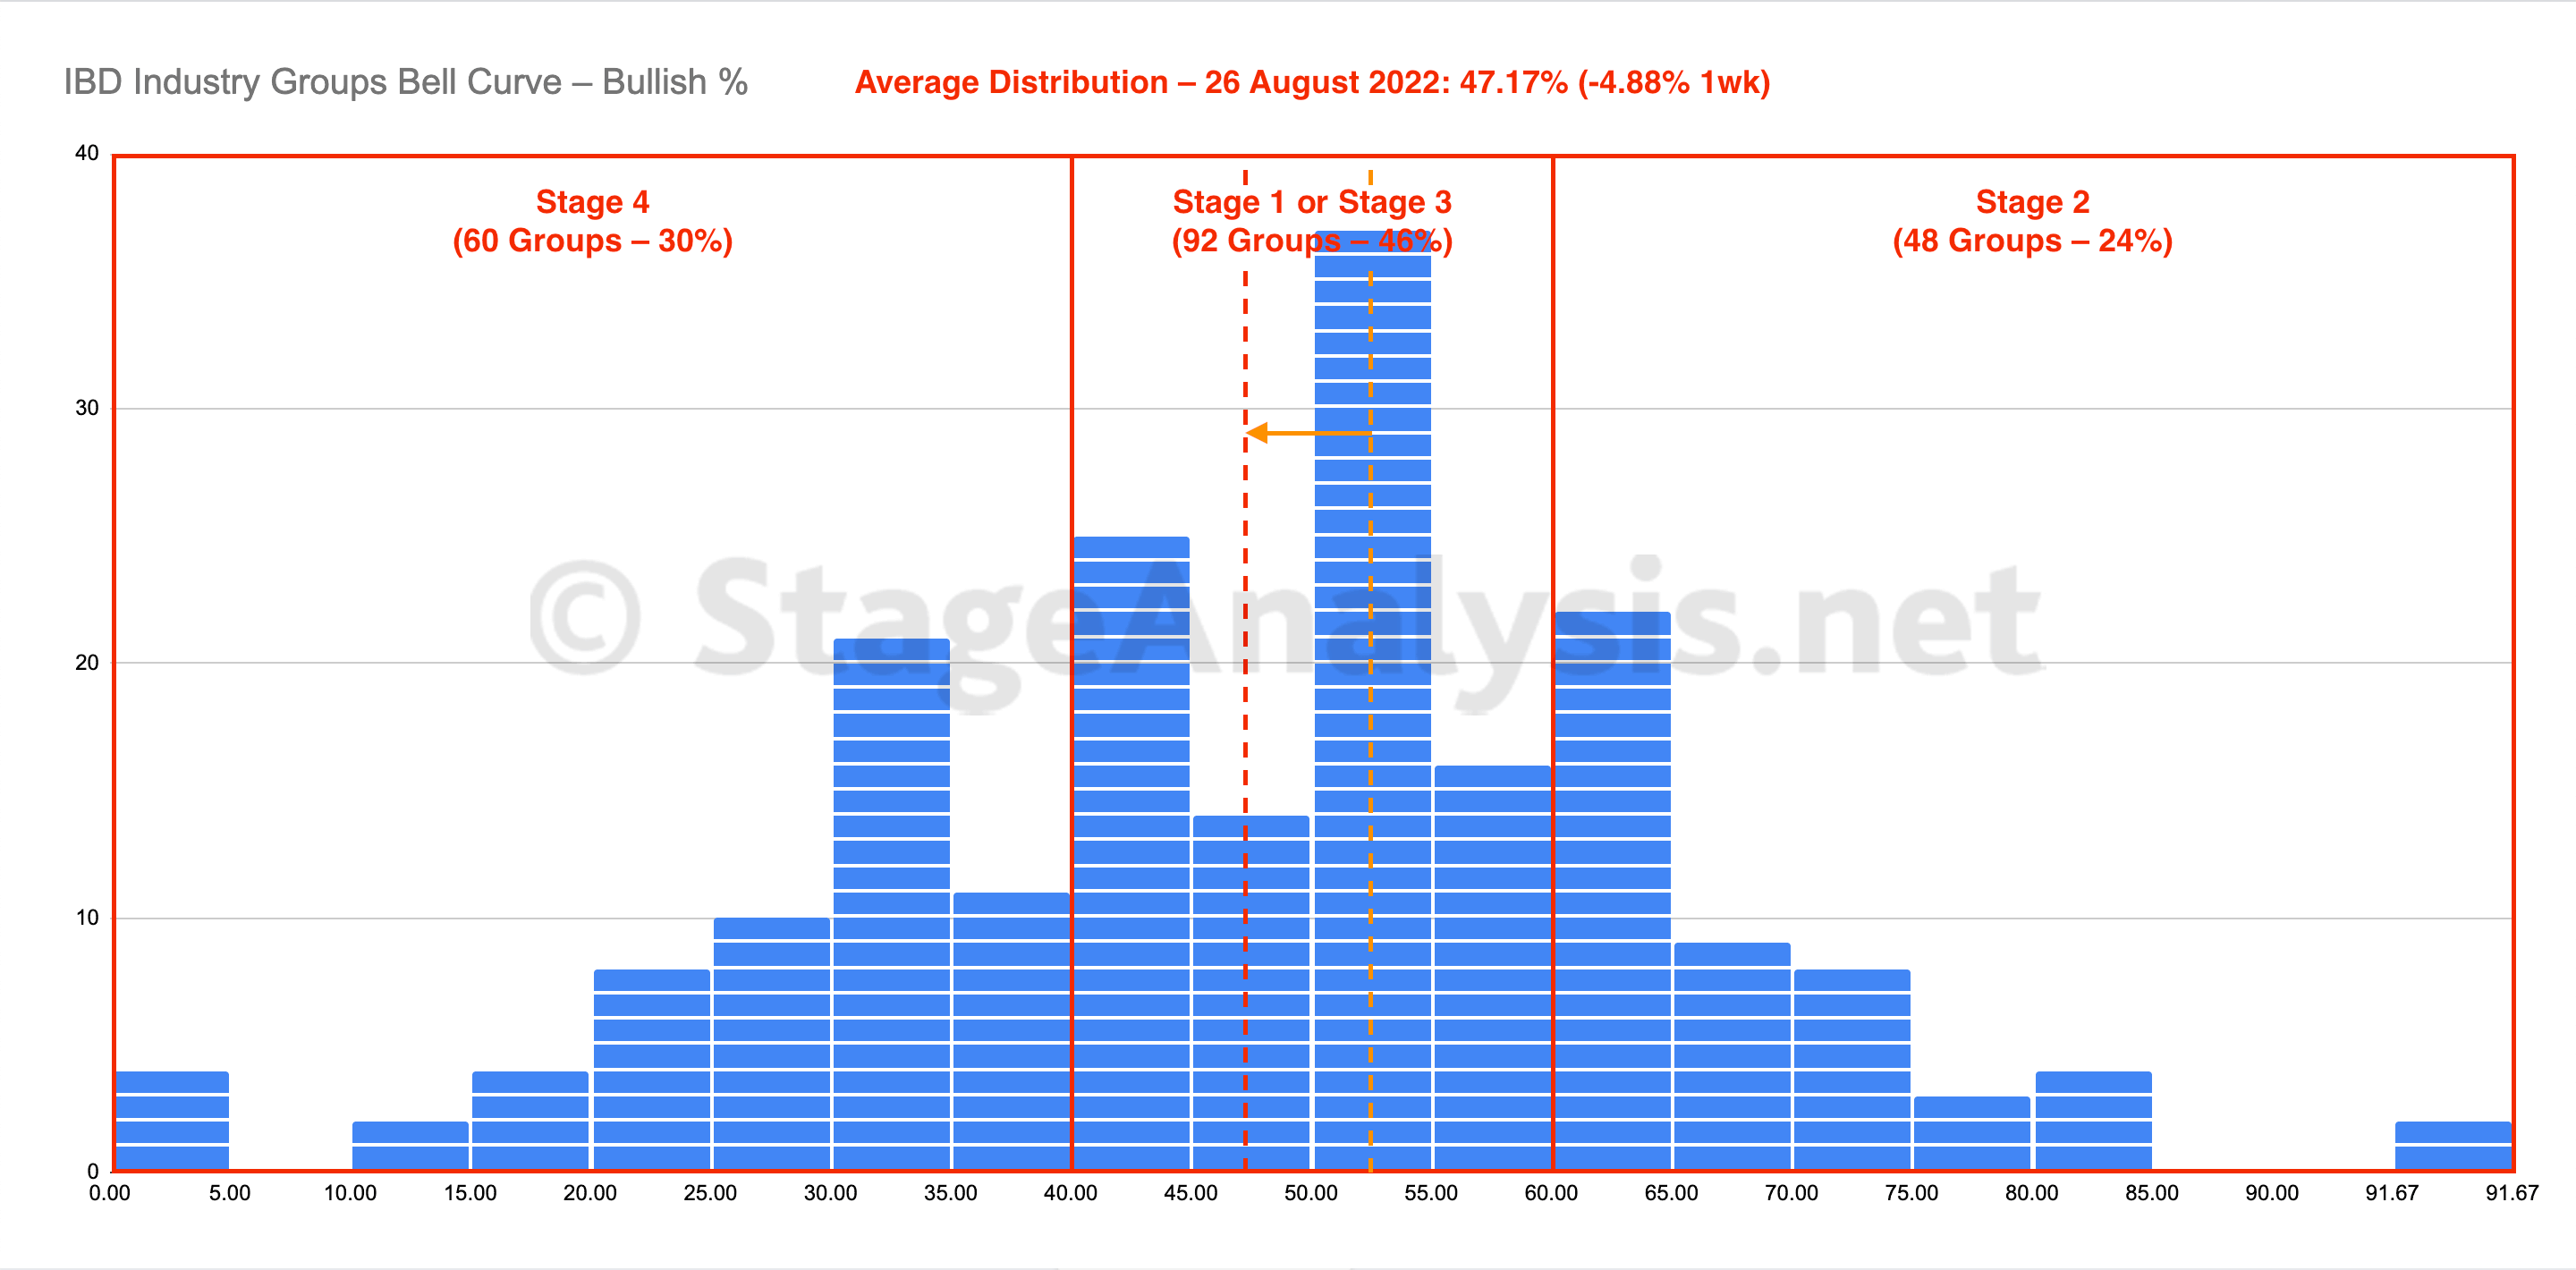
The IBD Industry Groups Bell Curve – Bullish Percent average distribution declined by a further -4.88% since the previous week, with 16 groups dropping out of the Stage 2 zone and 21 groups dropping back into the Stage 4 zone...
Read More

Blog
28 August, 2022
IBD Industry Groups Bell Curve – Bullish Percent
26 August, 2022
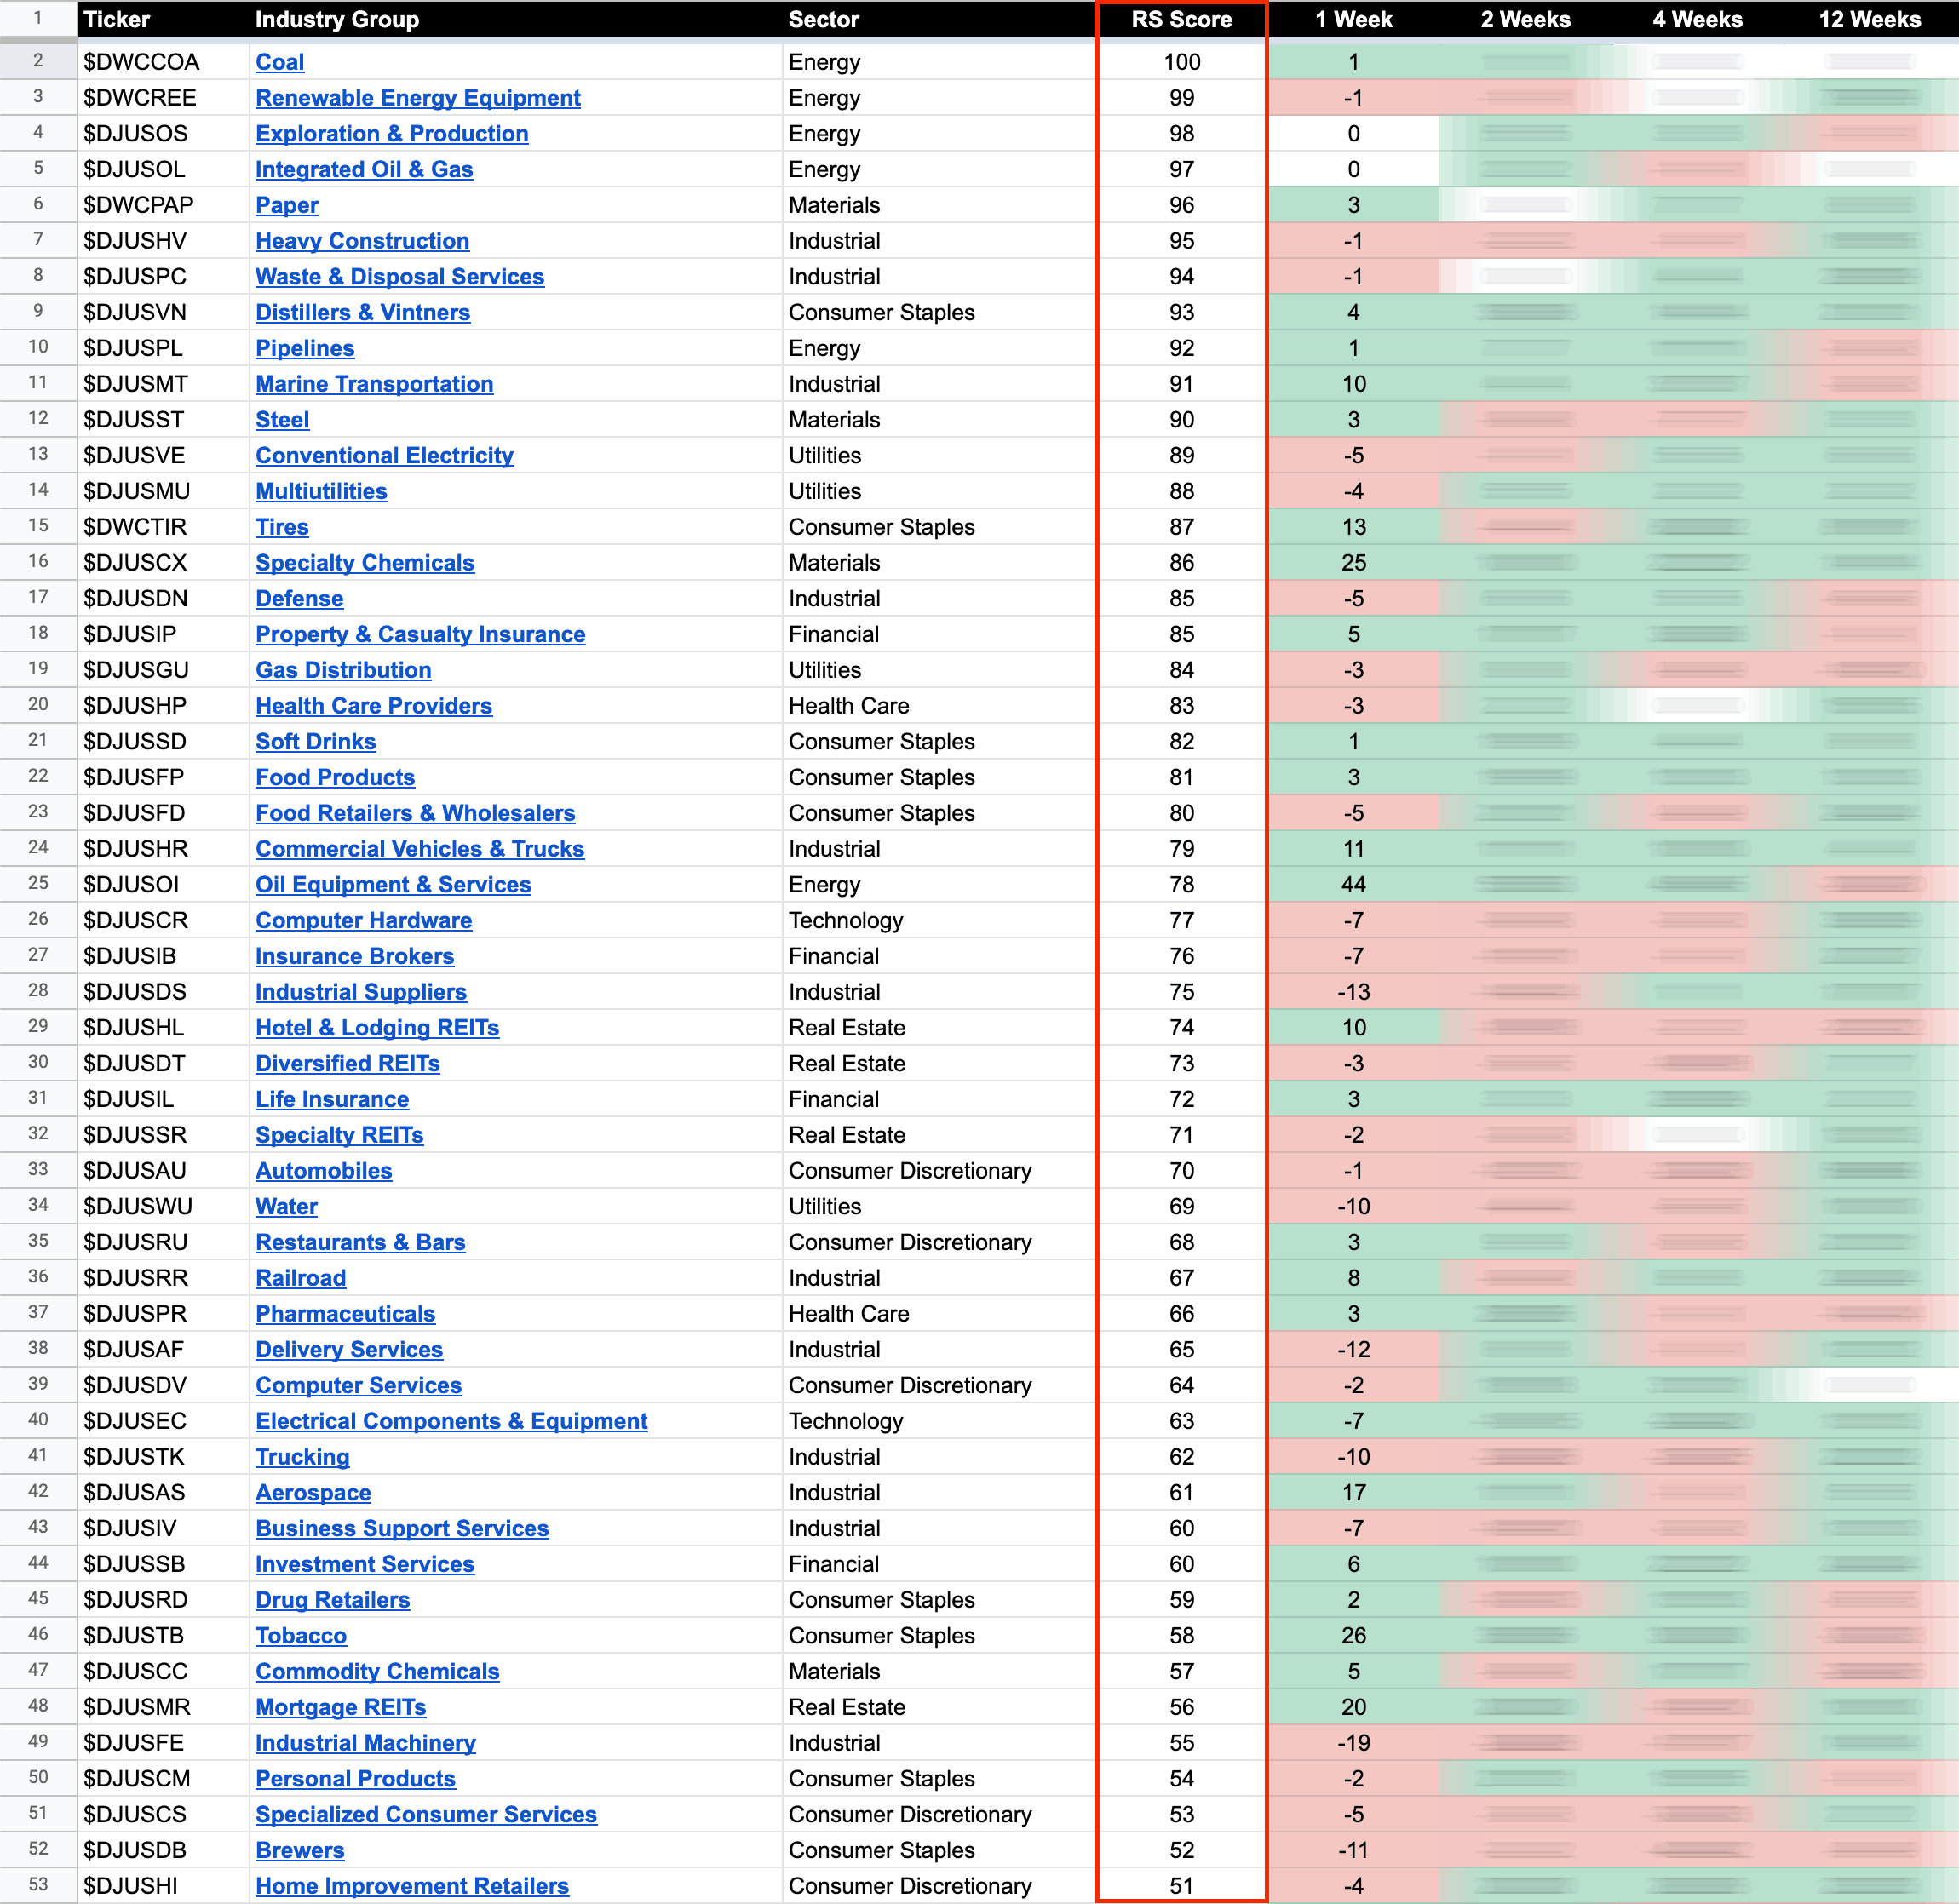
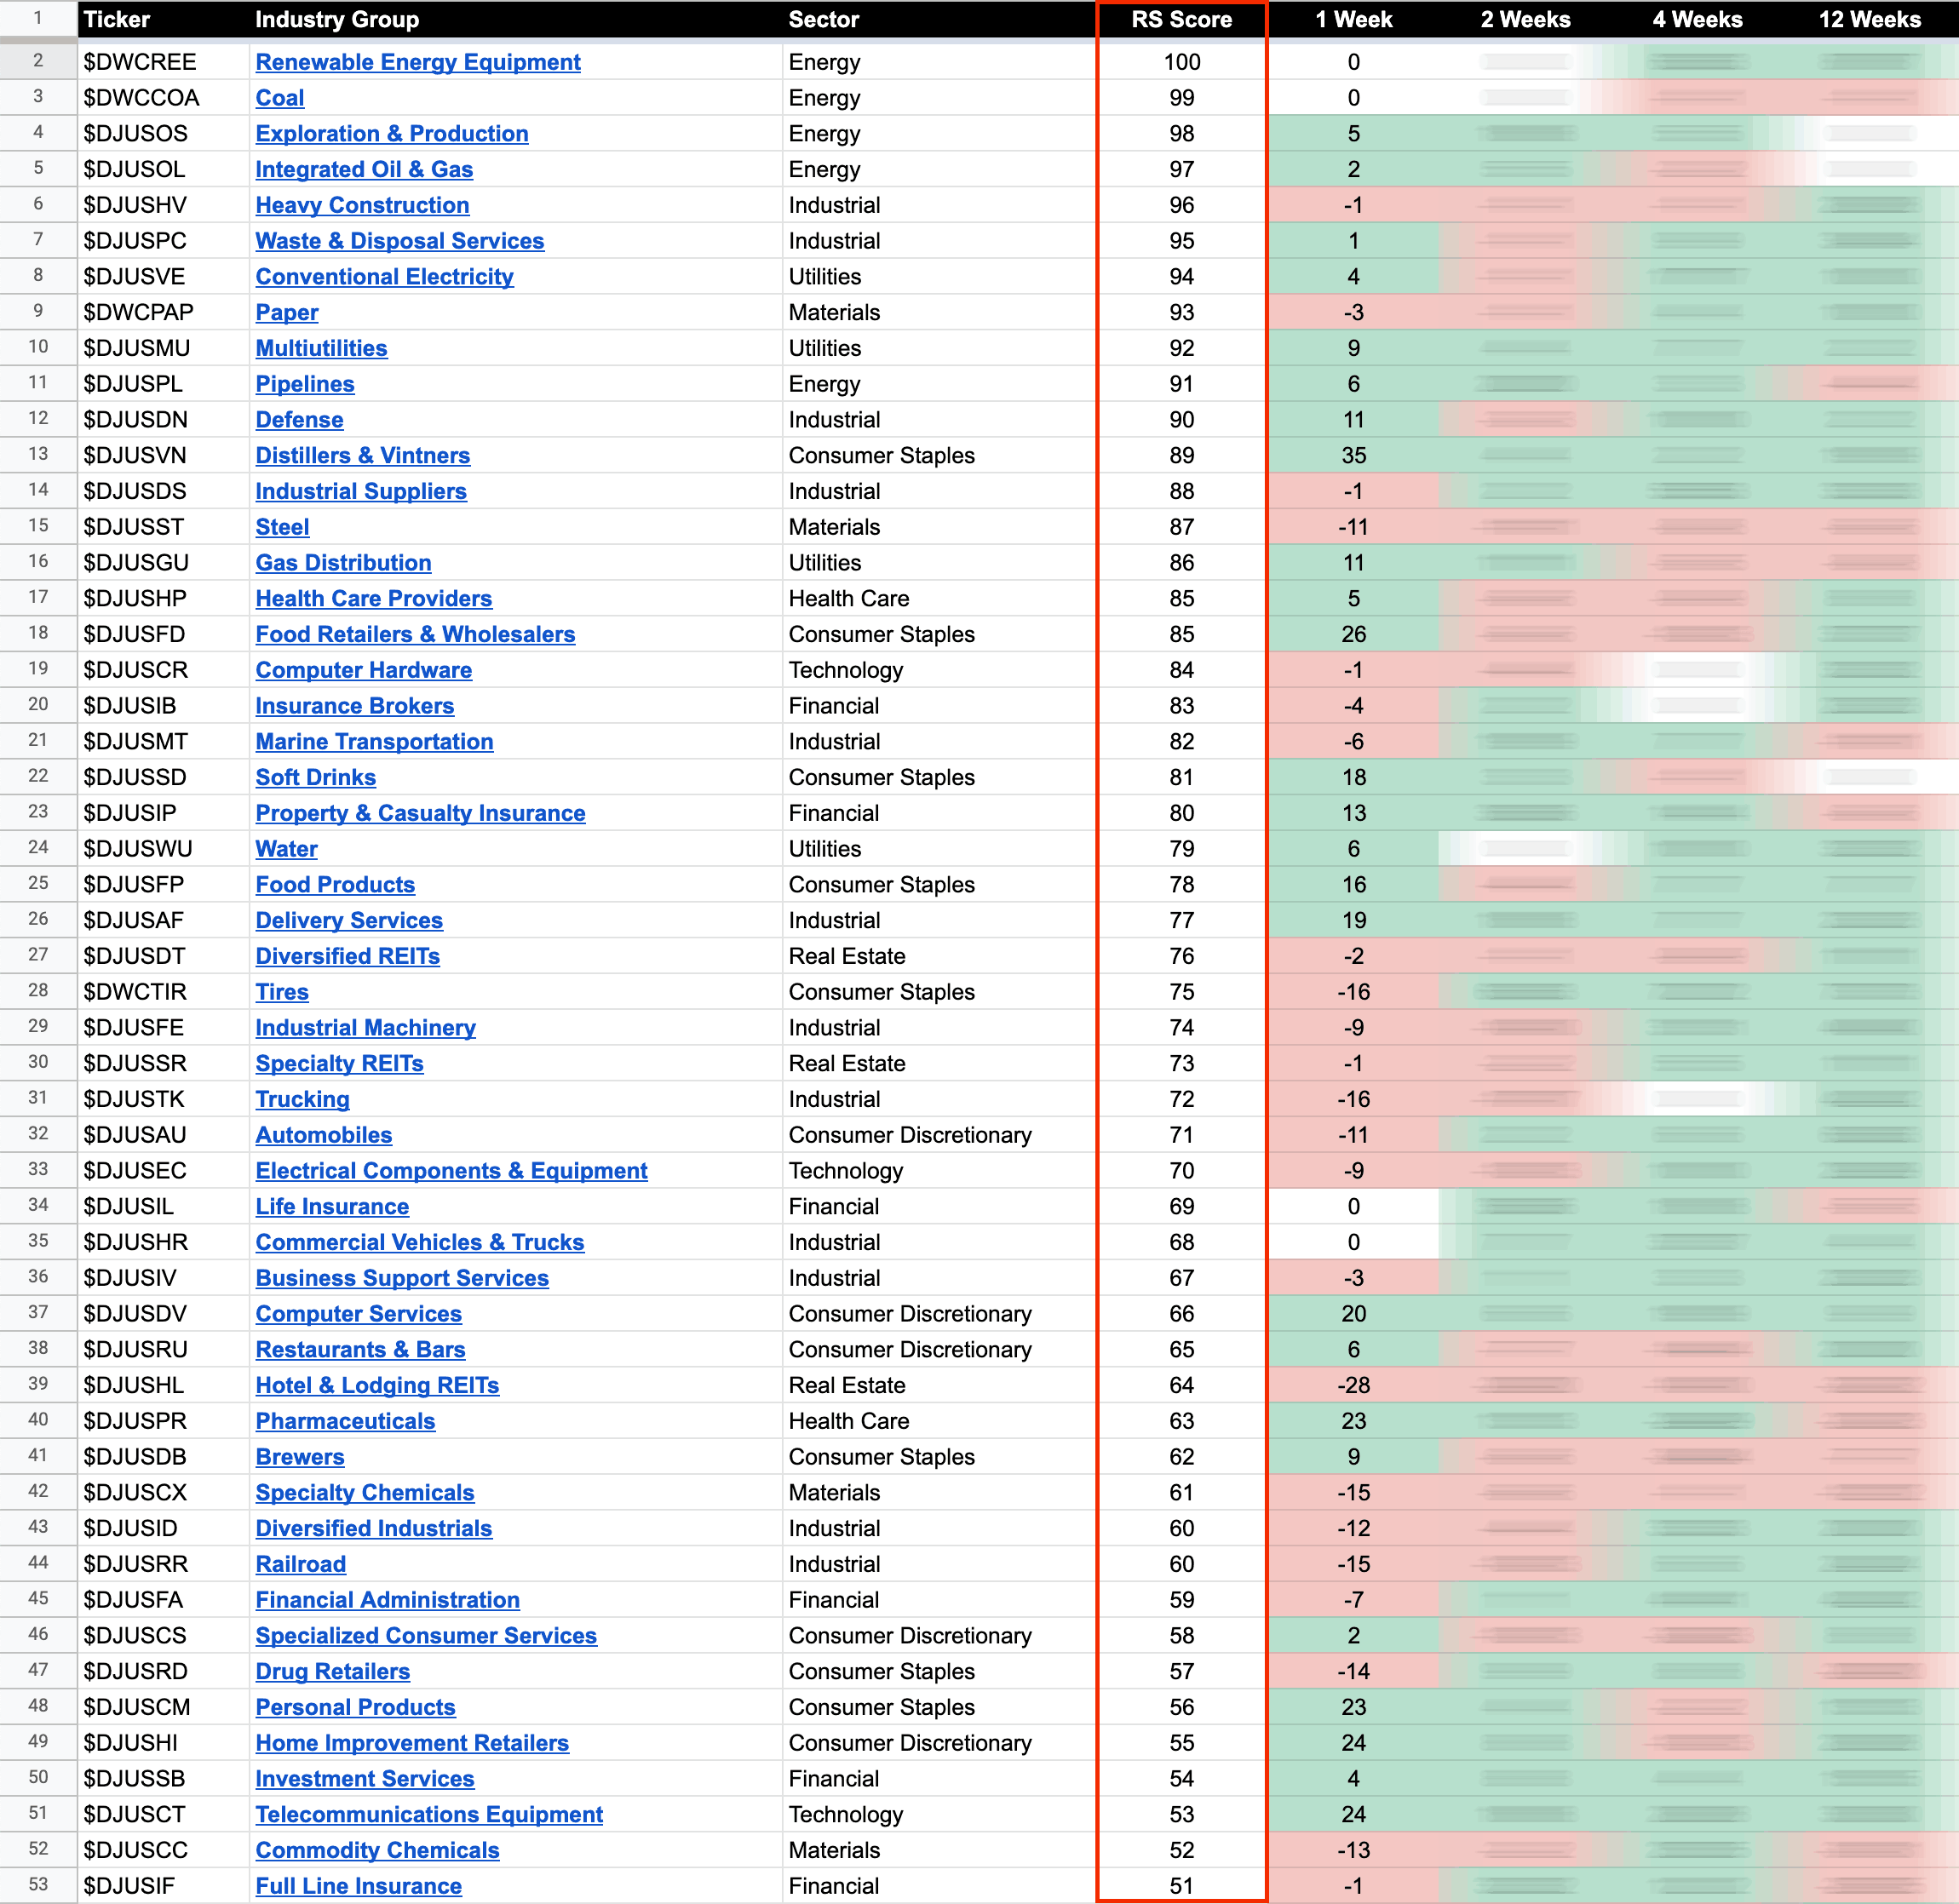
US Stocks Industry Groups Relative Strength Rankings
The purpose of the Relative Strength (RS) tables is to track the short, medium and long term RS changes of the individual groups to find the new leadership earlier than the crowd...
Read More
21 August, 2022
Stage Analysis Members Weekend Video – 21 August 2022 (1hr 34mins)
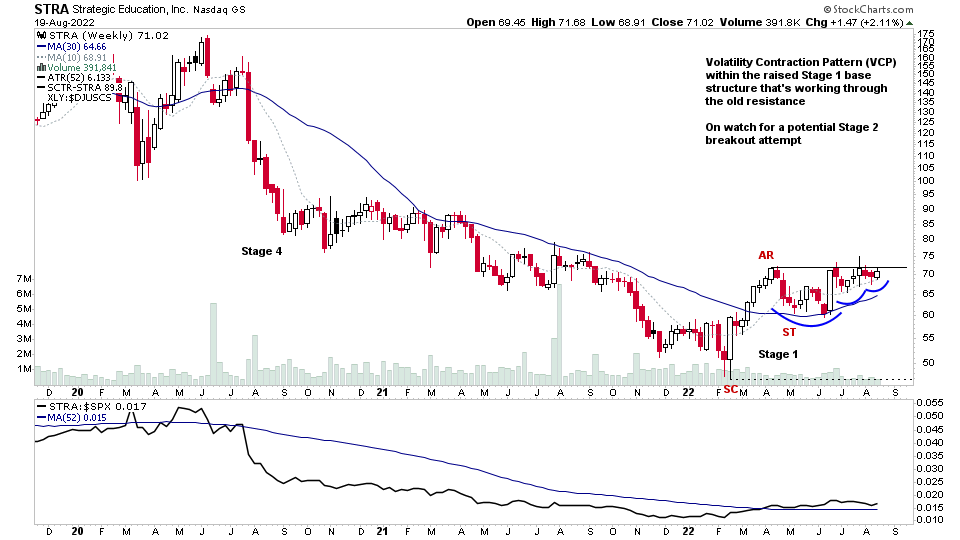
This weeks Stage Analysis Members video begins with a discussion of a more complex Stage 1 base structure that can develop when a stock has a very early Stage 2 breakout attempt from a small base that then quickly fails and broadens out into much larger Stage 1 base structure.
Read More
20 August, 2022
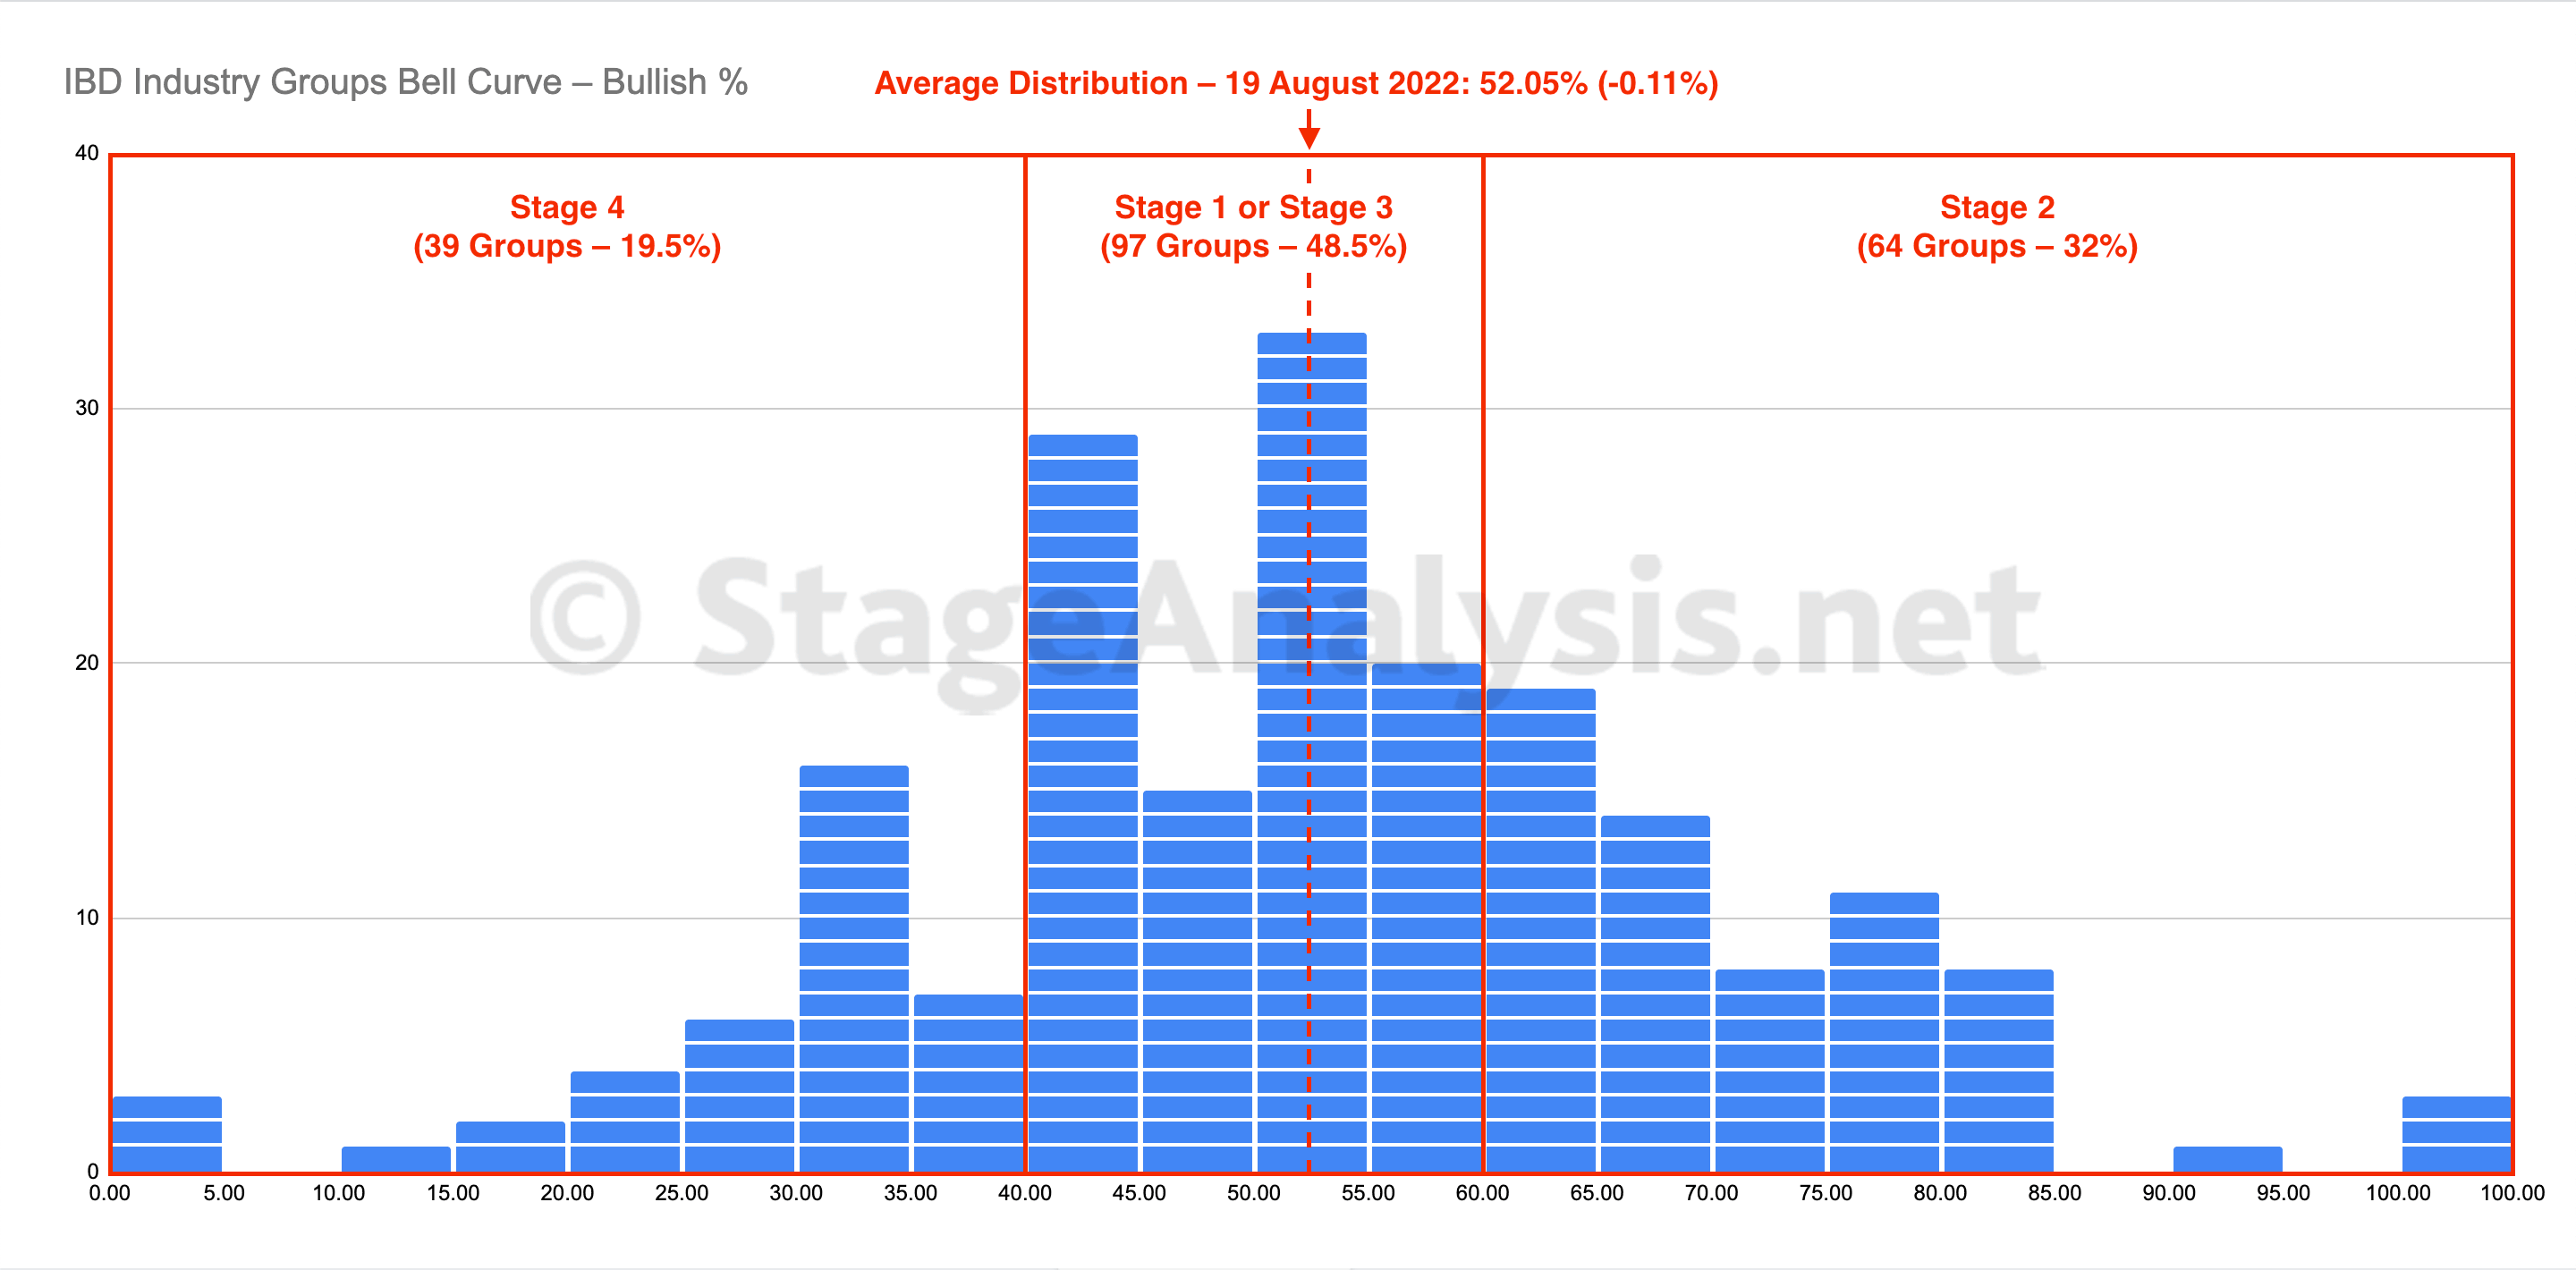
IBD Industry Groups Bell Curve – Bullish Percent
The IBD Industry Groups Bell Curve – Bullish Percent average distribution declining by -0.11% since the previous week, with 3 groups dropping out of the Stage 2 zone and one group dropping back into the Stage 4 zone. But the overall average remains slightly above the mid point of the bell curve, which is the Stage 1 zone when rising from the lower Stage 4 zone.
Read More
19 August, 2022
US Stocks Industry Groups Relative Strength Rankings
The purpose of the Relative Strength (RS) tables is to track the short, medium and long term RS changes of the individual groups to find the new leadership earlier than the crowd...
Read More
14 August, 2022
Stage Analysis Members Weekend Video – 14 August 2022 (1hr 32mins)
This weeks Stage Analysis Members weekend video begins with a detailed run through of the weekend watchlist stocks on multiple timeframes, with live markups of the charts and explanations of what we are looking for in each.
Read More
13 August, 2022
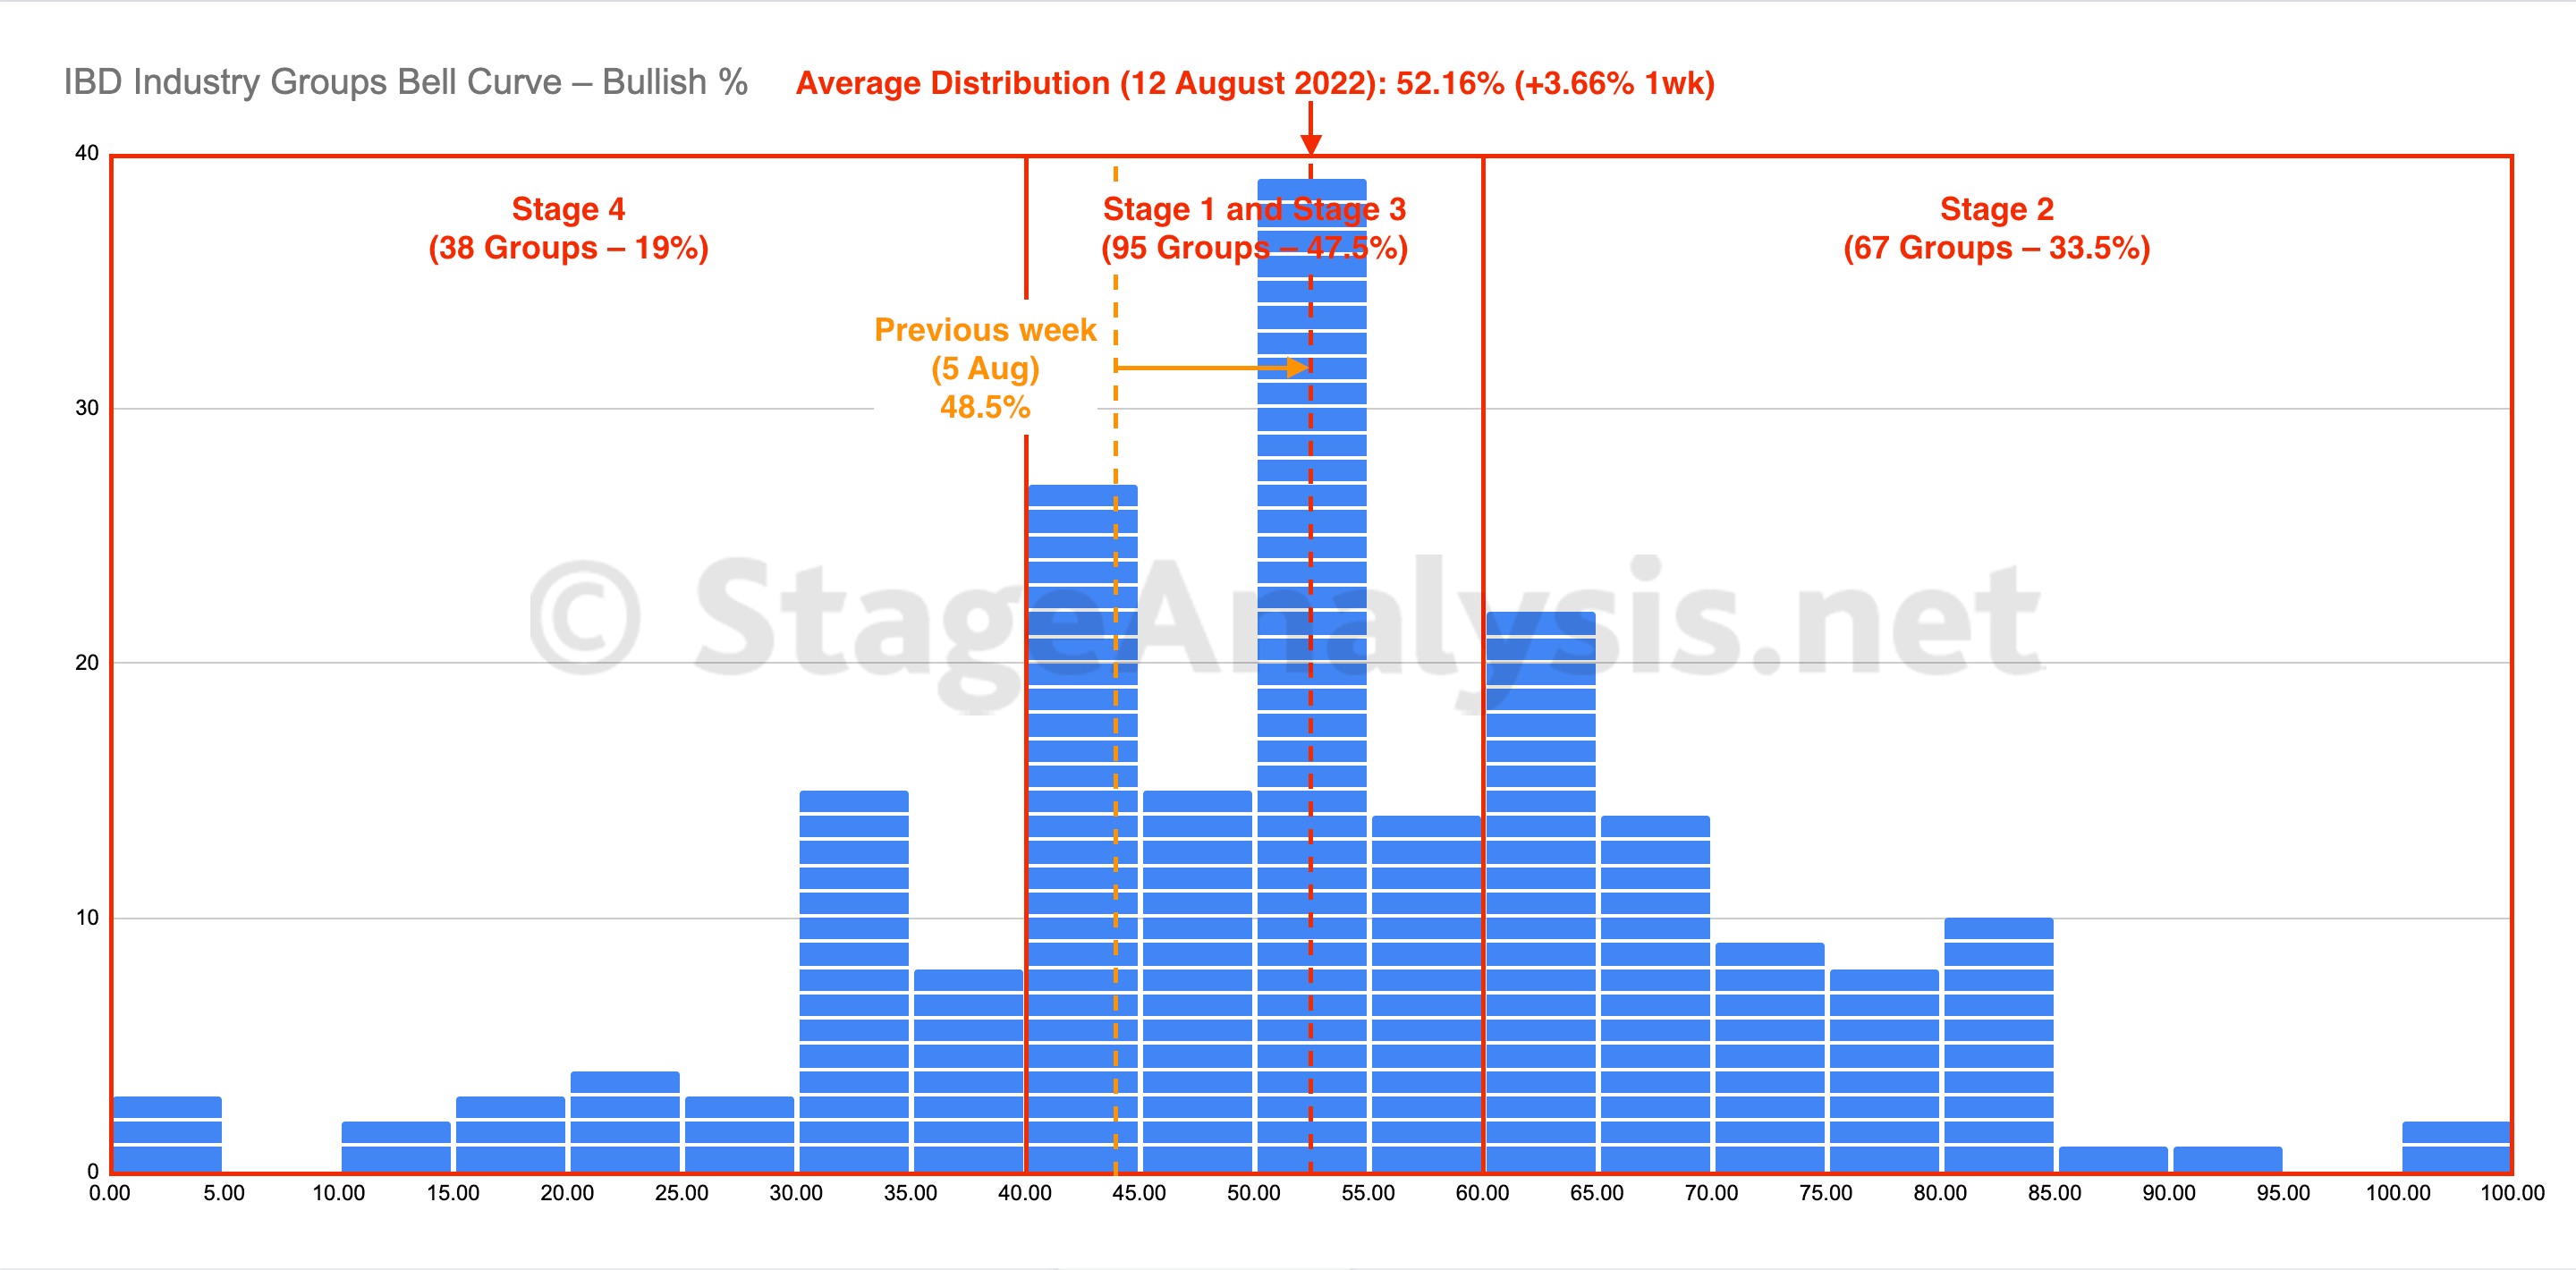
IBD Industry Groups Bell Curve – Bullish Percent
The IBD Industry Groups Bell Curve – Bullish Percent continued to improve over the last week, crossing the mid point of the bell curve and pushing further into the Stage 1 zone (40% to 60% range). With an additional 9.5% of groups leaving the Stage 4 zone (below 40%).
Read More
12 August, 2022
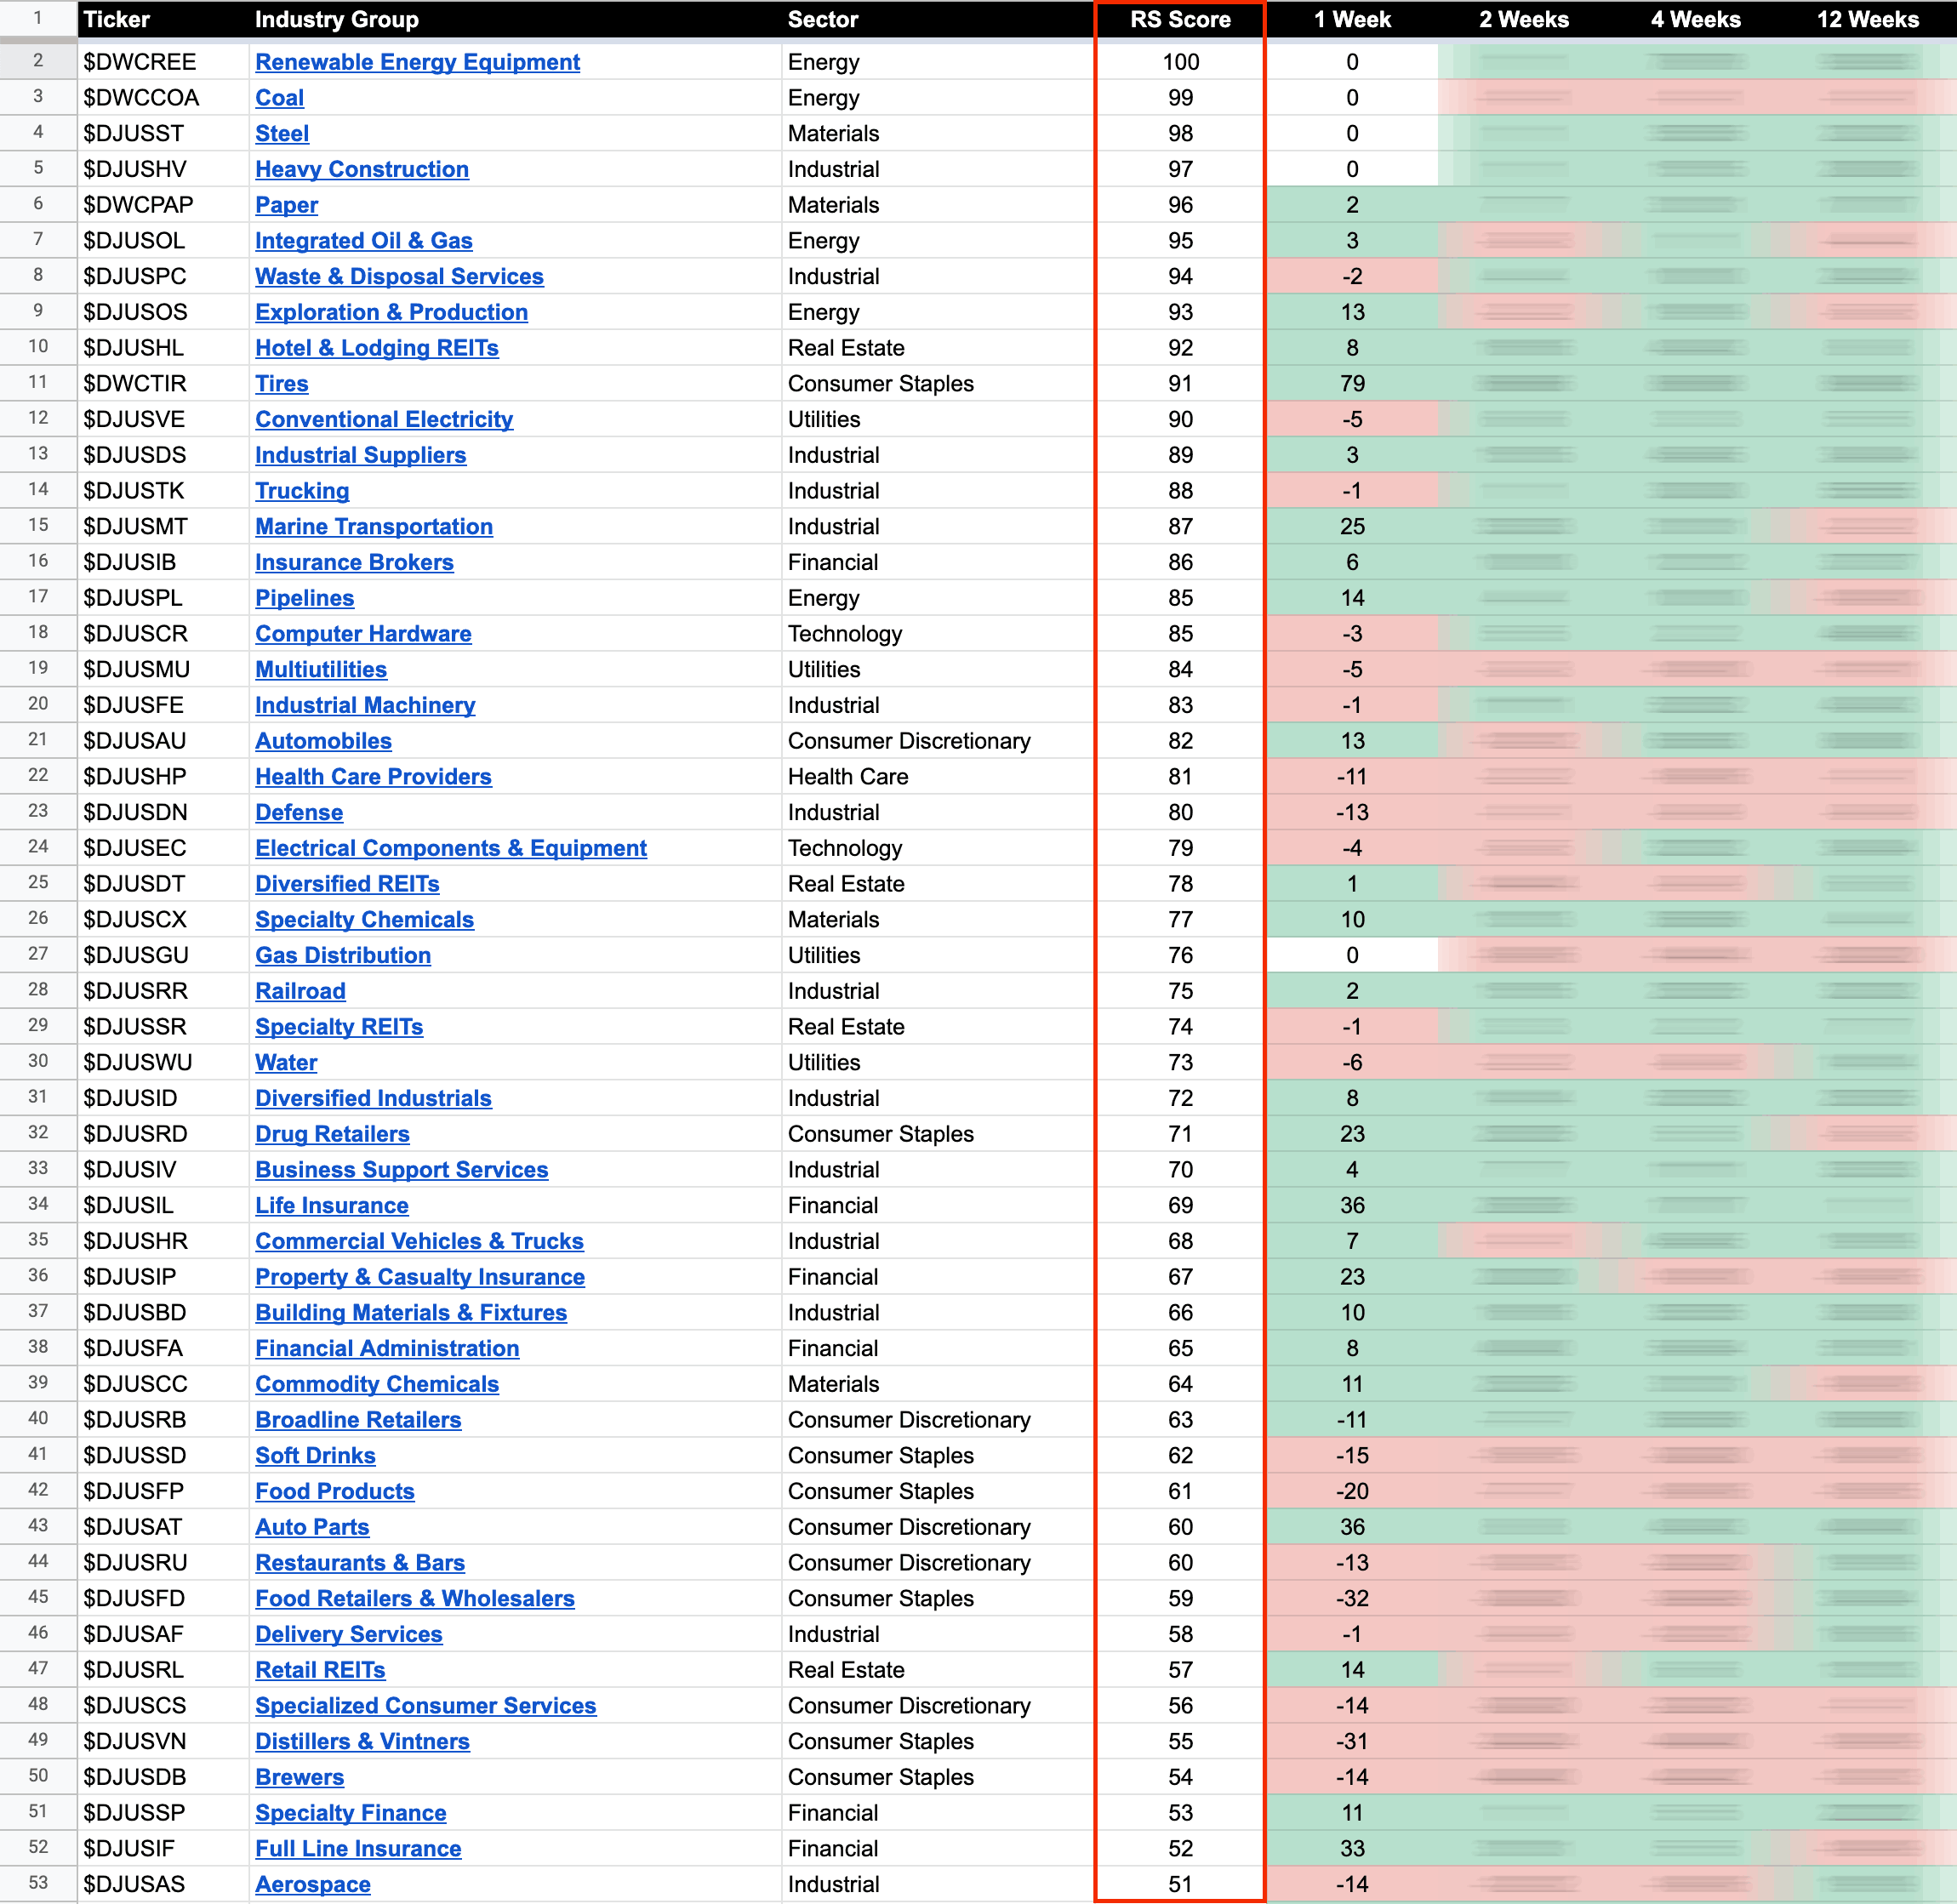
US Stocks Industry Groups Relative Strength Rankings
The purpose of the Relative Strength (RS) tables is to track the short, medium and long term RS changes of the individual groups to find the new leadership earlier than the crowd...
Read More
11 August, 2022
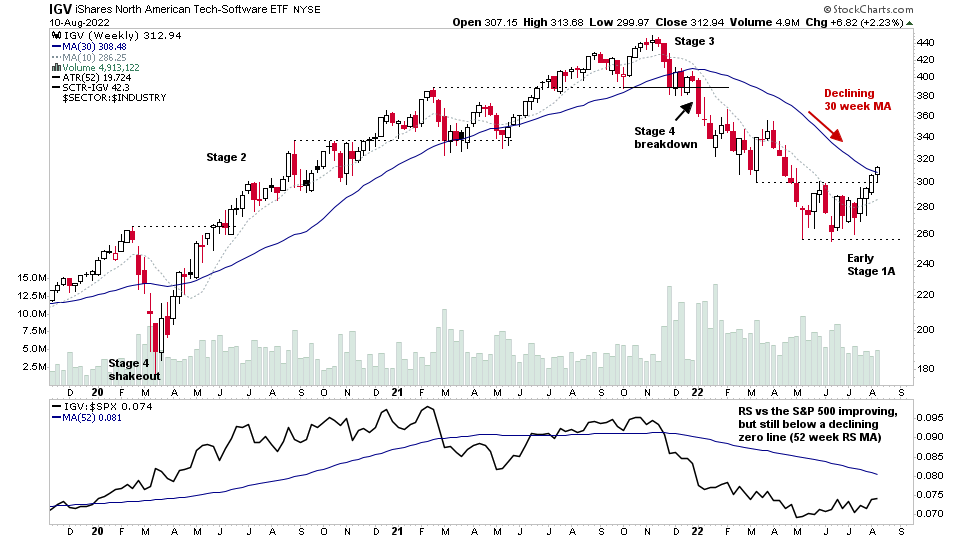
Video: Software Stocks Group Focus – Stage 1 Bases Proliferate – 10 August 2022 (1hr 7mins)
Todays Stage Analysis Members midweek video is a special feature on the Software group, which has been rising up the relative strength rankings over the last month, and has seen many stocks from the group appearing in the watchlist, due to the large number of stocks bases transitioning towards Stage 1, as well as a smaller number of stronger stocks in the group making the move into early Stage 2...
Read More
07 August, 2022
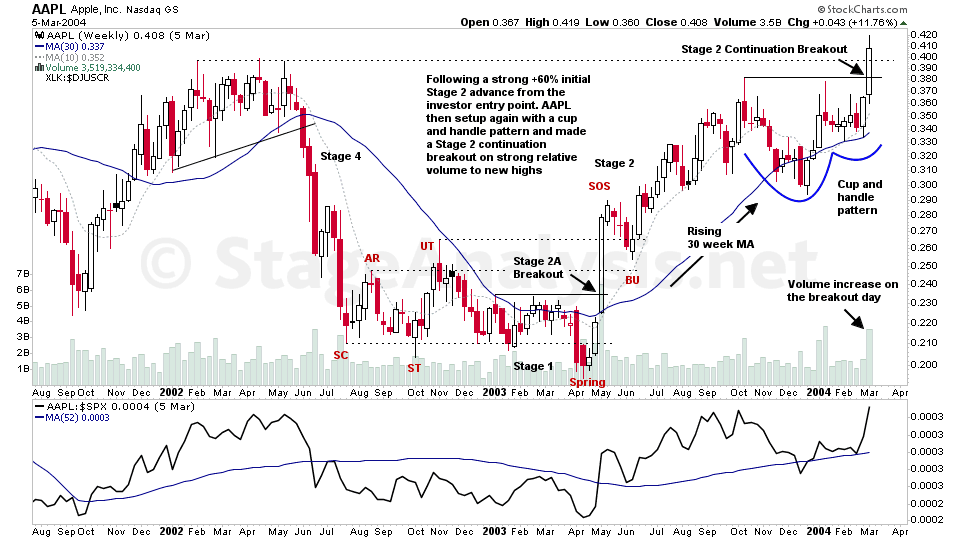
Stage Analysis Members Weekend Video – 7 August 2022 (1hr 30mins)
With the increased interest in Stan Weinstein's Stage Analysis method recently, I thought it would be useful to begin this weekends video with an educational feature on the Stage 2A entry point, using the example of AAPL from May 2003...
Read More