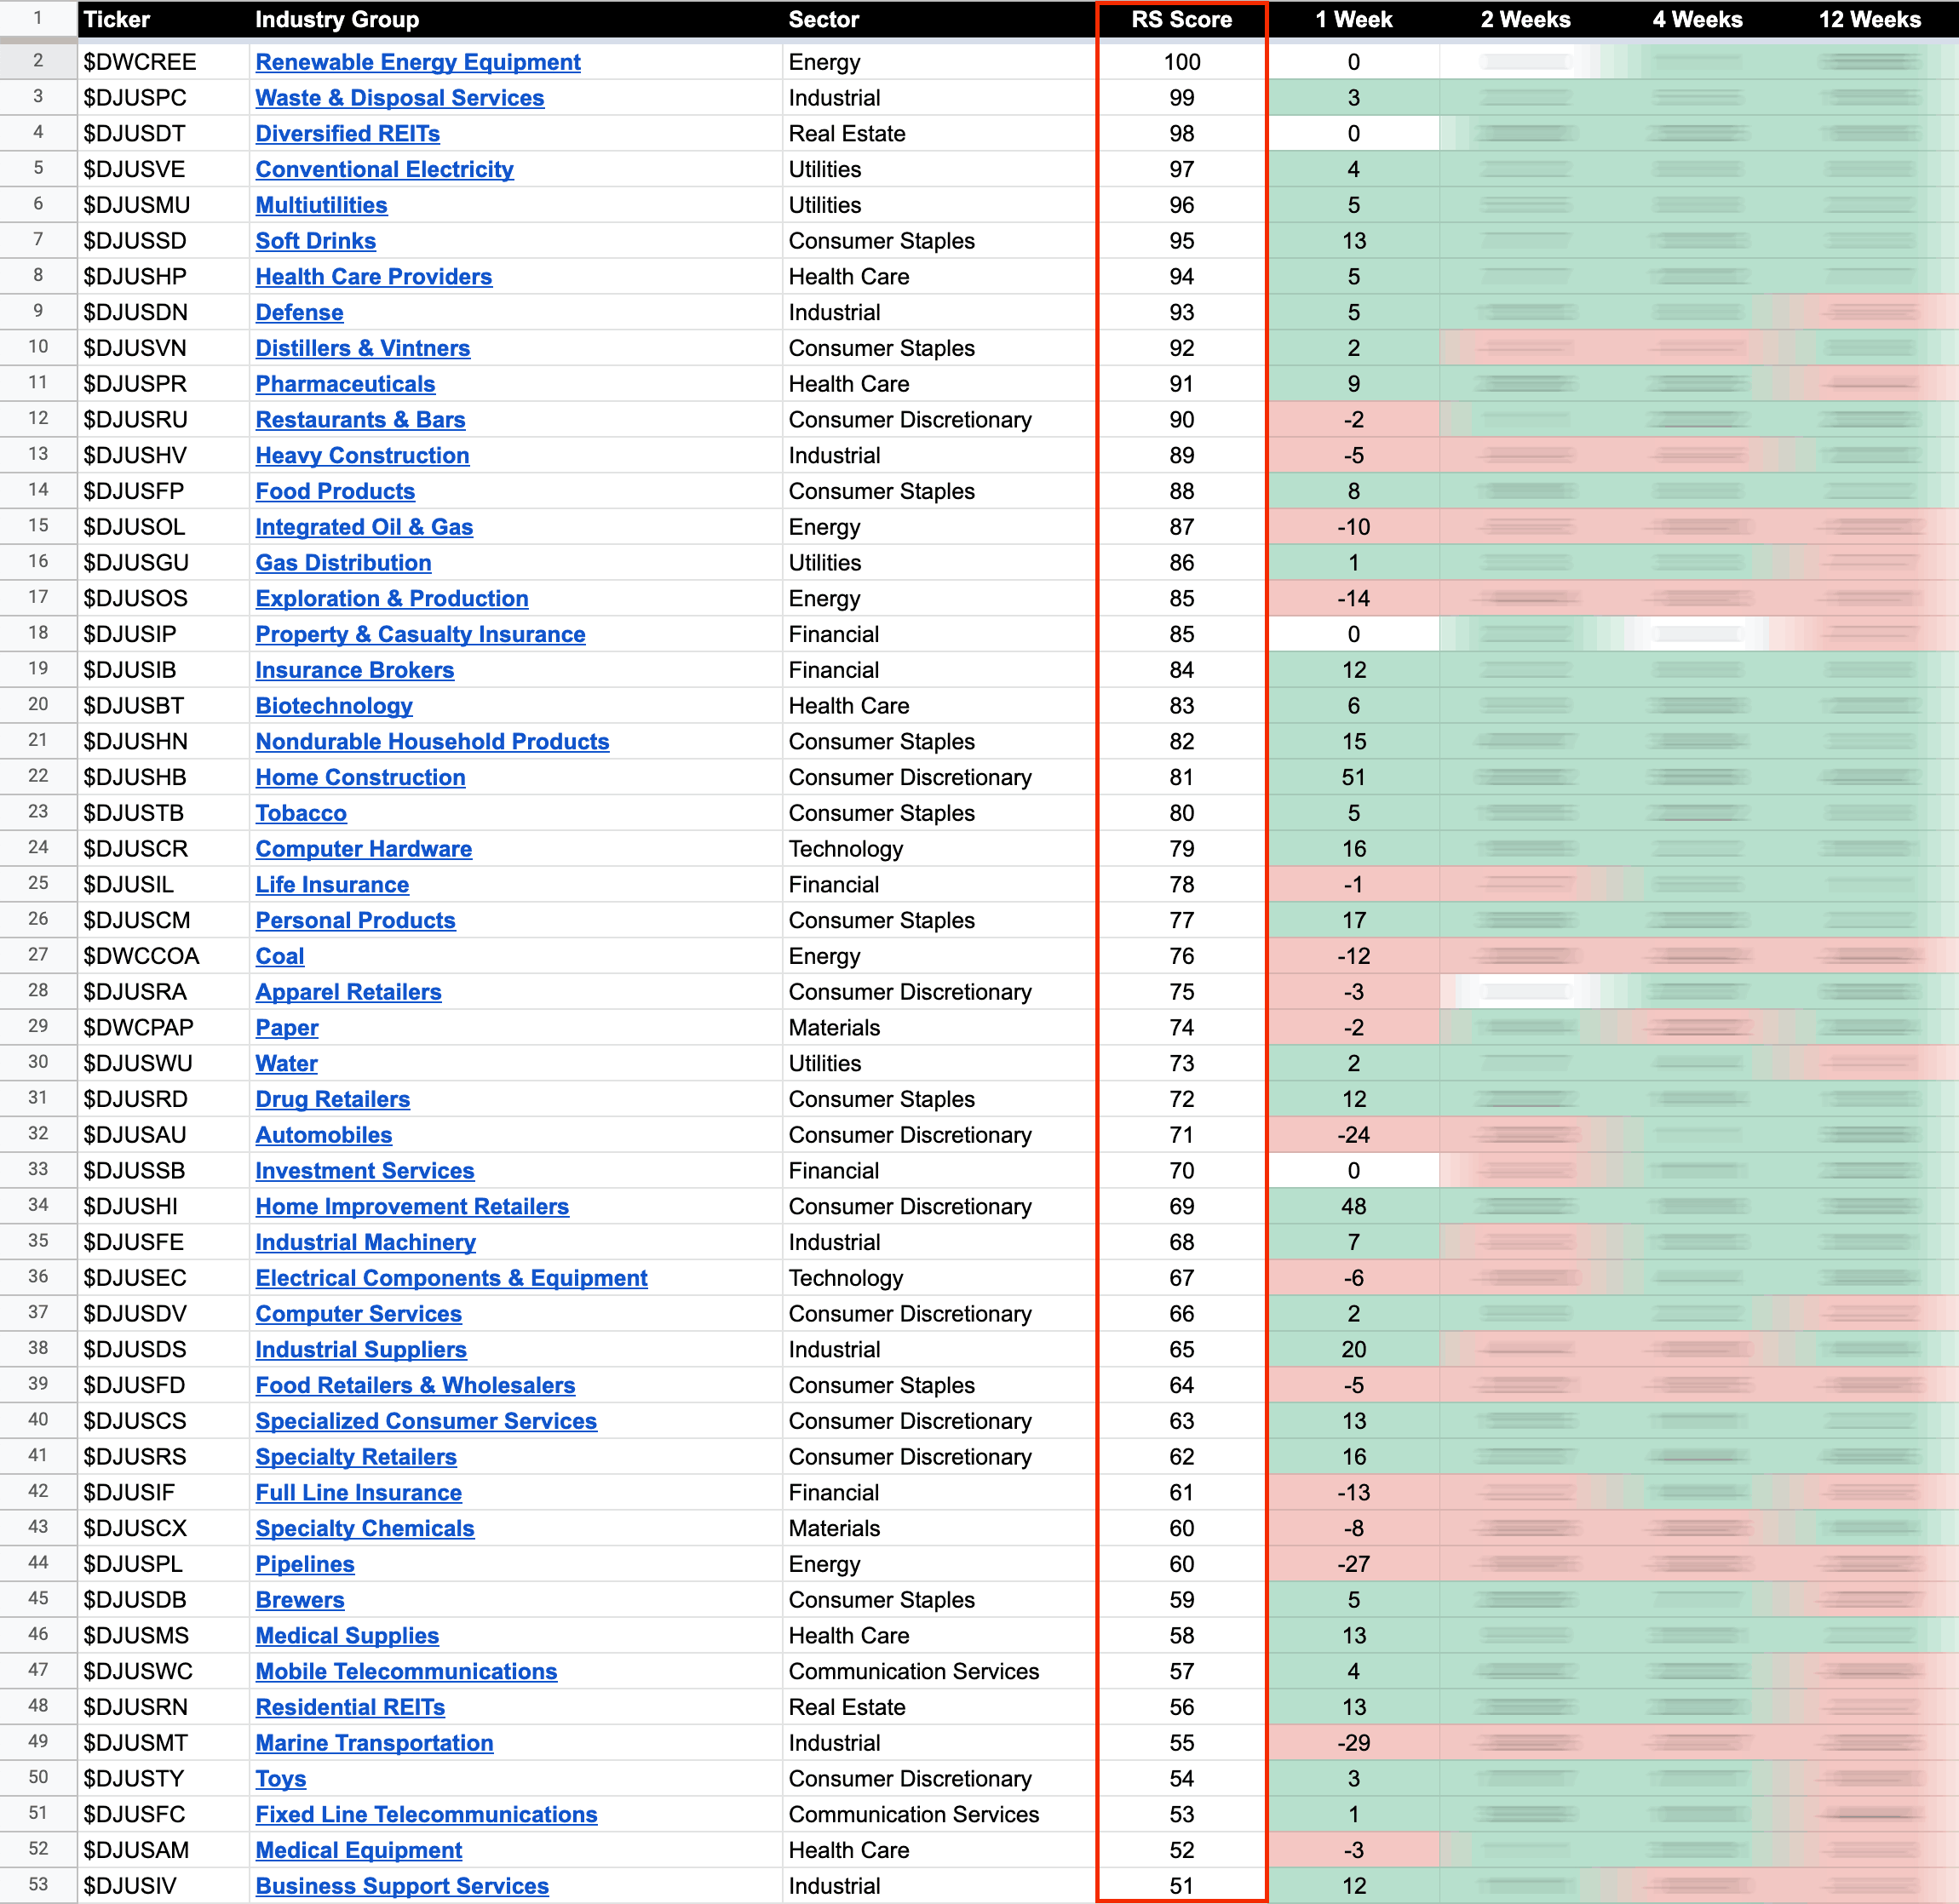
The purpose of the Relative Strength (RS) tables is to track the short, medium and long term RS changes of the individual groups to find the new leadership earlier than the crowd...
Read More
Blog
23 September, 2022
US Stocks Industry Groups Relative Strength Rankings
18 September, 2022
Stage Analysis Members Weekend Video – 18 September 2022 (1hr 14mins)
The regular members weekend video discussing the market, industry groups, market breadth and individual stocks from the watchlist...
Read More
18 September, 2022
IBD Industry Groups Bell Curve – Bullish Percent
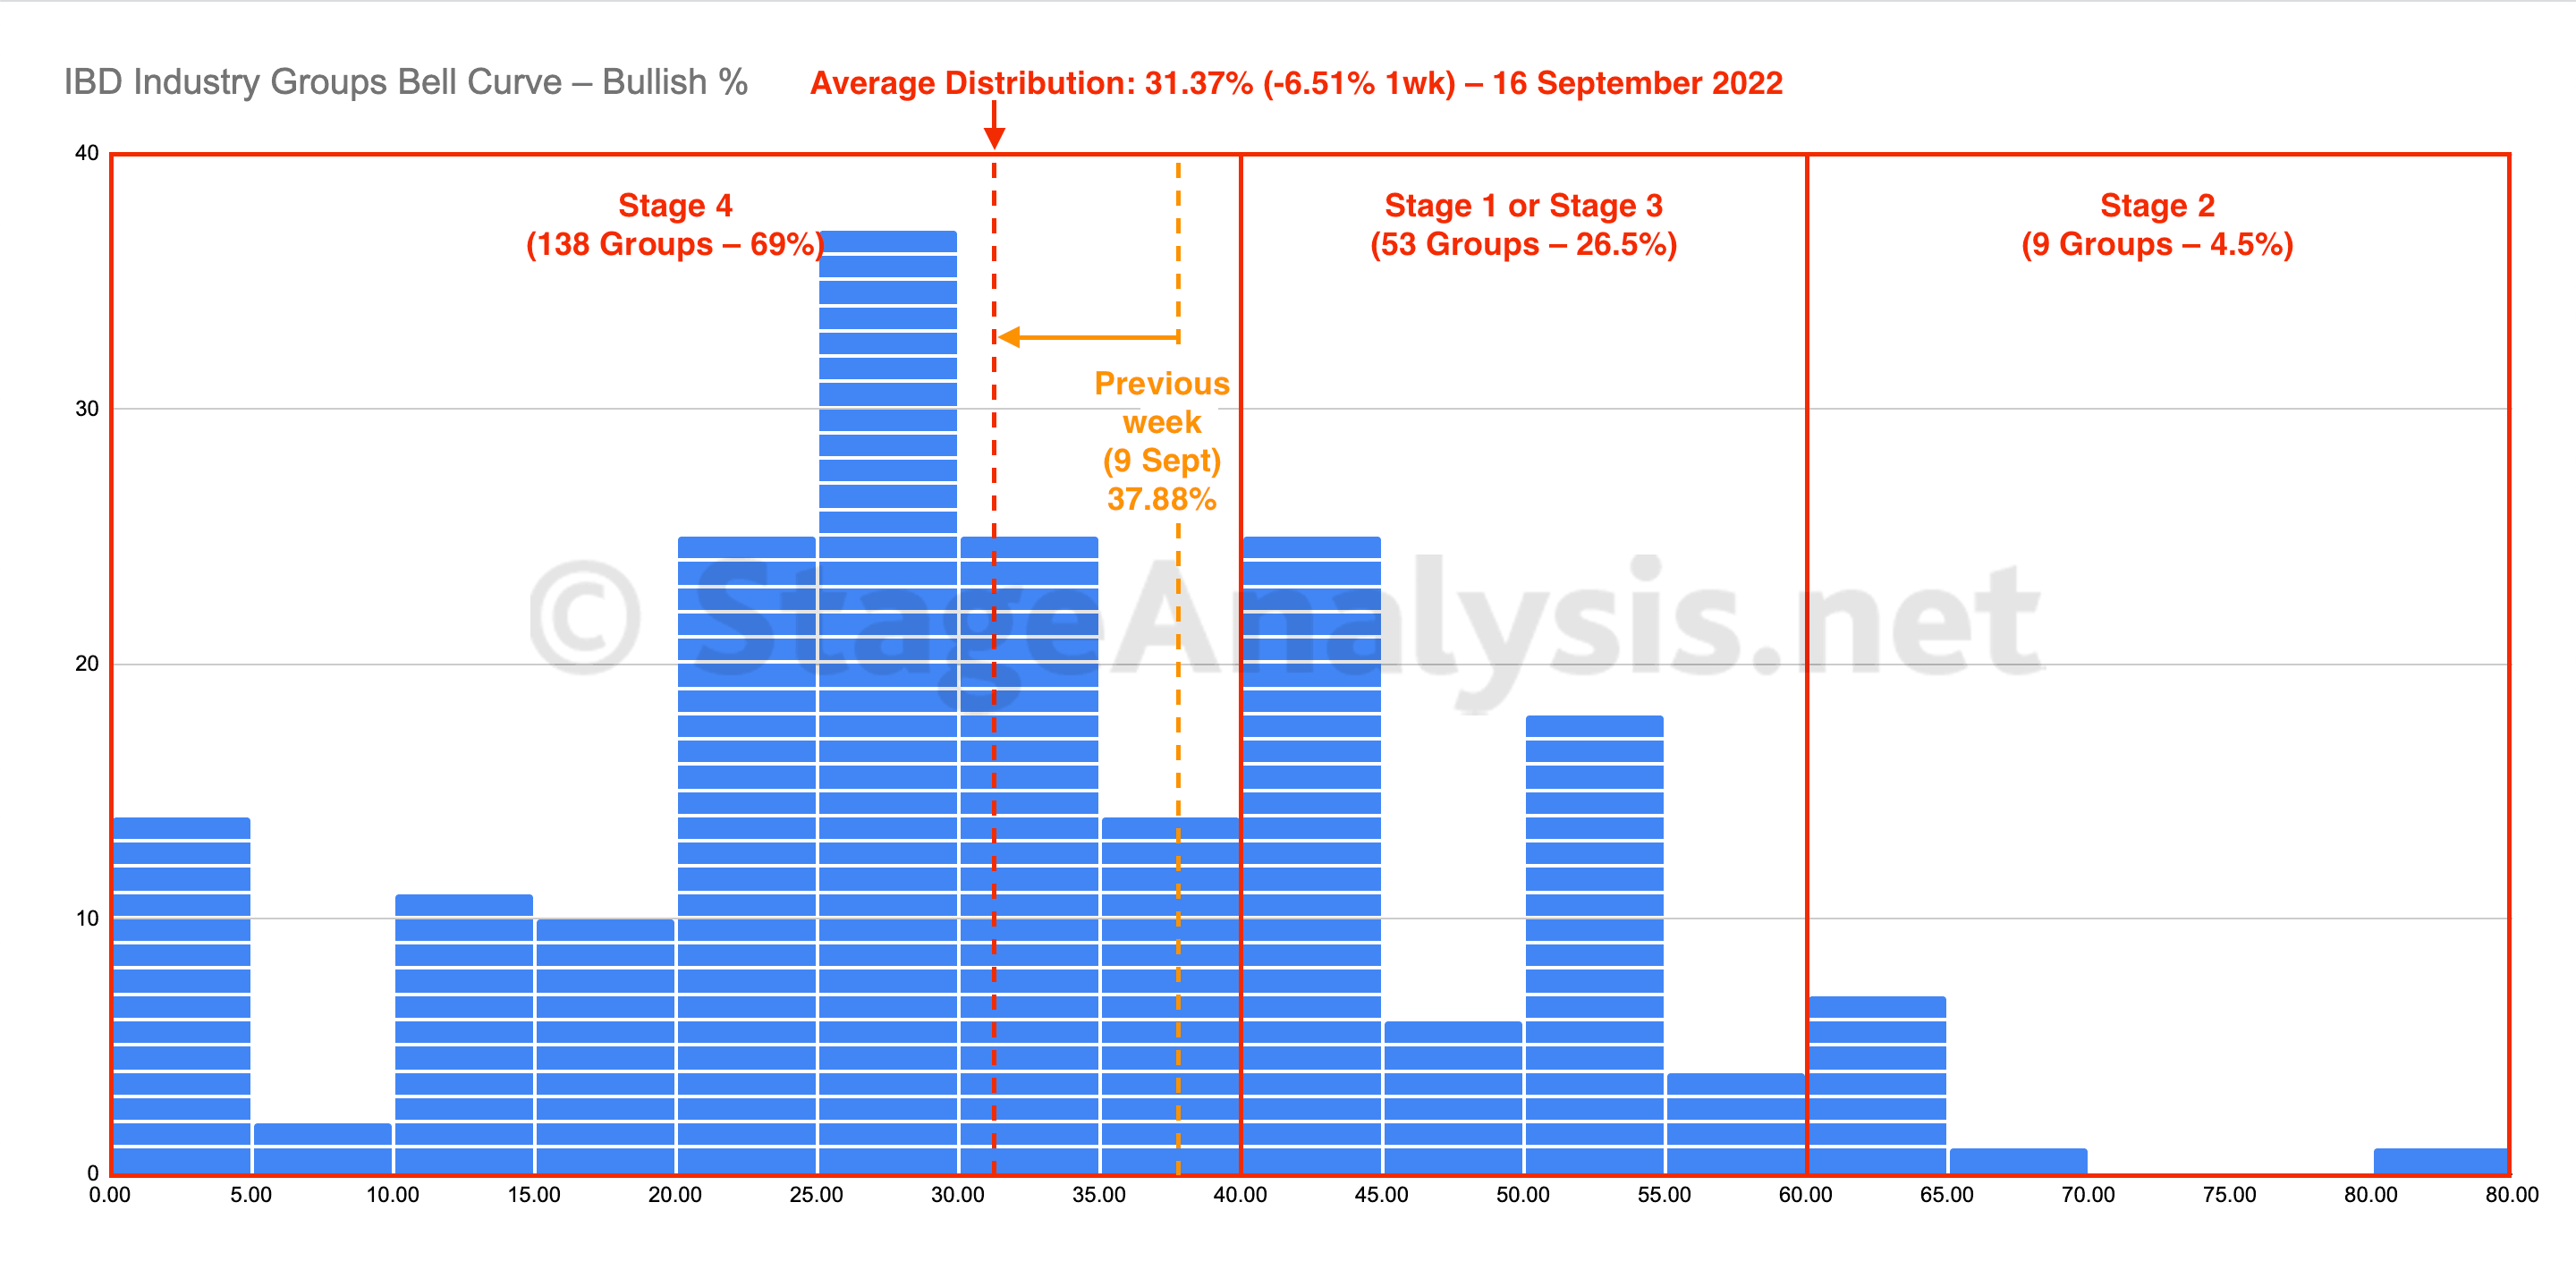
The IBD Industry Groups Bell Curve – Bullish Percent average distribution continued to decline this week, and finished the week at 31.37%, which is decline of -6.51%. So it has fallen deeper into the Stage 4 zone once more, with the majority of groups (69%) in the Stage 4 zone, and only 4.5% of the groups in the Stage 2 zone.
Read More
16 September, 2022
US Stocks Industry Groups Relative Strength Rankings
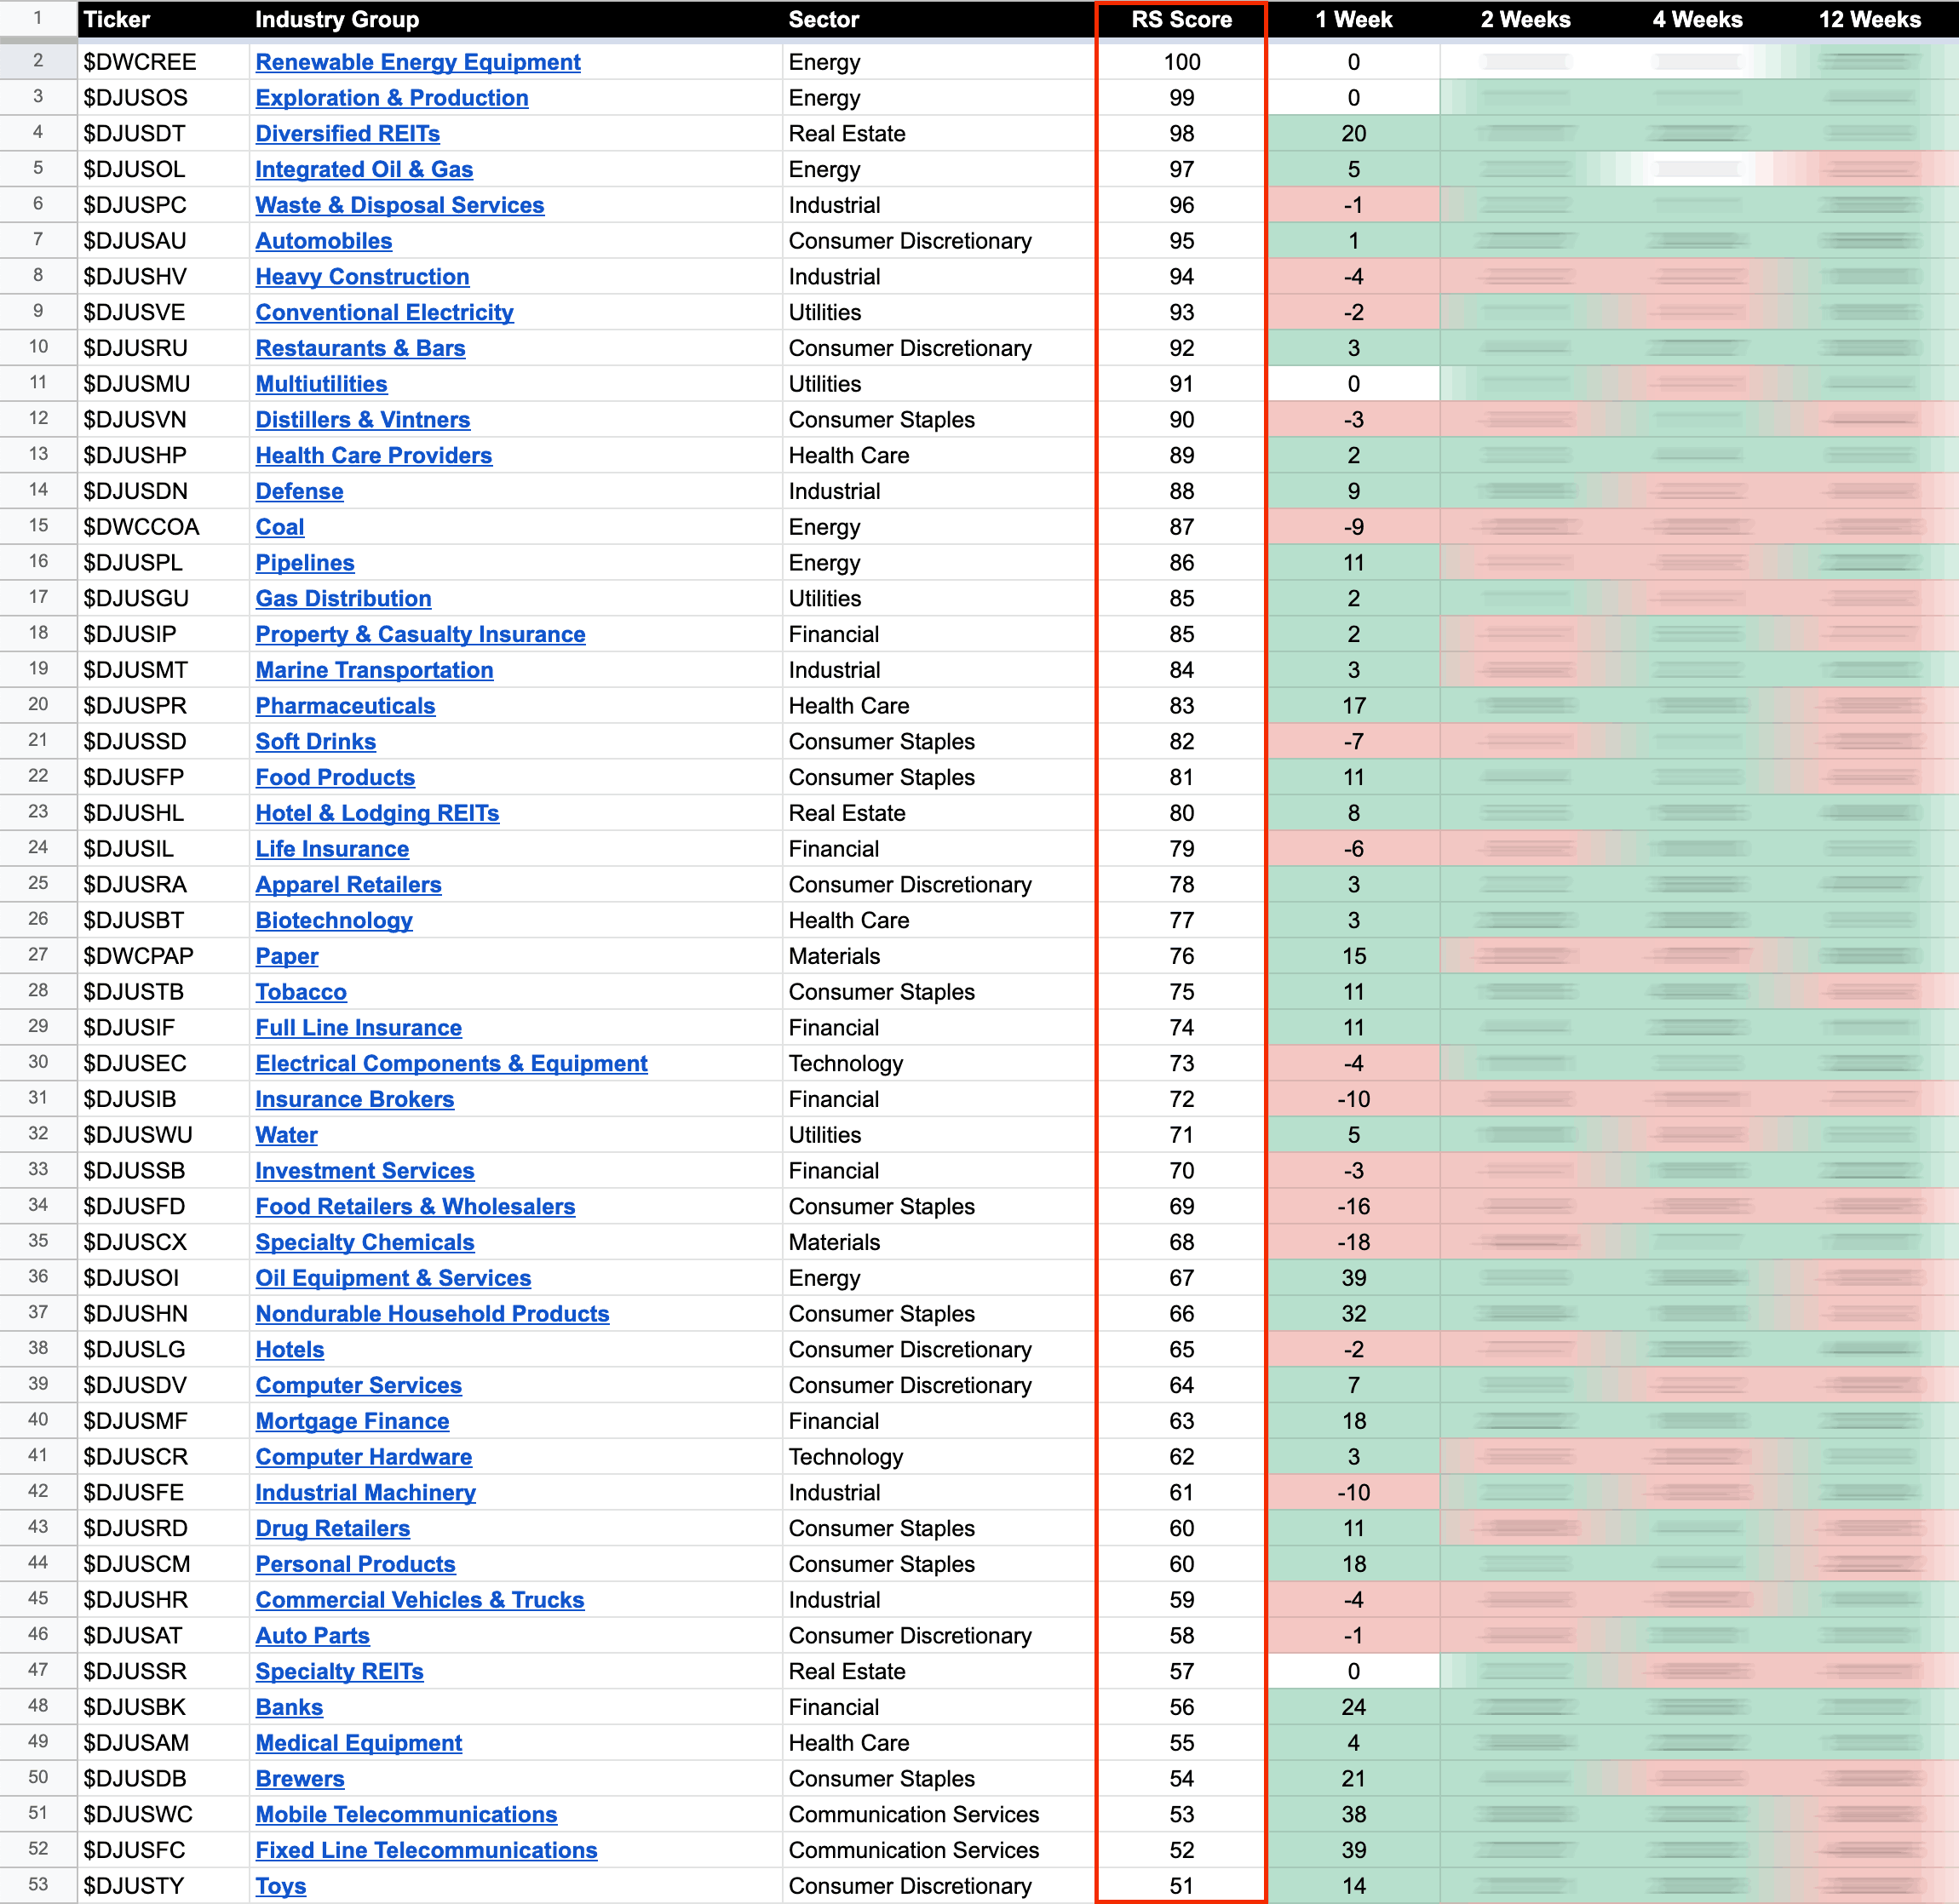
The purpose of the Relative Strength (RS) tables is to track the short, medium and long term RS changes of the individual groups to find the new leadership earlier than the crowd...
Read More
10 September, 2022
IBD Industry Groups Bell Curve – Bullish Percent
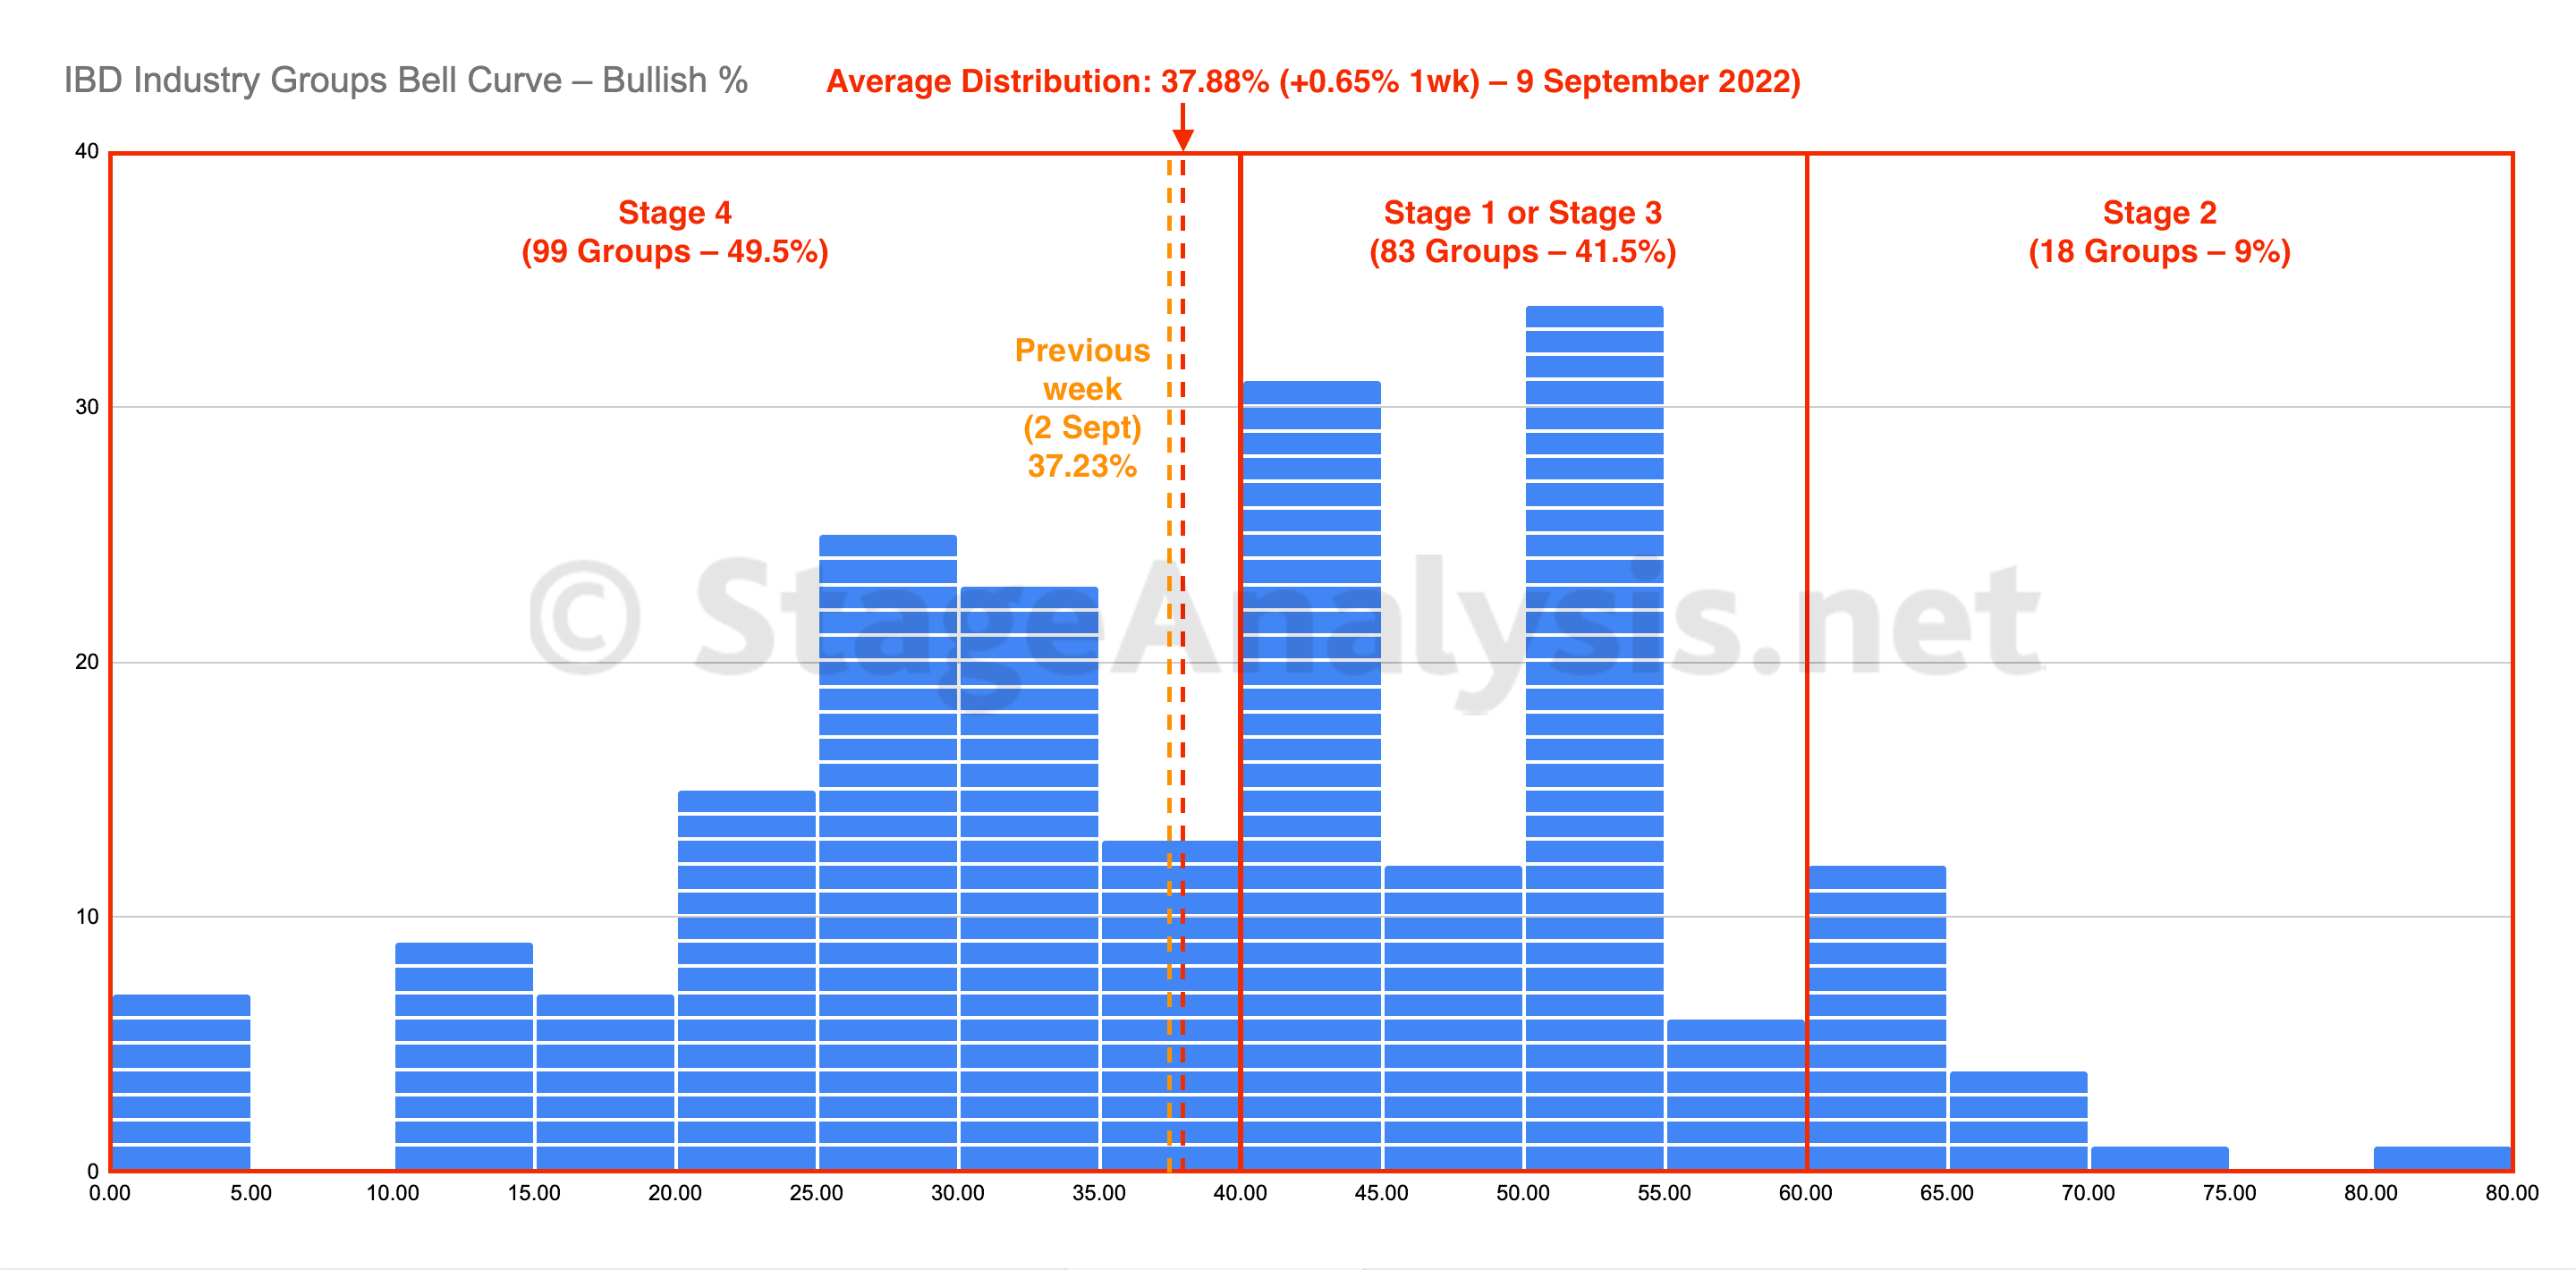
The IBD Industry Groups Bell Curve – Bullish Percent average distribution shifted slightly this week by +0.65% to finish the week at 37.88%. So it remains in the Stage 4 zone, but within a few percent of moving back into the Stage 1 zone if it continues to improve from here...
Read More
07 September, 2022
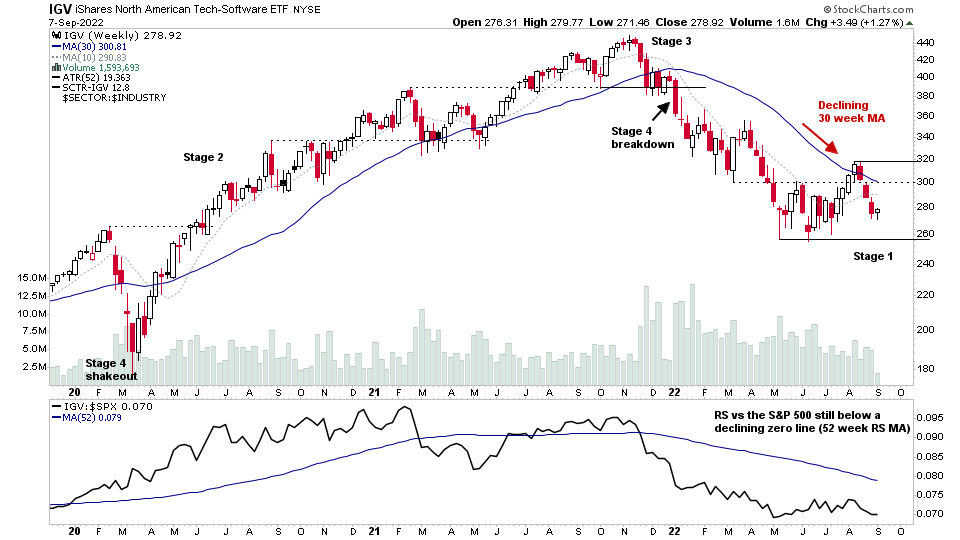
Video: Software Stocks Group Focus – Early Stage 2 Movers and Developing Stage 1 Bases – 7 September 2022 (1hr 8mins)
Today's video is a special feature following up on the Software group stocks progression over the last month since I last covered the group in early August: Video: Software Stocks Group Focus – Stage 1 Bases Proliferate – 10 August 2022, as at the time, numerous stocks within the group were showing signs of Stage 1 base structures developing.
Read More
04 September, 2022
Part 1 – Stage Analysis Members Weekend Video – 4 September 2022 (1hr 3mins)
Part 1 of the weekend video begins with an explanation of how to use the new SATA - Stage Analysis Technical Attributes Indicator. Followed by a look at a few of this weeks high volume Stage 2 breakout attempts. Then a rundown of the price action in the major US indexes and Industry Groups RS Rankings...
Read More
04 September, 2022
IBD Industry Groups Bell Curve – Bullish Percent
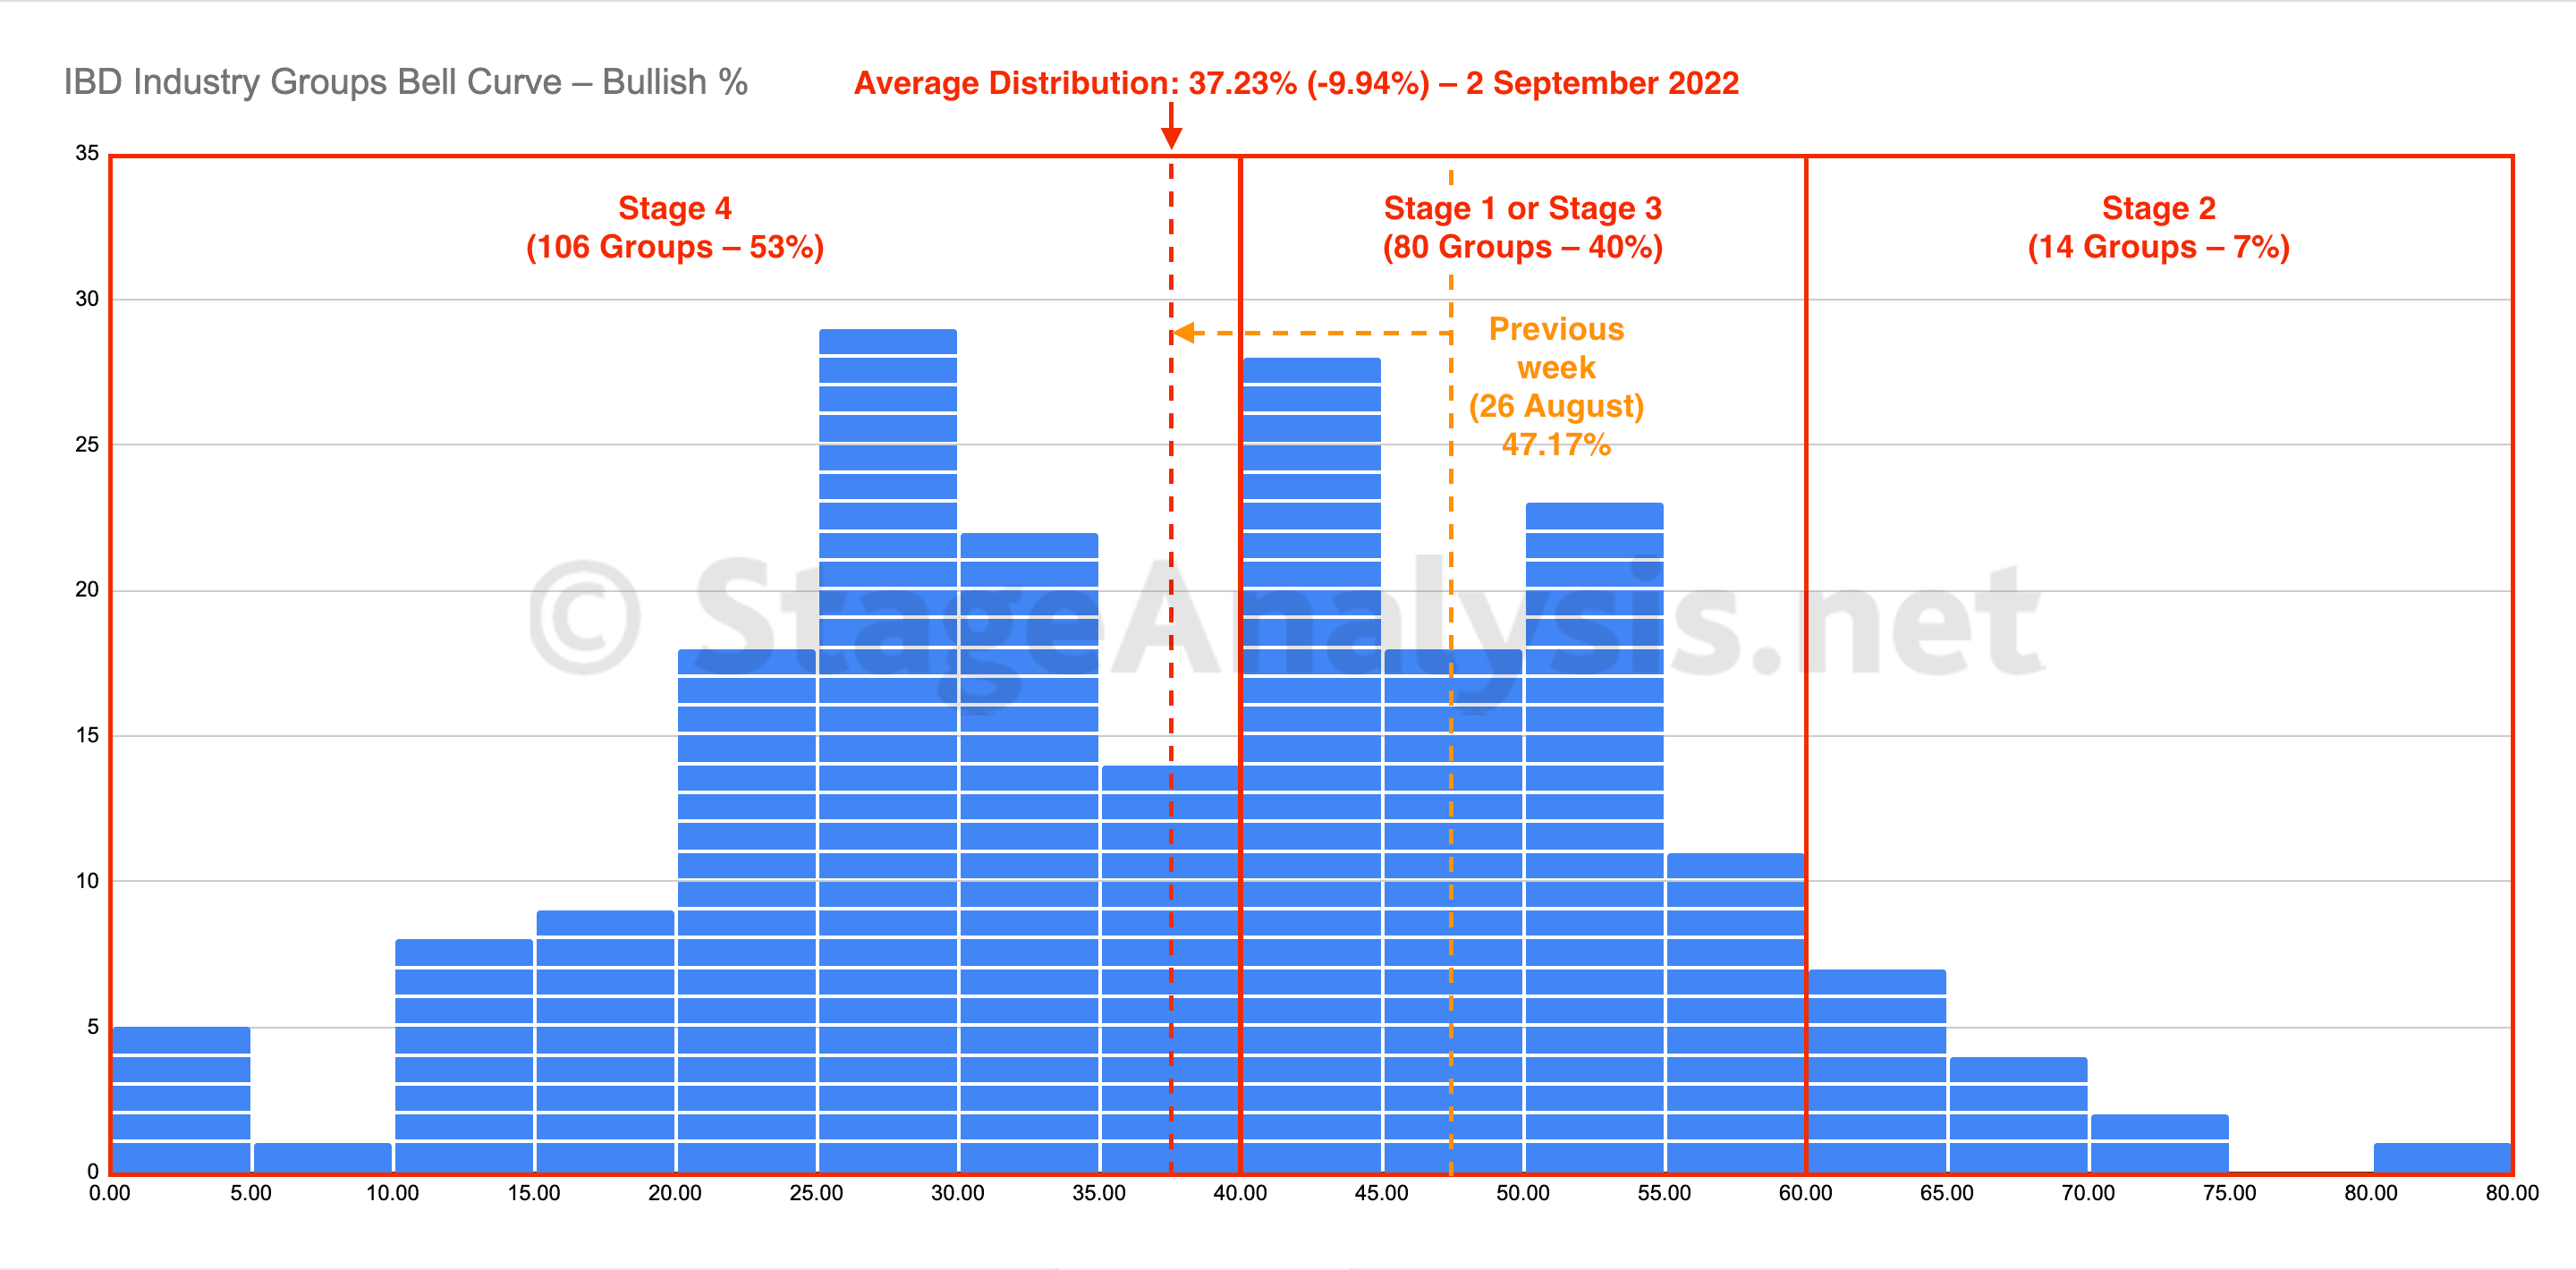
The IBD Industry Groups Bell Curve – Bullish Percent average distribution declined by a further -9.94% since the previous week, with an additional 34 groups dropping out of the Stage 2 zone and 46 groups dropping back into the Stage 4 zone. Hence the majority of groups (106 out of 200) are now in the Stage 4 zone...
Read More
31 August, 2022
Stage Analysis Members Midweek Video – 31 August 2022 (1hr 6mins)
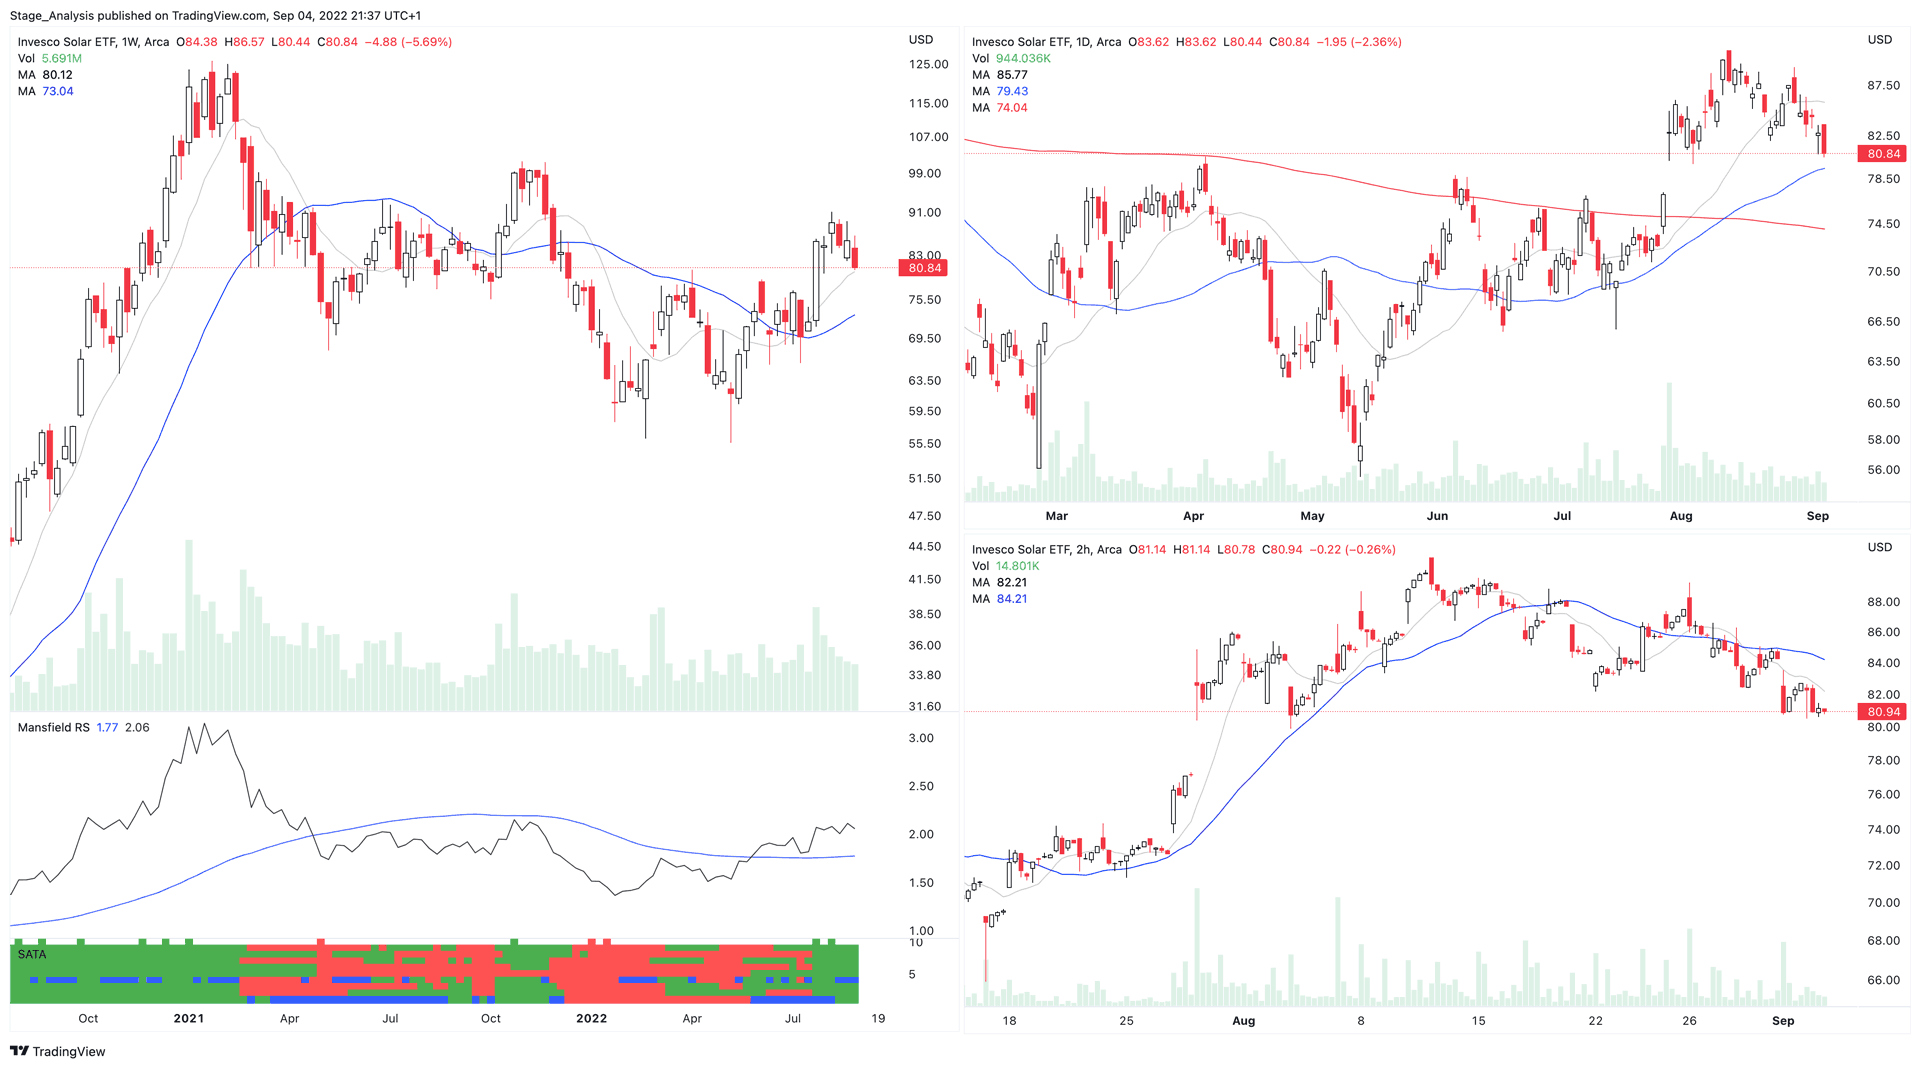
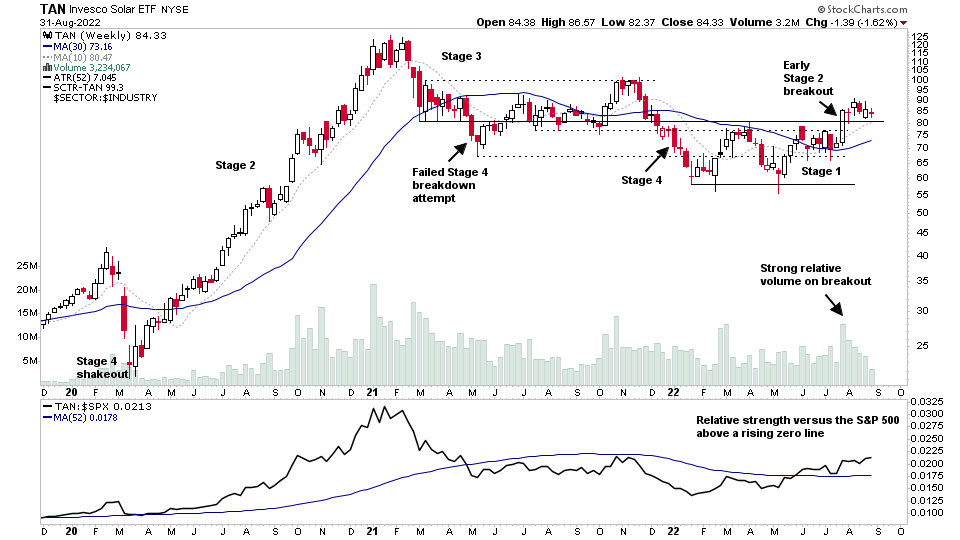
The Stage Analysis Members midweek video begins with a special group focus on the leading Renewable Energy stocks including TAN, ENPH, FSLR, ARRY, CSIQ, MAXN and others from the group...
Read More
28 August, 2022
Stage Analysis Members Weekend Video – 28 August 2022 (1hr 32mins)
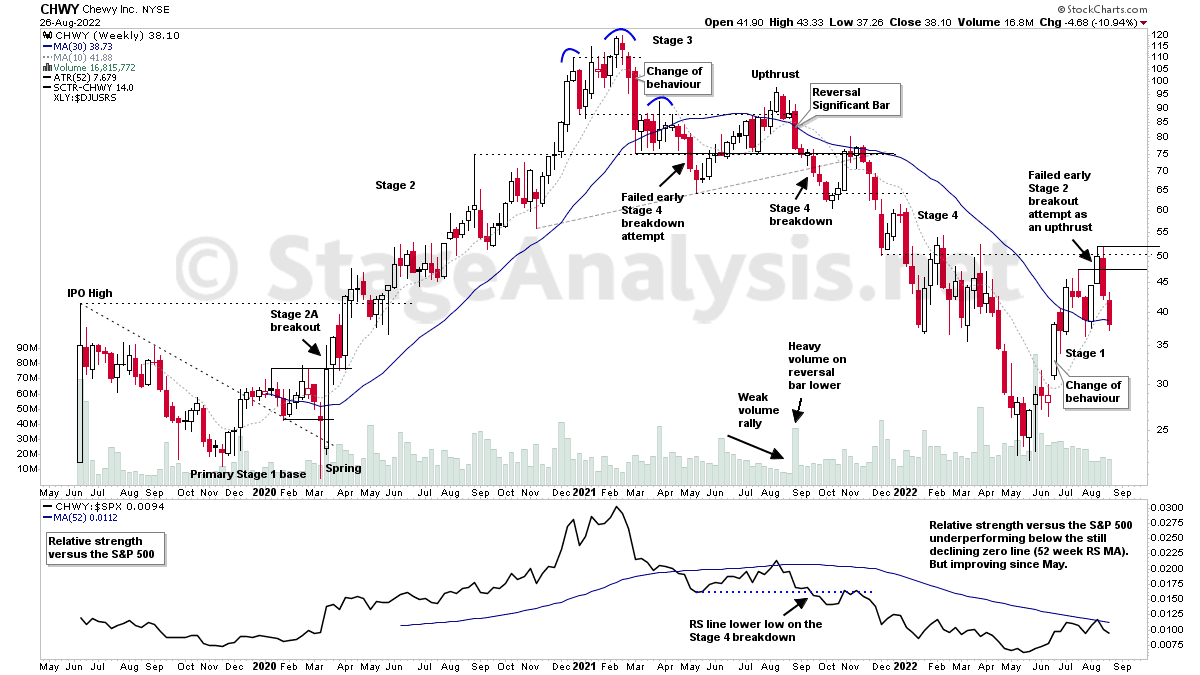
This weekends videos begins with an educational feature on the full Stage Analysis cycle from Stan Weinstein's method, discussing the entire four stages since the IPO in CHWY, and the multiple failed attempts to change Stage that is often seen. As real life is not like the textbooks...
Read More

