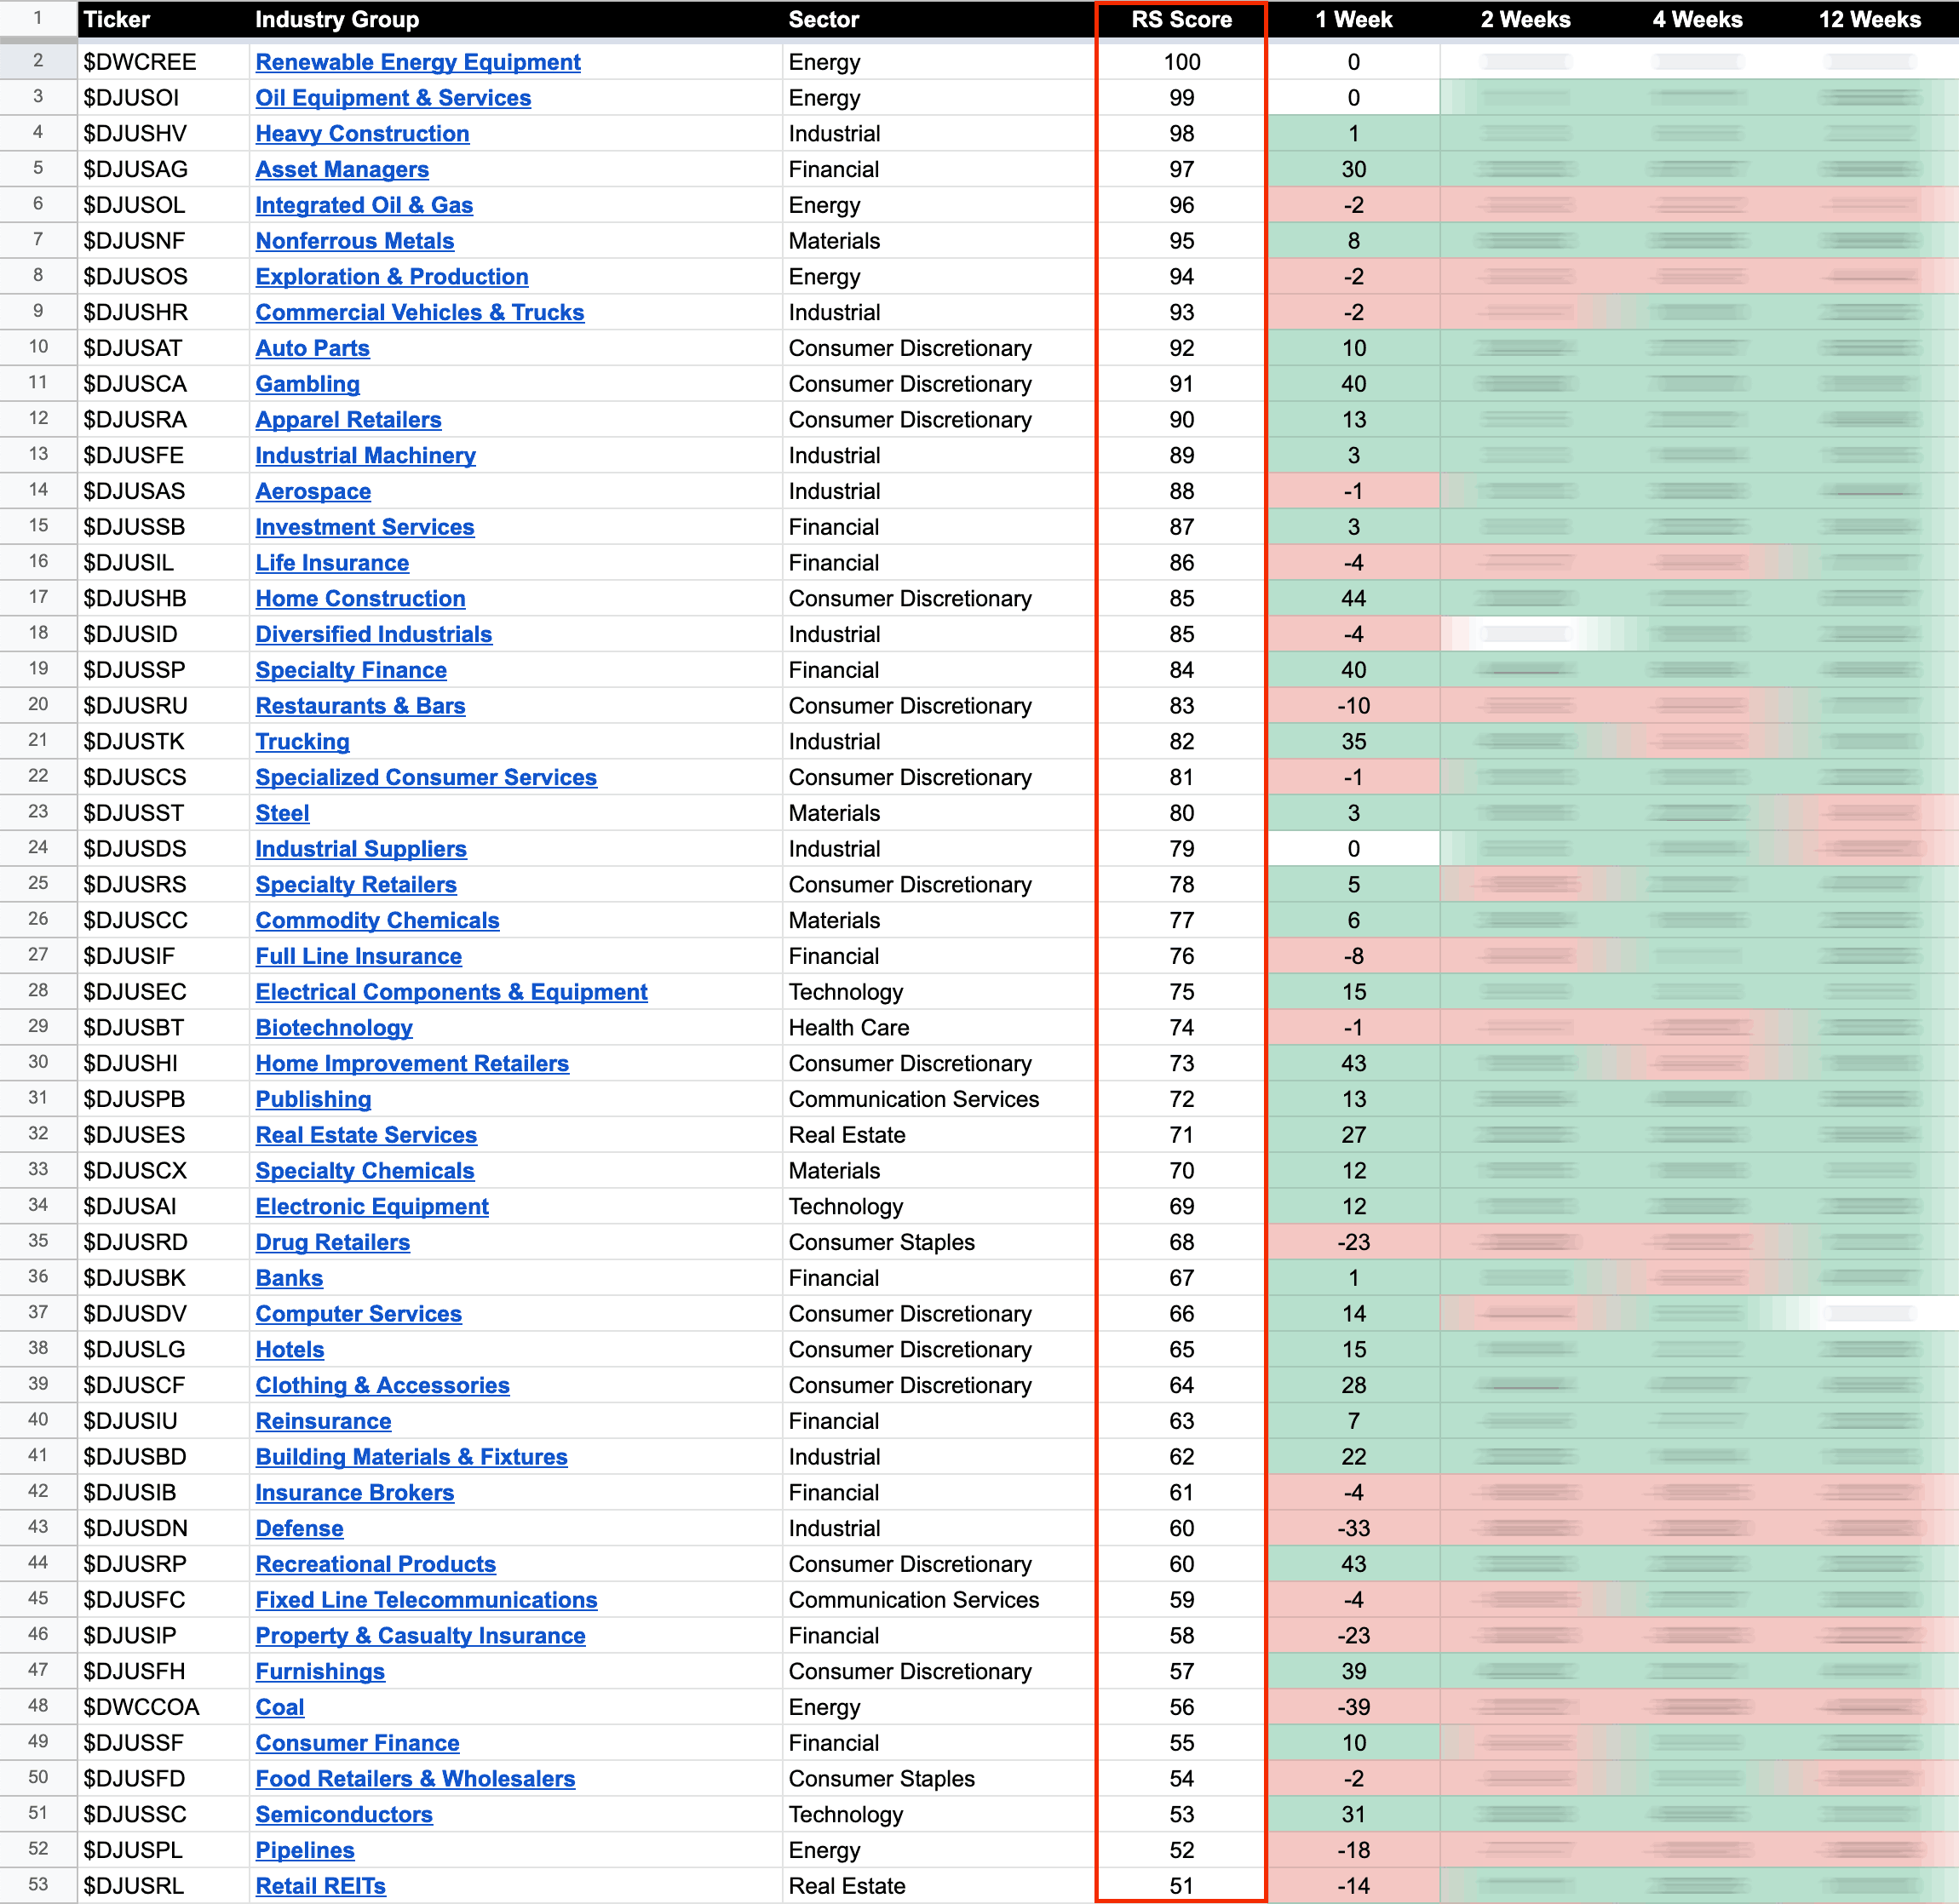
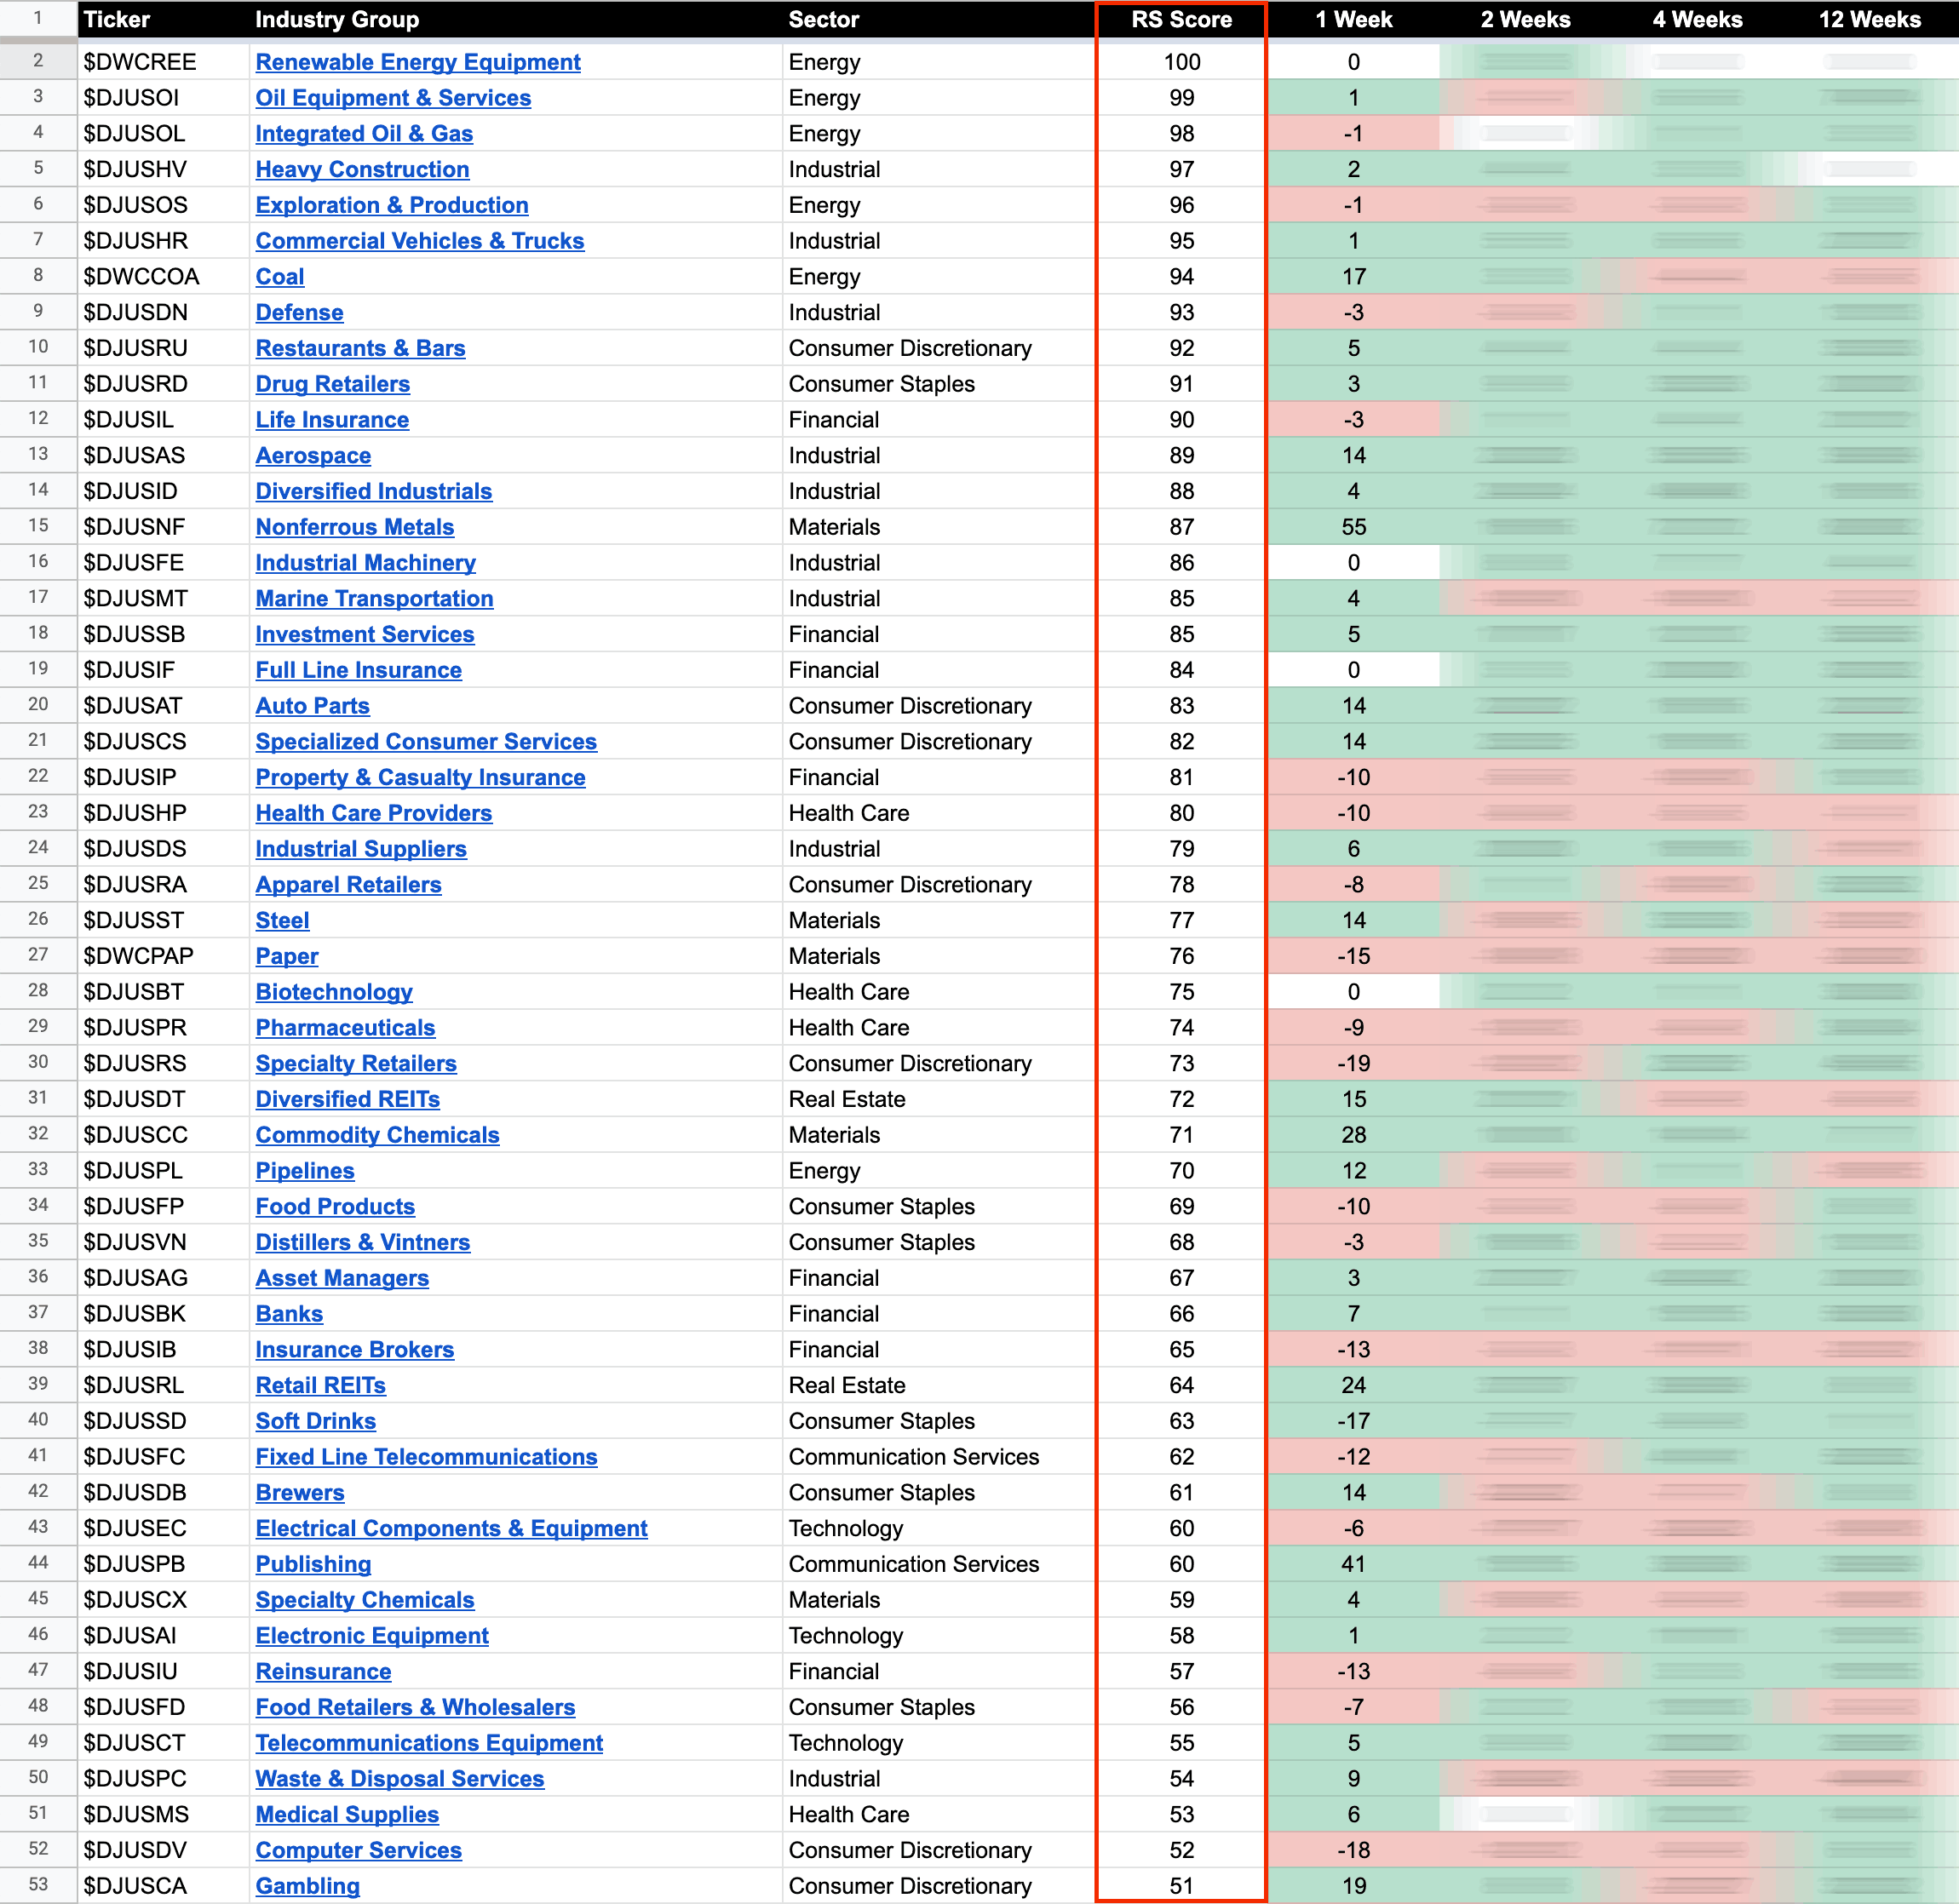
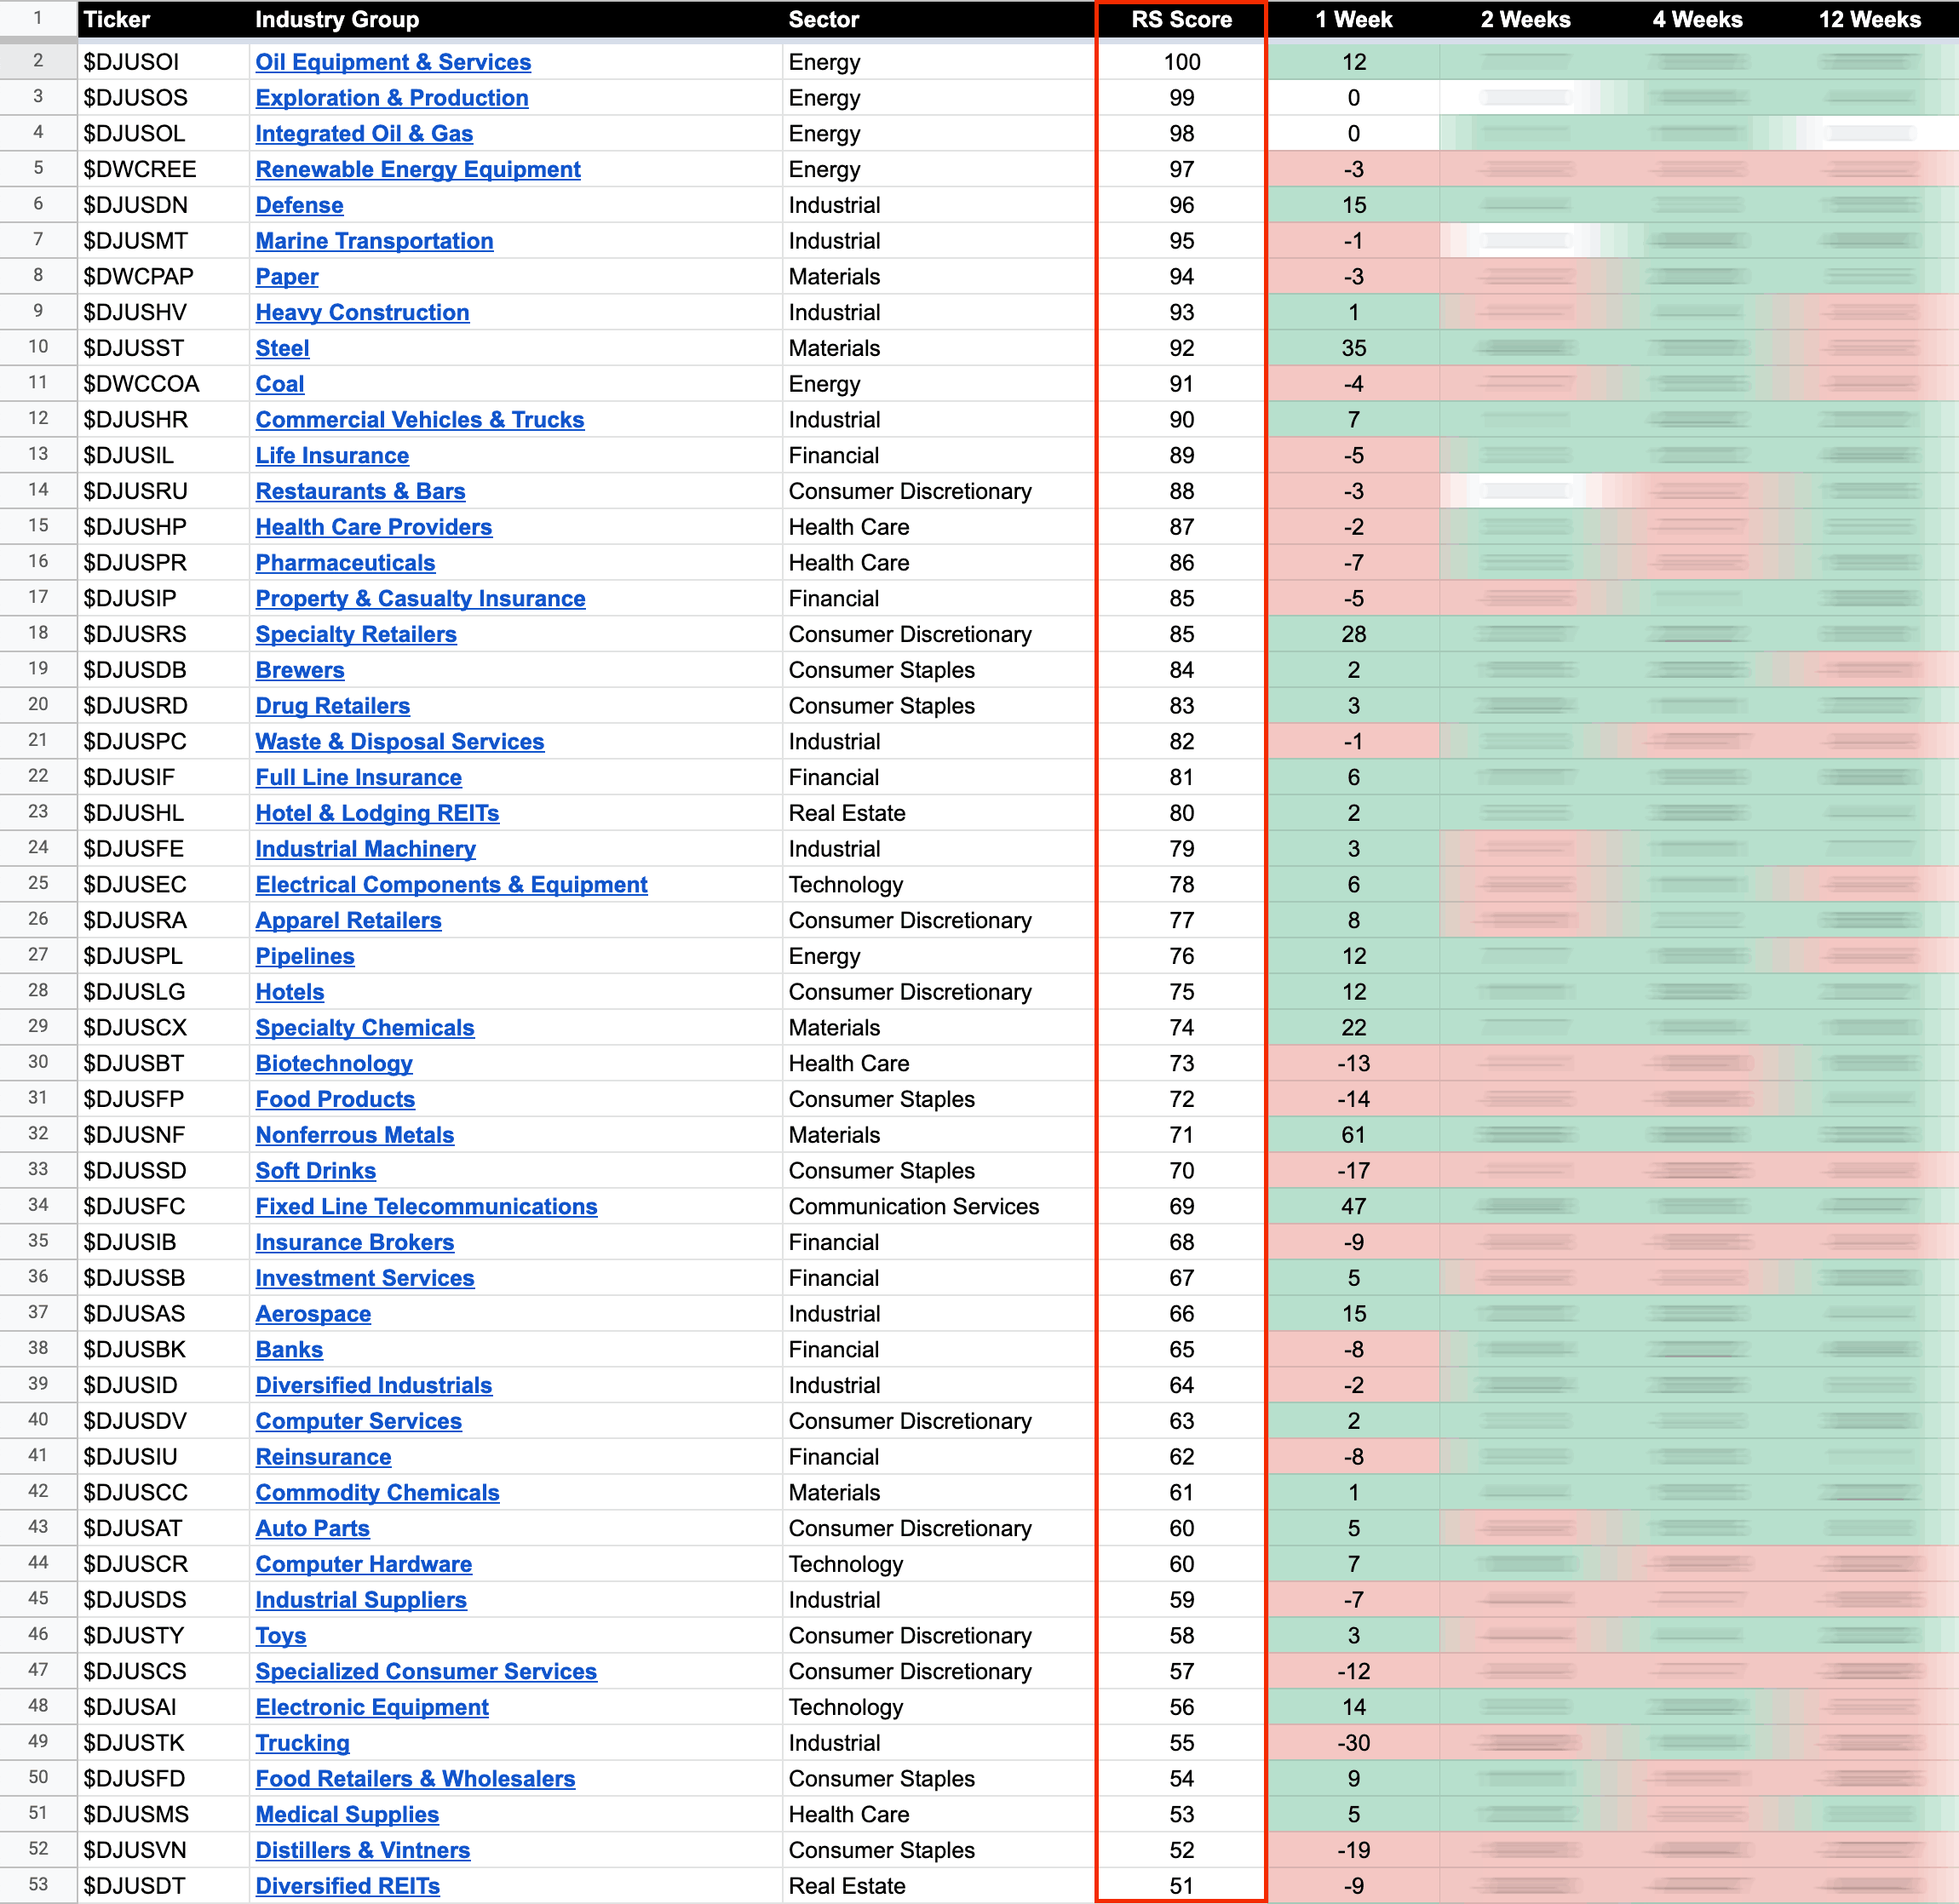
The purpose of the Relative Strength (RS) tables is to track the short, medium and long term RS changes of the individual groups to find the new leadership earlier than the crowd...
Read More
Blog
12 November, 2022
US Stocks Industry Groups Relative Strength Rankings
06 November, 2022
Stage Analysis Members Video Part 1 – 6 November 2022 (59mins)
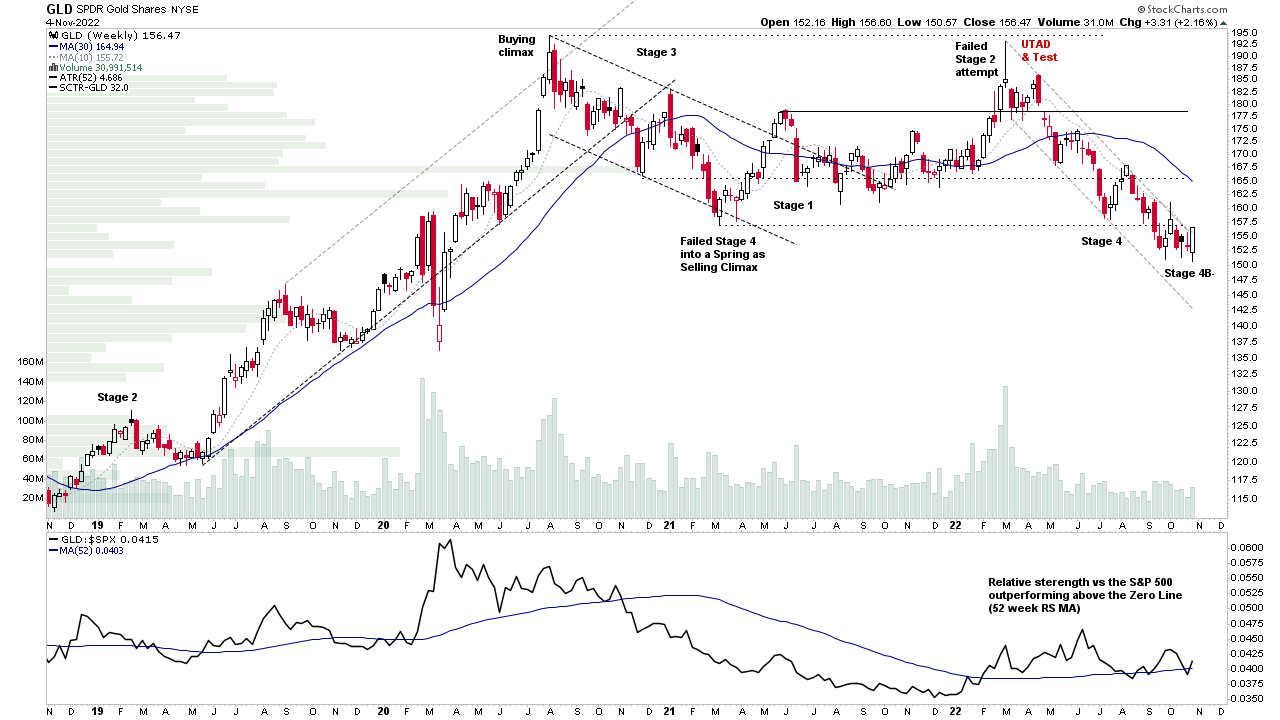
Part 1 of the regular members weekend video beginning with a special focus on Gold and Silver, and the Gold Miners group. Following that we discuss the Stage Analysis of the Major Indexes, and the Industry Groups Relative Strength Rankings, with a look in more depth of some of the groups making the strongest moves. Plus a look at the IBD Industry Groups Bell Curve – Bullish Percent and finally the Market Breadth Update to help to determine the current Weight of Evidence.
Read More
05 November, 2022
IBD Industry Groups Bell Curve – Bullish Percent
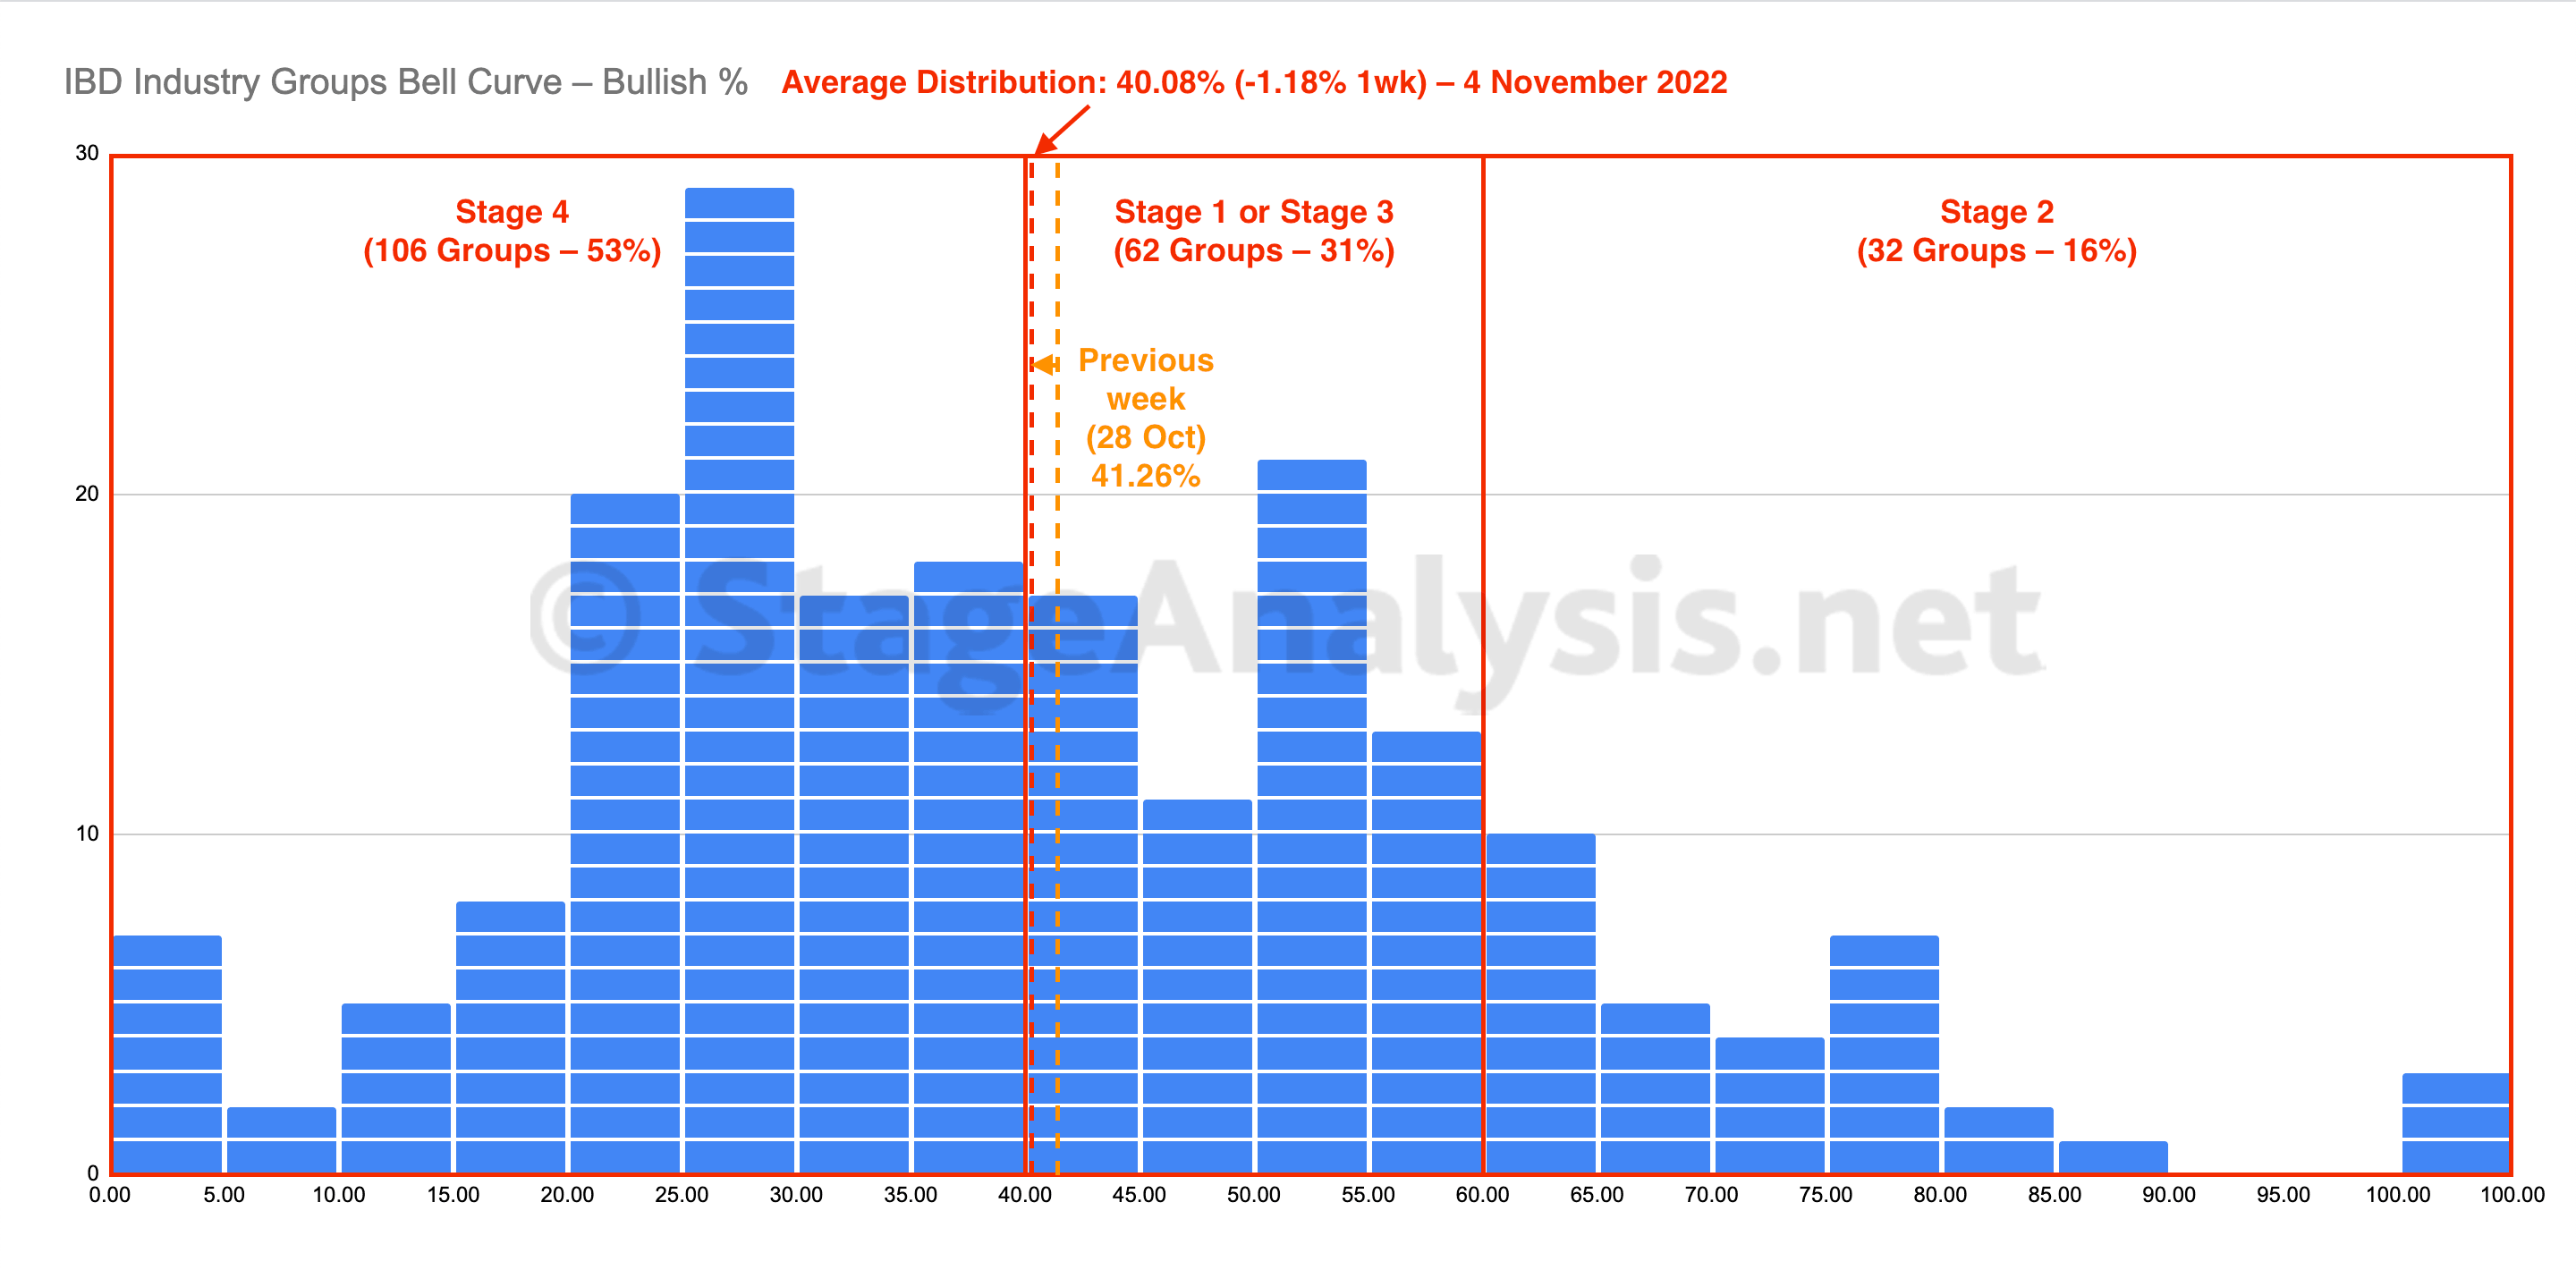
The IBD Industry Groups Bell Curve – Bullish Percent declined slightly over the last week by -1.18% to end the week at 40.08%. So the average distribution remains in the neutral Stage 1 zone in the left of middle of the bell curve...
Read More
04 November, 2022
US Stocks Industry Groups Relative Strength Rankings
The purpose of the Relative Strength (RS) tables is to track the short, medium and long term RS changes of the individual groups to find the new leadership earlier than the crowd...
Read More
30 October, 2022
Stage Analysis Members Video Part 2 – US Market Review – 30 October 2022 (28 mins)
Part 2 of the regular members weekend video discussing the market, industry groups and market breadth to determine the weight of evidence.
Read More
29 October, 2022
IBD Industry Groups Bell Curve – Bullish Percent
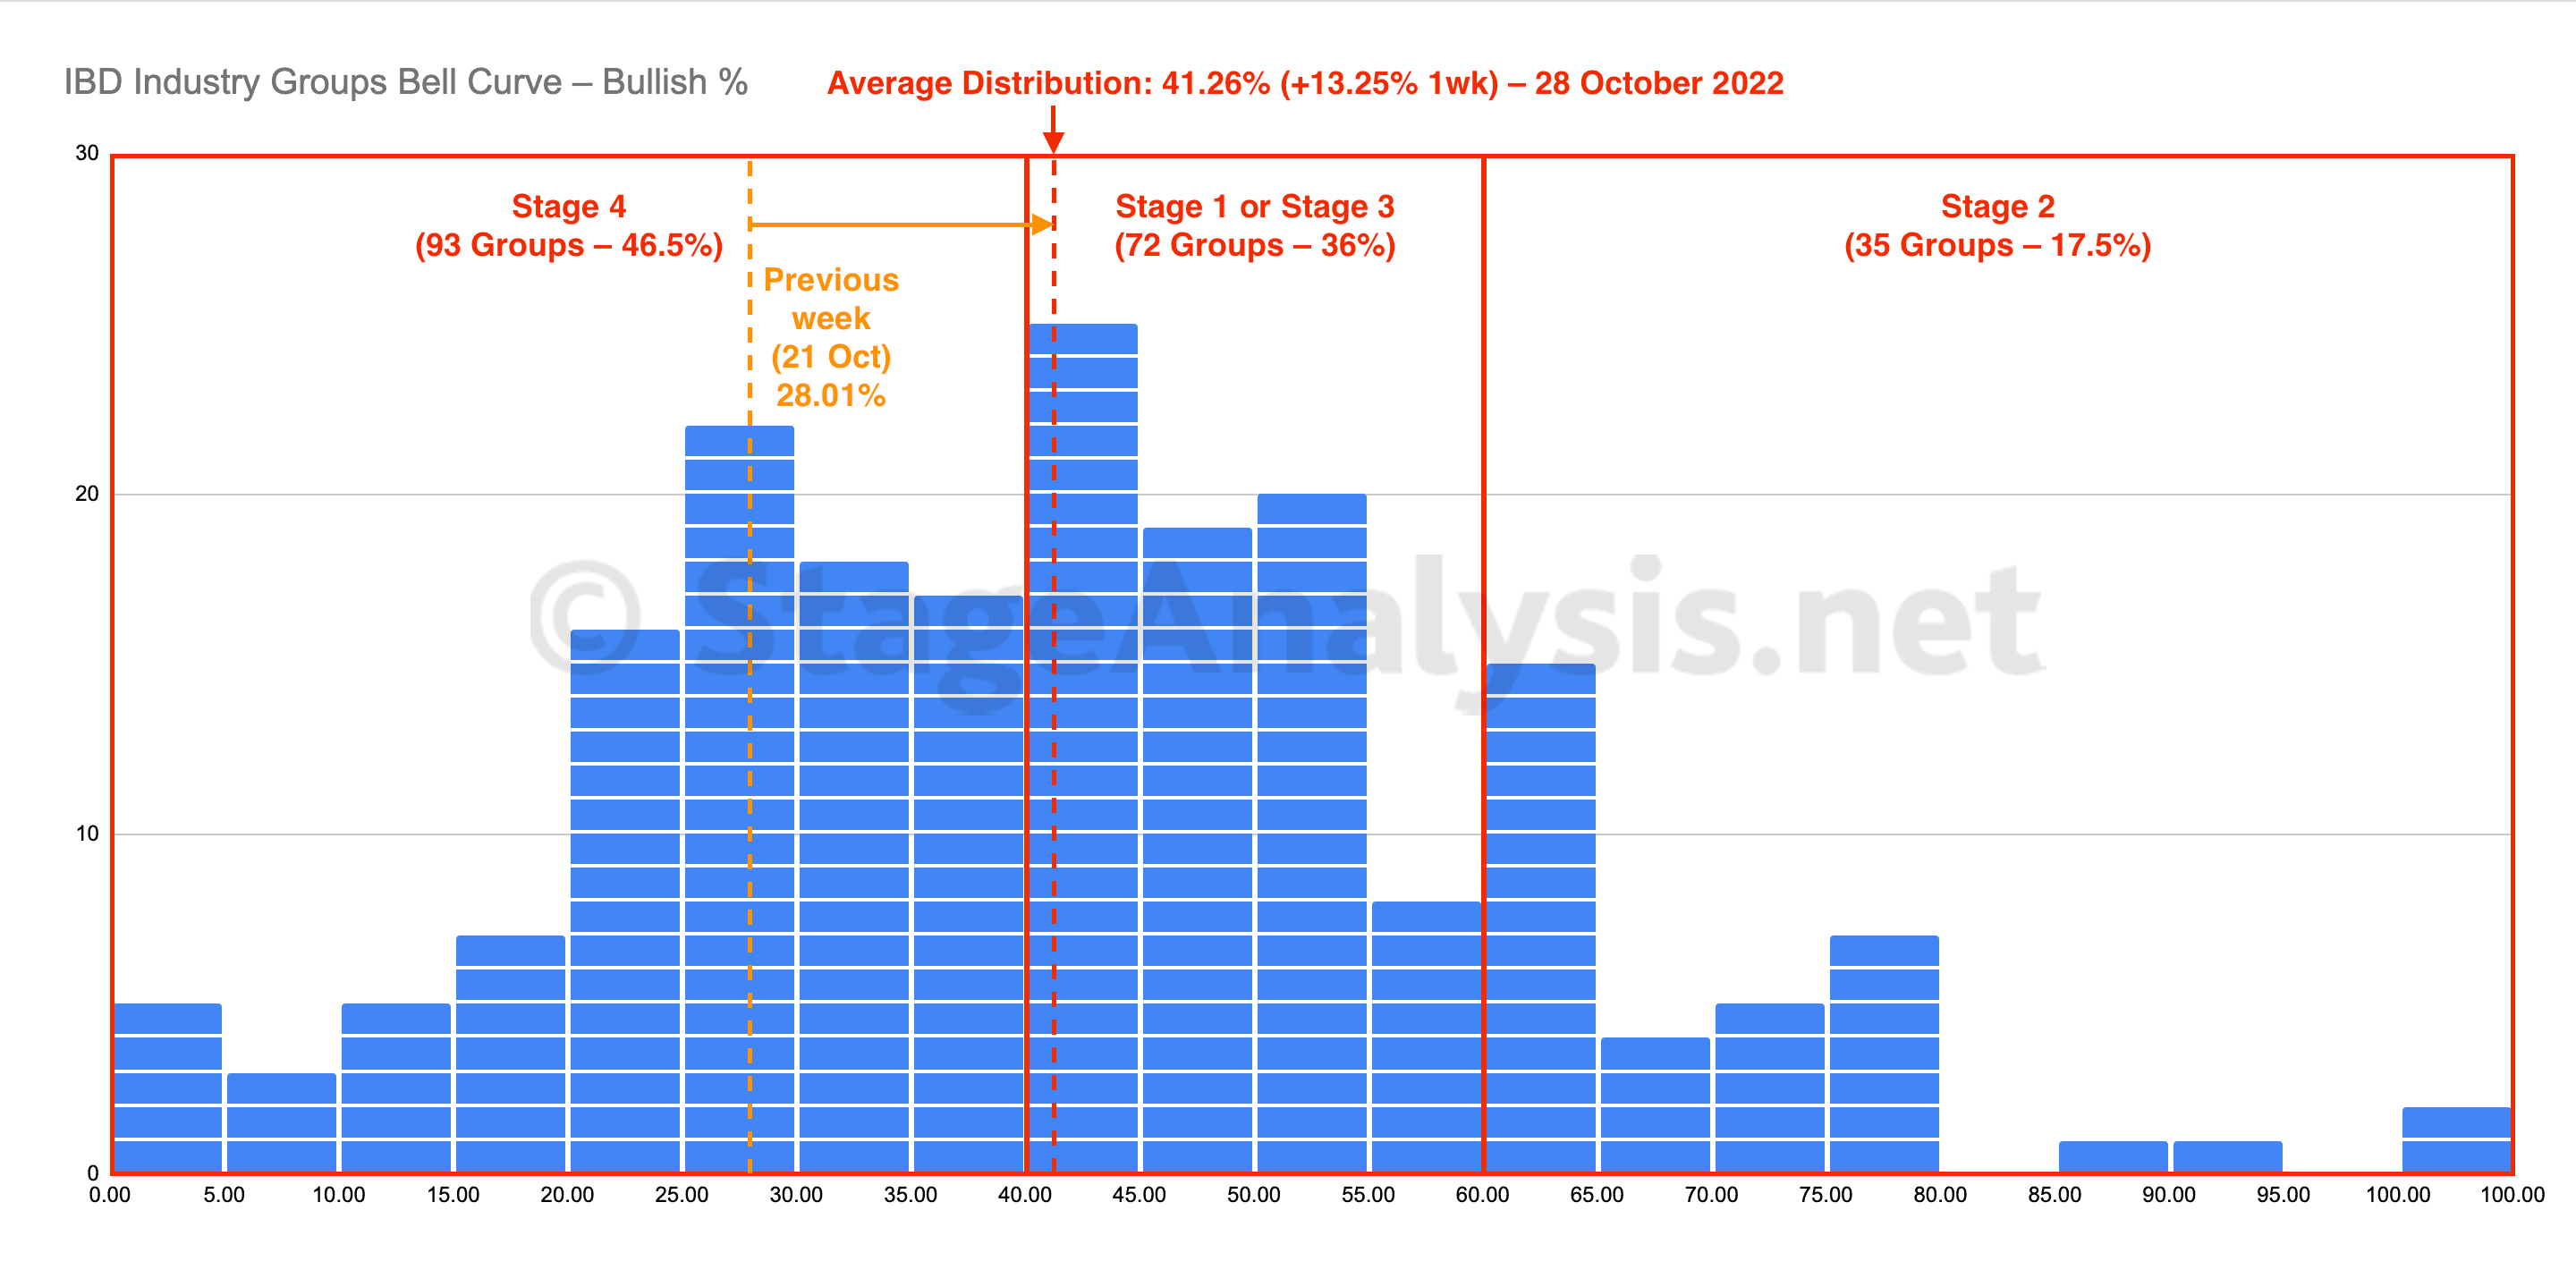
The IBD Industry Groups Bell Curve – Bullish Percent moved strongly higher over the last week with a +13.25% improvement, with 57 Groups (-28.5%) moving out of the Stage 4 zone, and 34 Groups (+17%) moved into the Stage 1 zone, and 23 Groups (+11.5%) moved into the Stage 2 zone...
Read More
28 October, 2022
US Stocks Industry Groups Relative Strength Rankings
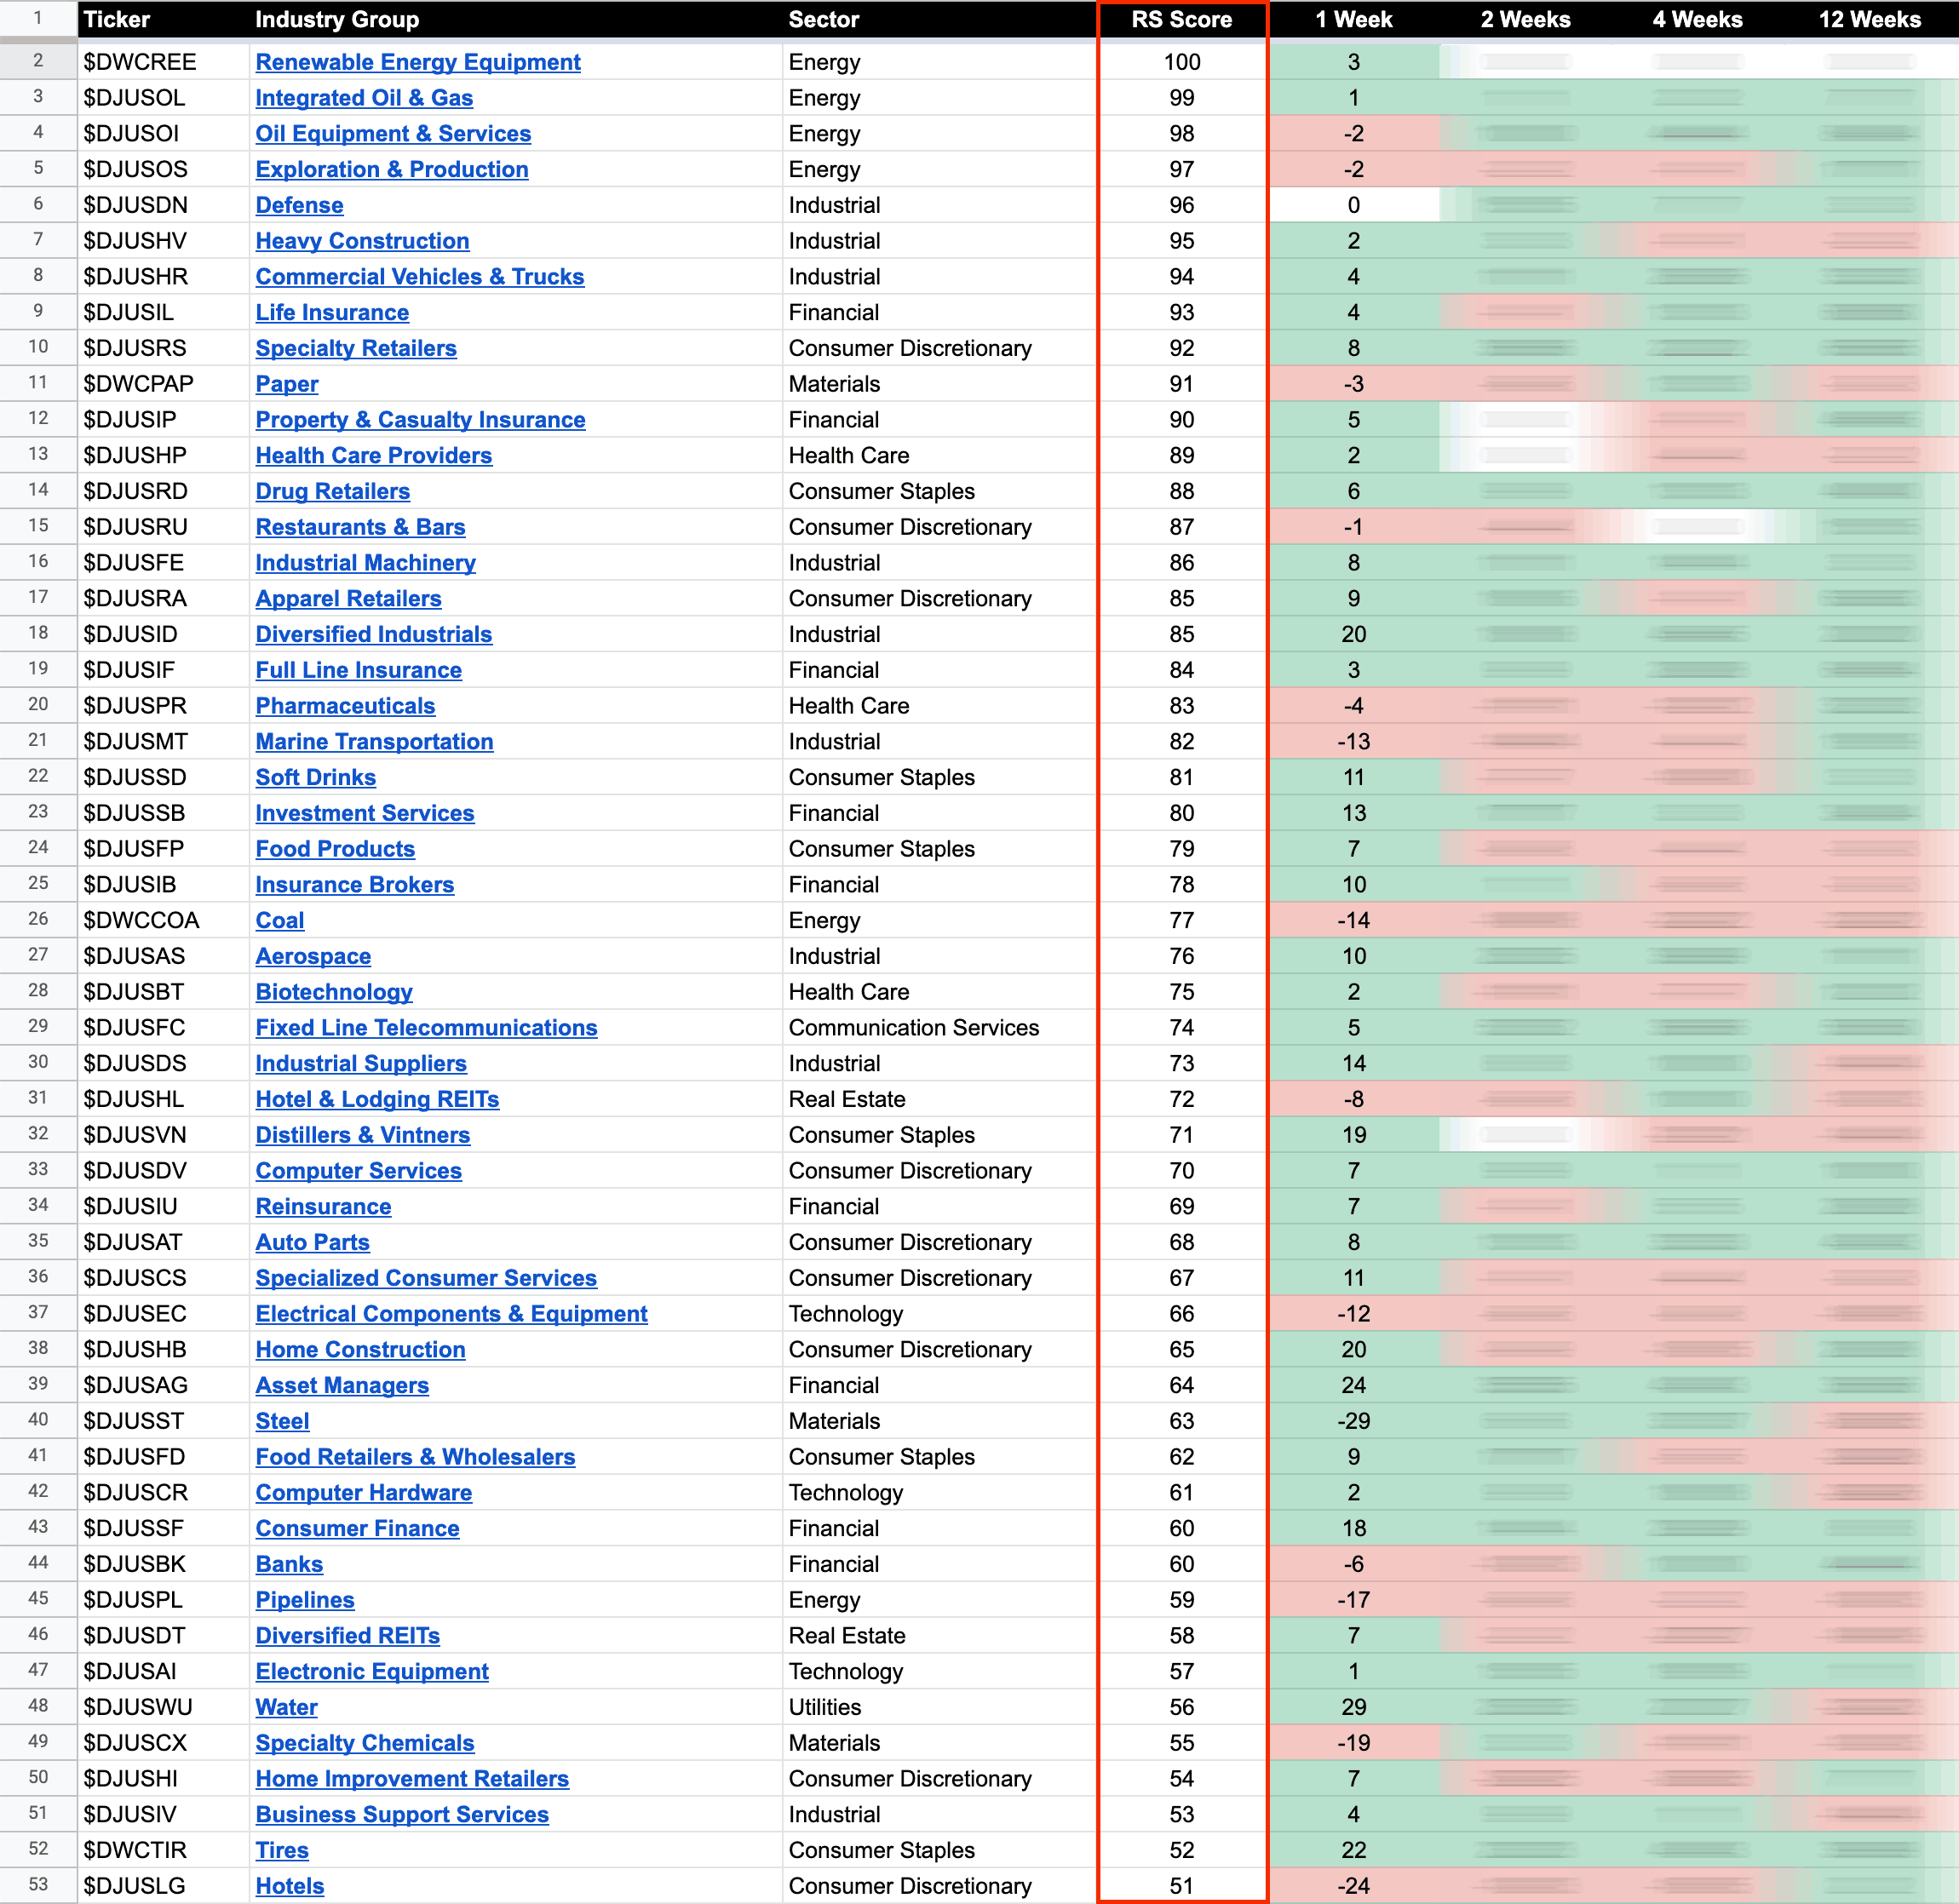
The purpose of the Relative Strength (RS) tables is to track the short, medium and long term RS changes of the individual groups to find the new leadership earlier than the crowd...
Read More
23 October, 2022
Stage Analysis Members Video Part 2 – 23 October 2022 (58 mins)
Part 2 of the regular members weekend video discussing the market, commodities, industry groups and market breadth to determine the weight of evidence.
Read More
22 October, 2022
IBD Industry Groups Bell Curve – Bullish Percent
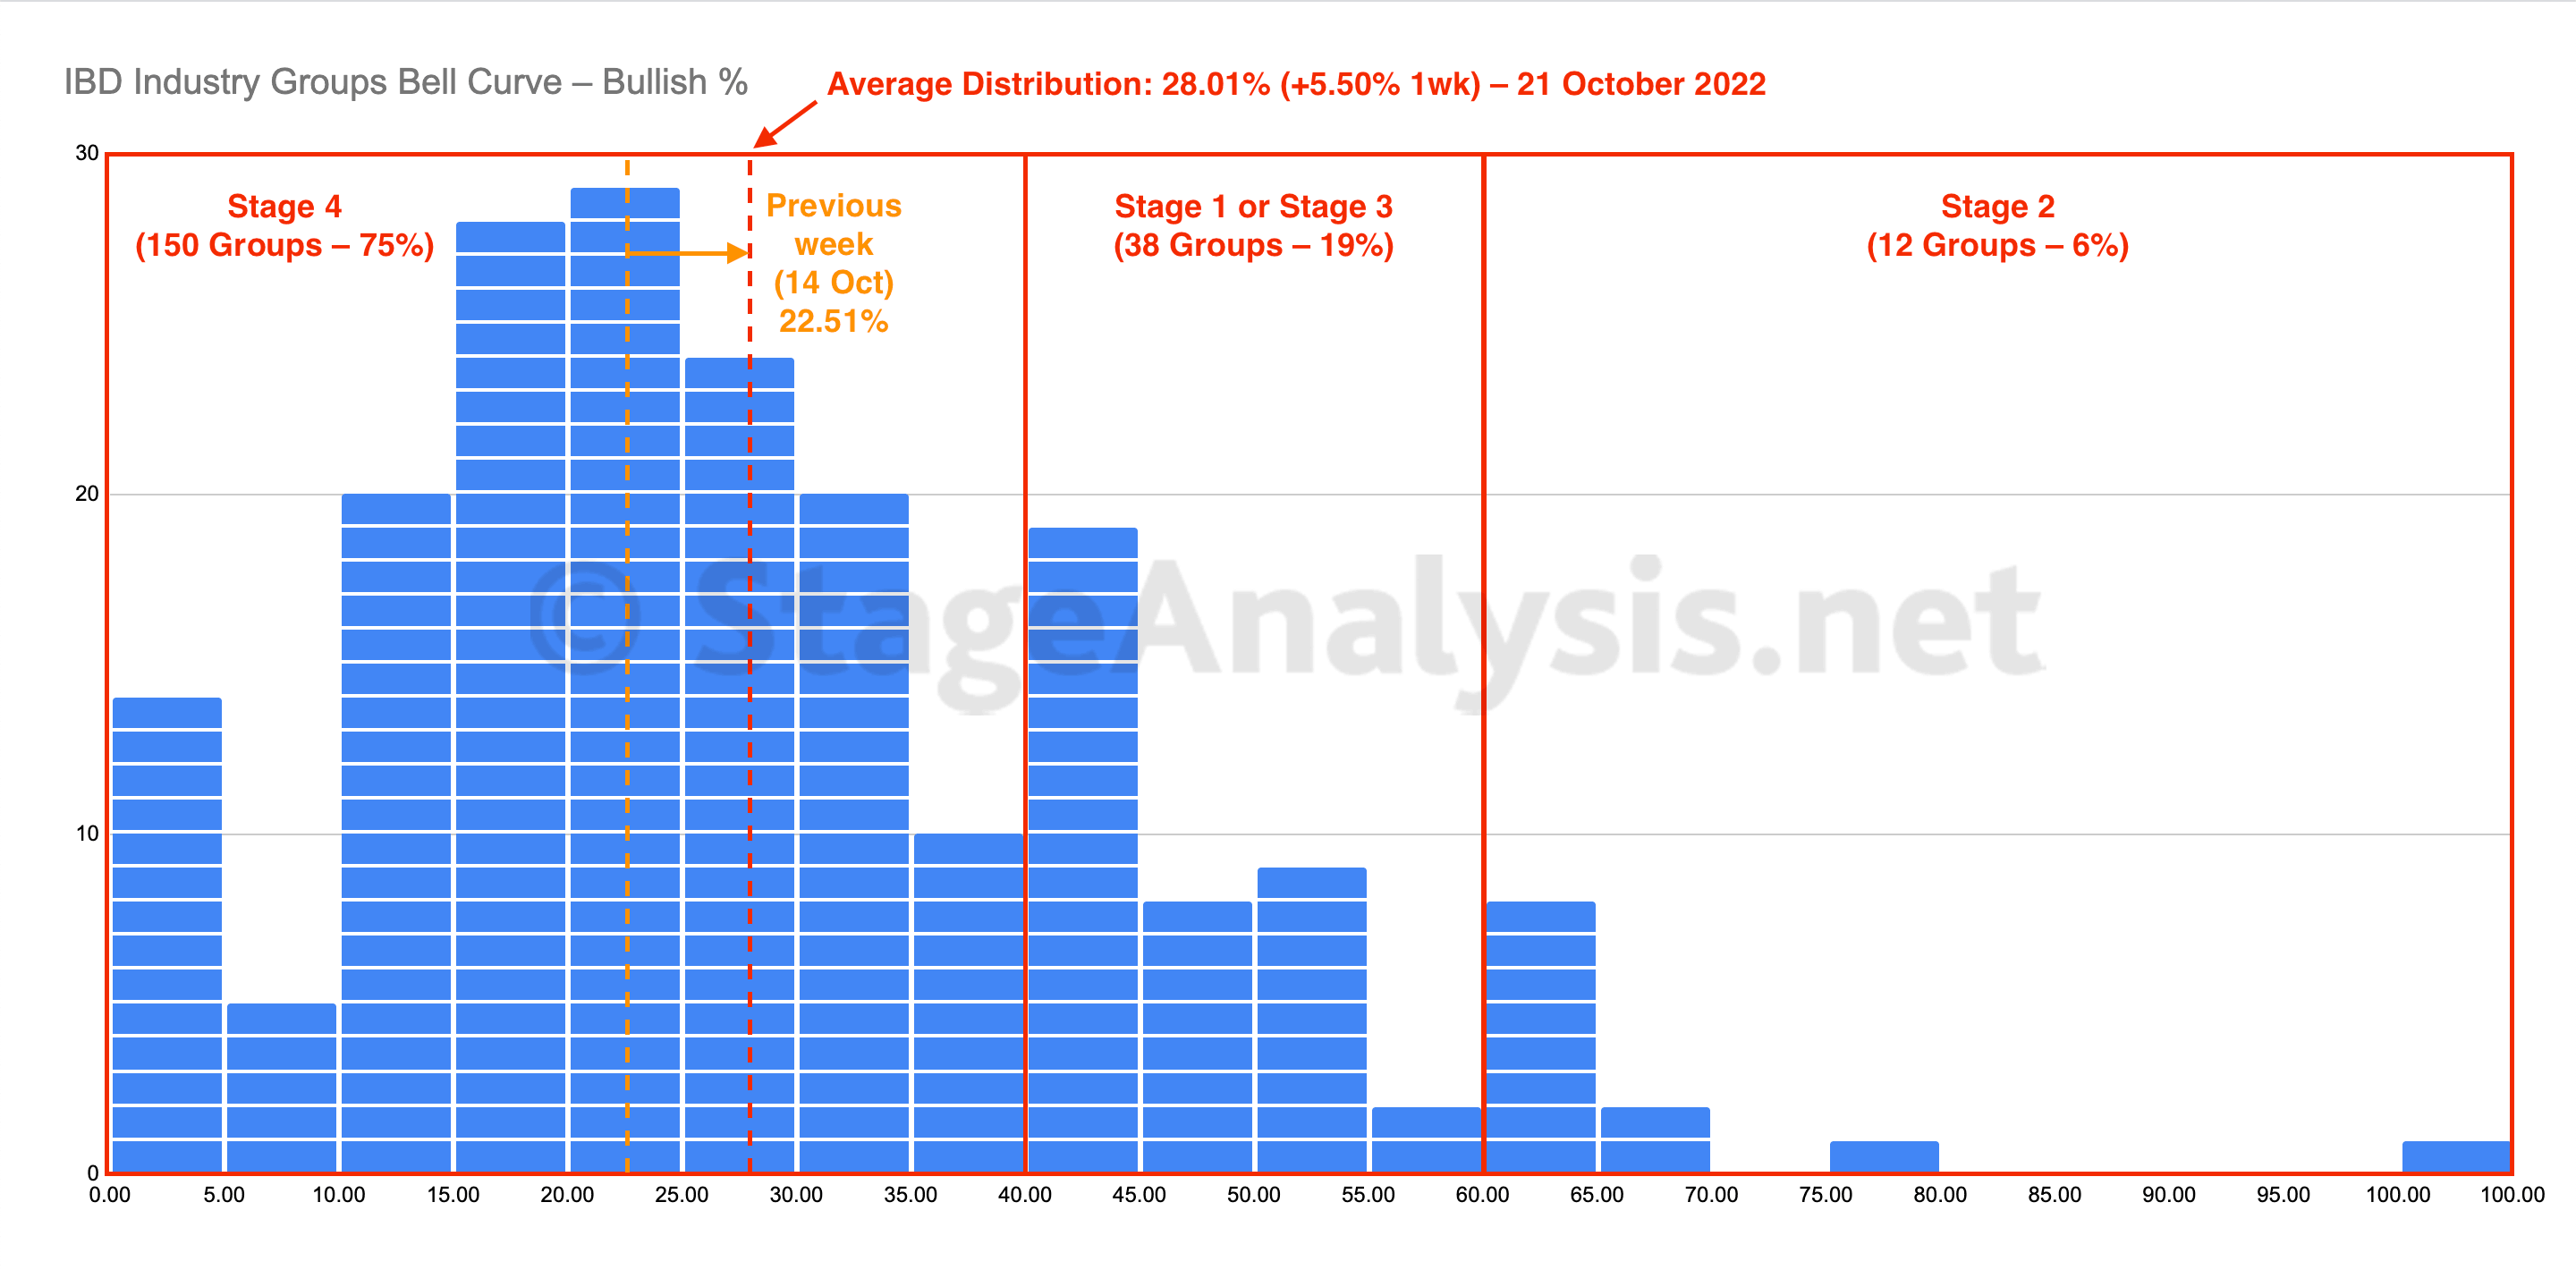
The IBD Industry Groups Bell Curve – Bullish Percent improved over the last week with 24 groups (-12%) less in the Stage 4 zone, and 14 groups (+7%) more groups in the neutral Stage 1 / Stage 3 zone and 10 groups (+5%) more moving into the Stage 2 zone...
Read More
21 October, 2022
US Stocks Industry Groups Relative Strength Rankings
The purpose of the Relative Strength (RS) tables is to track the short, medium and long term RS changes of the individual groups to find the new leadership earlier than the crowd...
Read More

