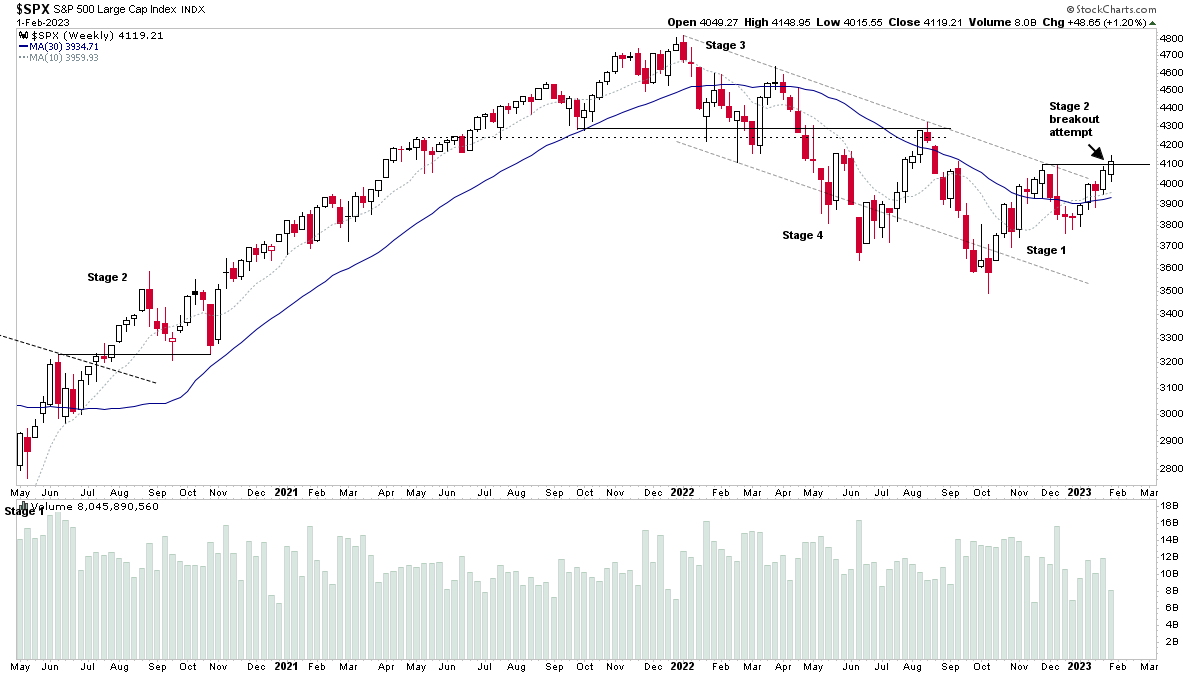
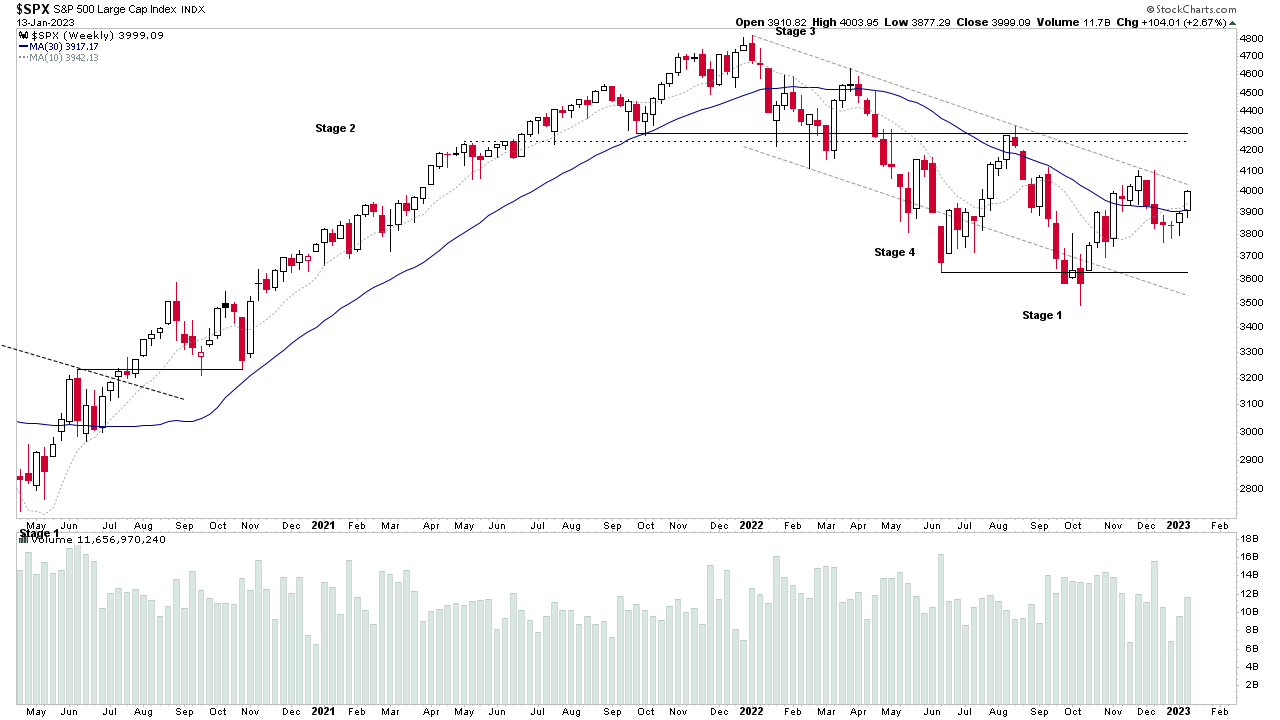
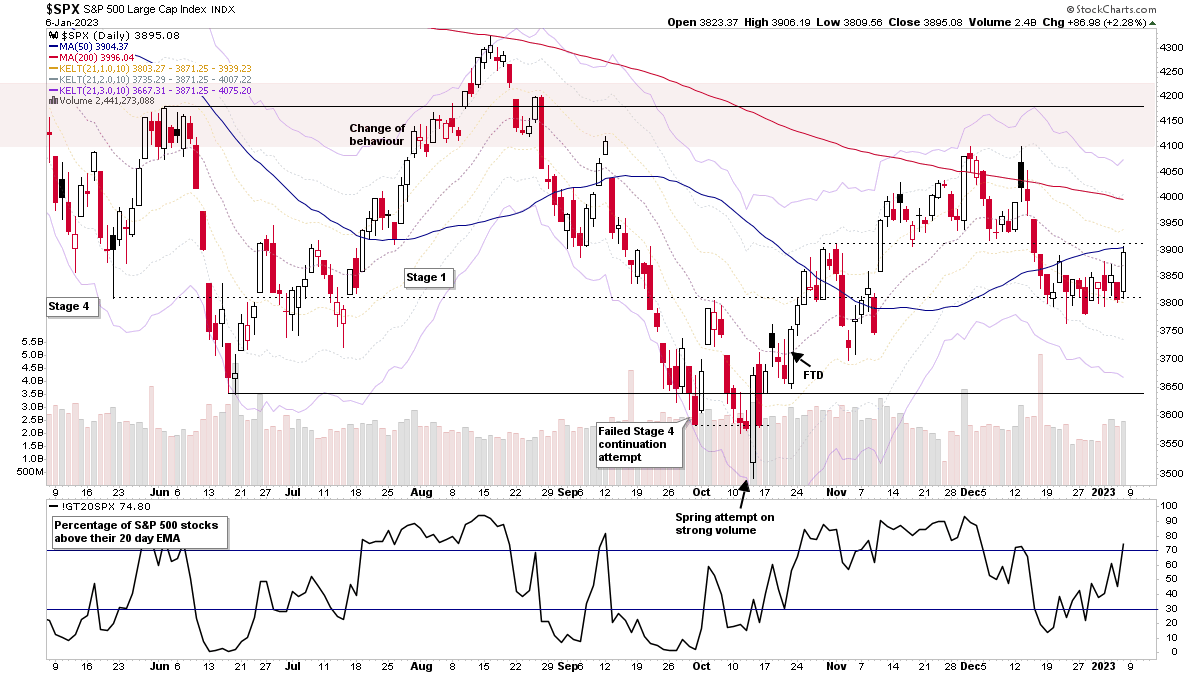
Stage Analysis Members midweek video discussing the Stage 2 breakout attempts in some of the major indexes, a look at the some of the key market breadth data, recent watchlist stocks and more on the small caps from yesterdays post.
Read More
Blog
01 February, 2023
Stage Analysis Members Video – 1 February 2023 (35 mins)
22 January, 2023
Stage Analysis Members Video – 22 January 2023 (1hr 12mins)
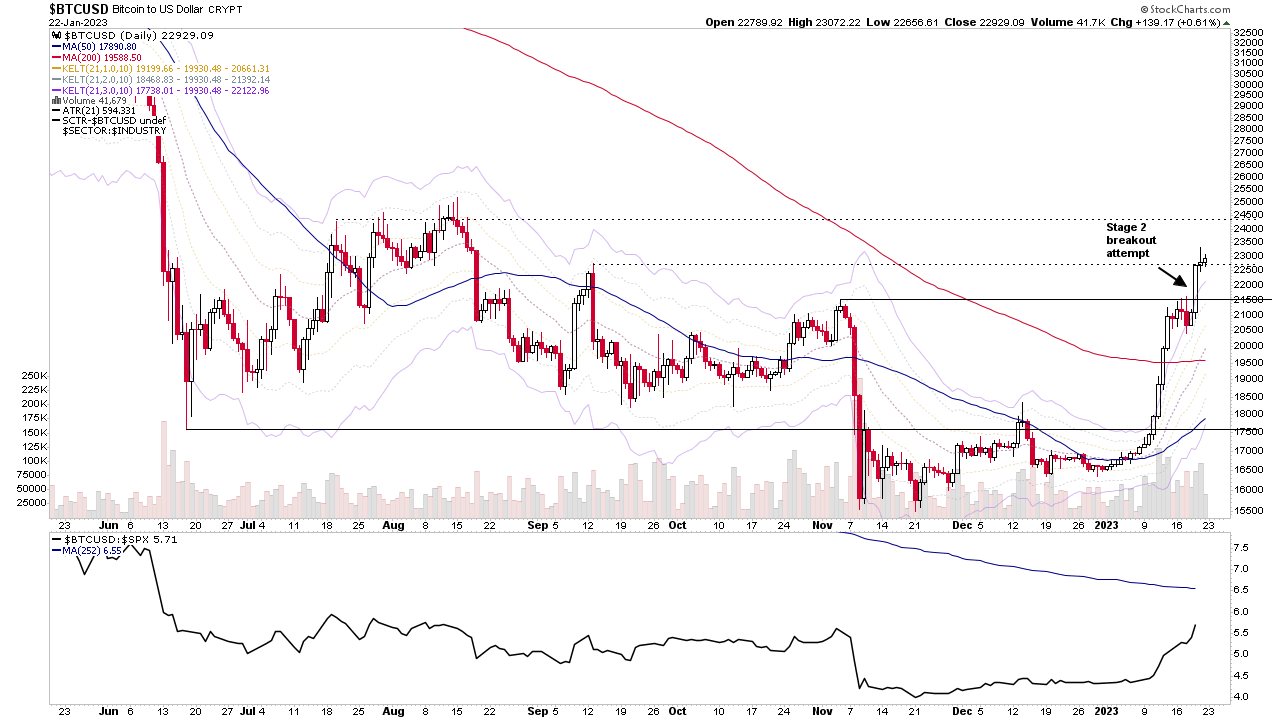
The Stage Analysis members weekend video featuring analysis of the early Stage breakout attempt in Bitcoin, and then the regular content with the major US Indexes, the futures charts, US Industry Groups RS Rankings, IBD Industry Groups Bell Curve - Bullish Percent, the Market Breadth Update to help to determine the Weight of Evidence and finishing with the US Stocks Watchlist in detail on multiple timeframes.
Read More
21 January, 2023
IBD Industry Groups Bell Curve – Bullish Percent
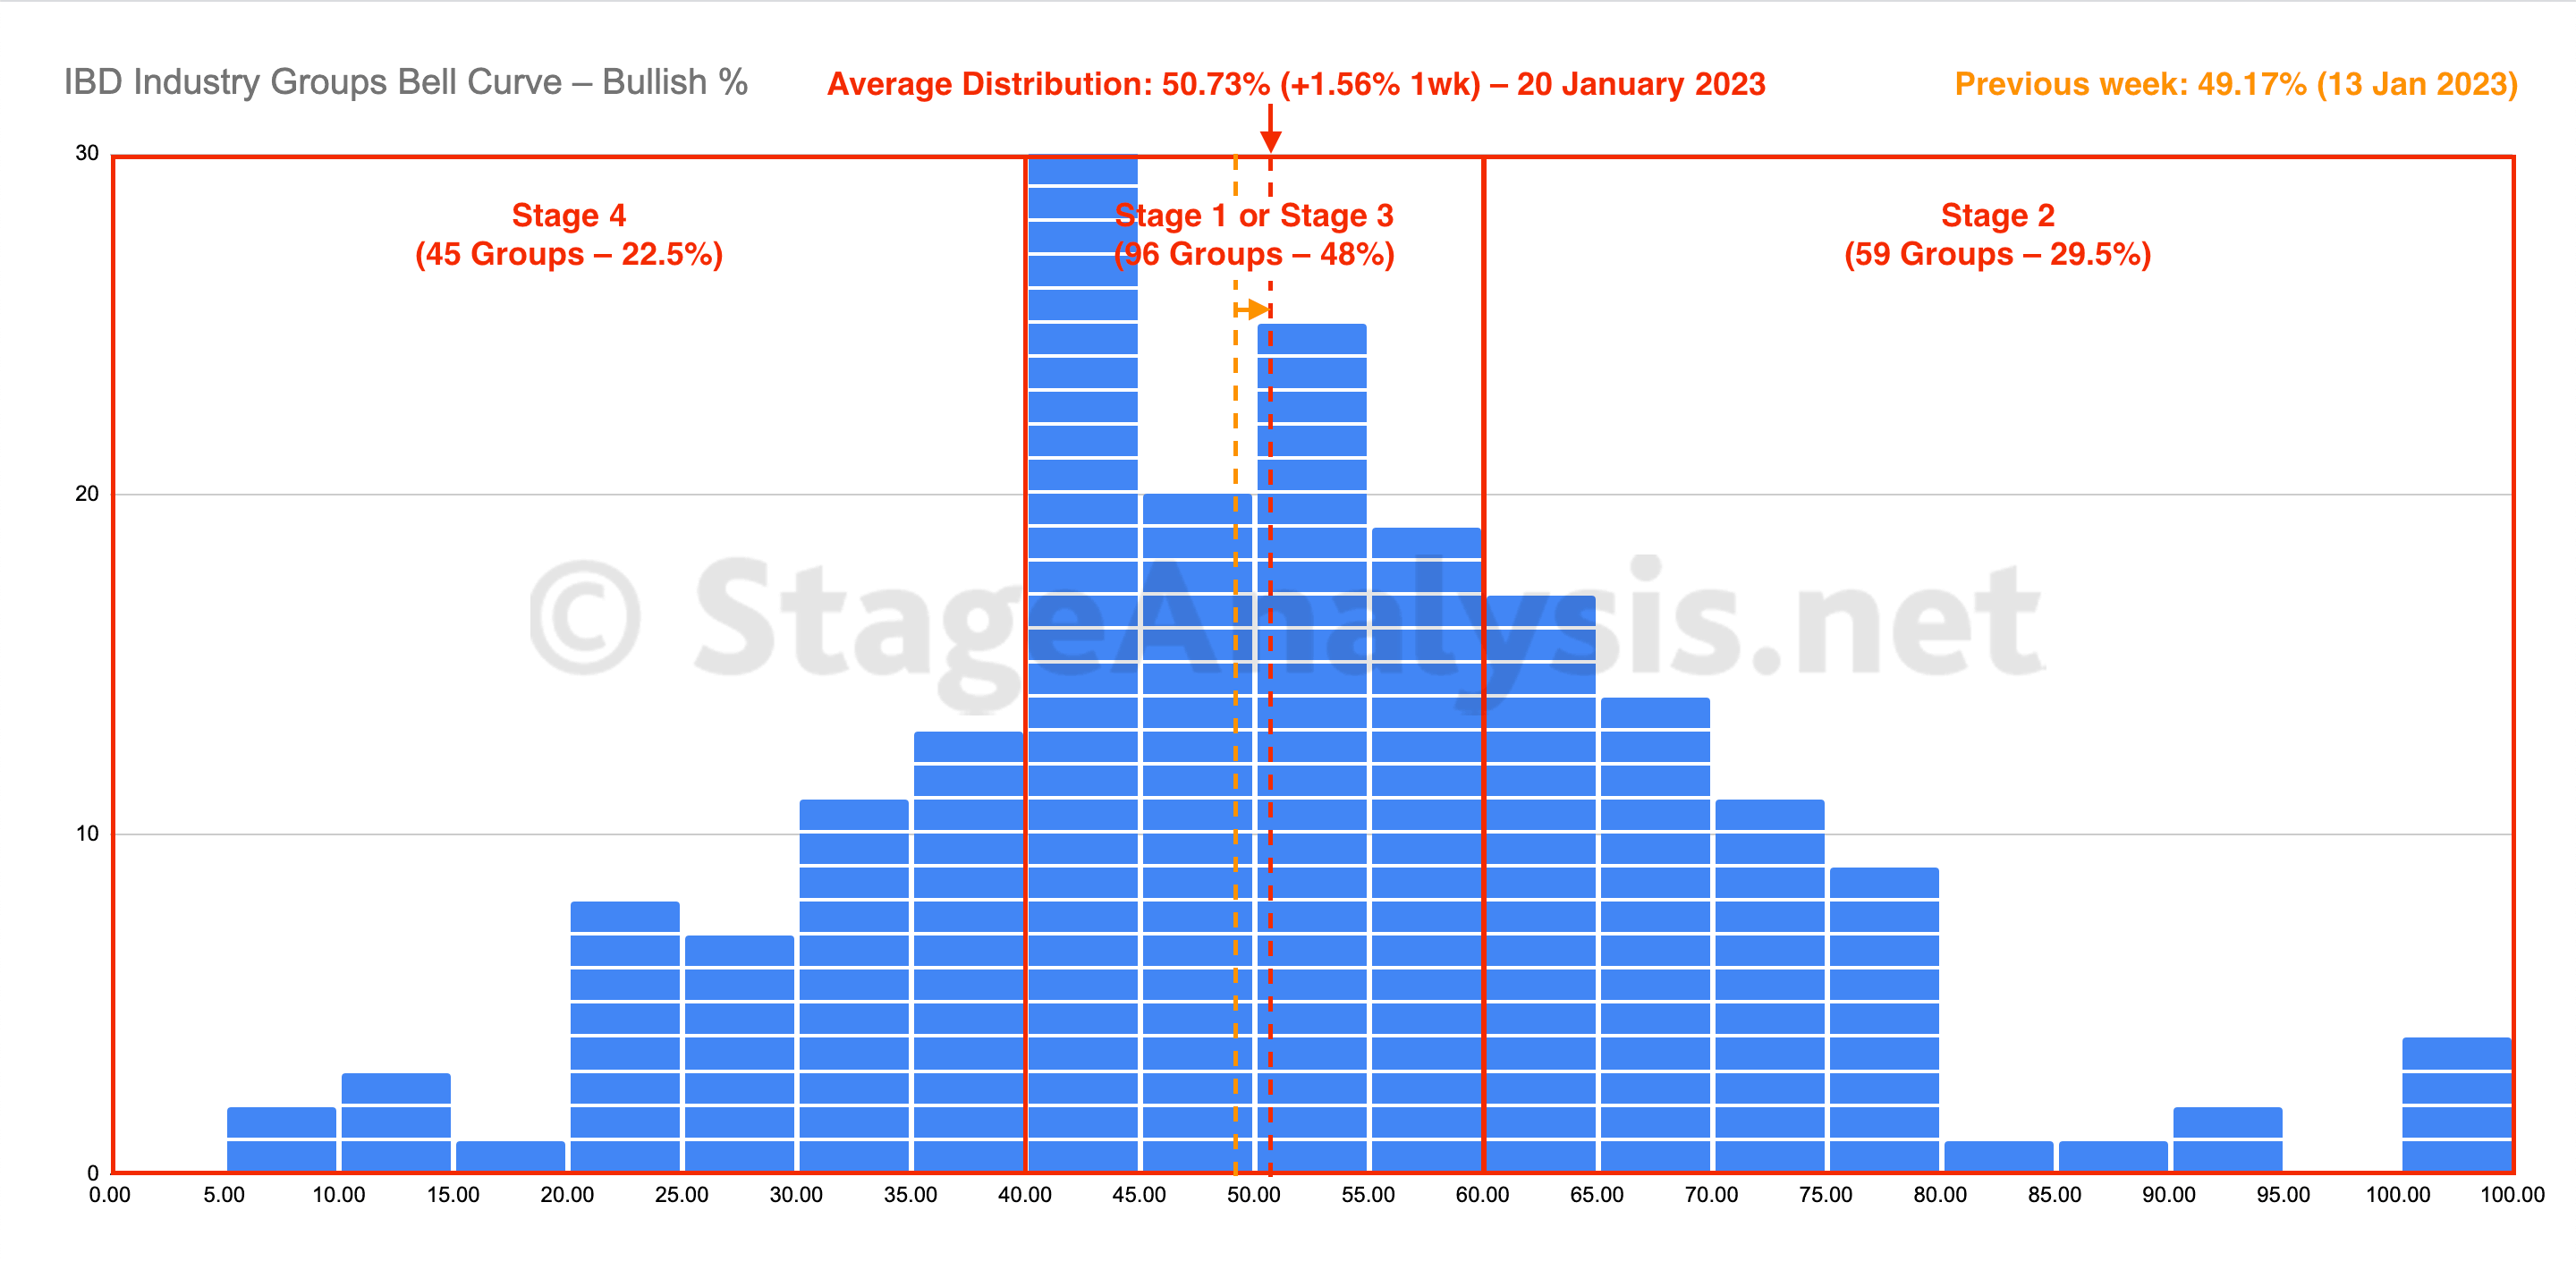
The IBD Industry Groups Bell Curve had a slight gain over the week of +1.56%. The amount of groups in Stage 4 decreased by -10 (-5%), and the amount of groups in Stage 2 increased by +9 (+4.5%), while the amount groups in Stage 1 or Stage 3 decreased by -1 (-0.5%).
Read More
21 January, 2023
Market Breadth: Percentage of Stocks Above their 50 Day, 150 Day & 200 Day Moving Averages Combined
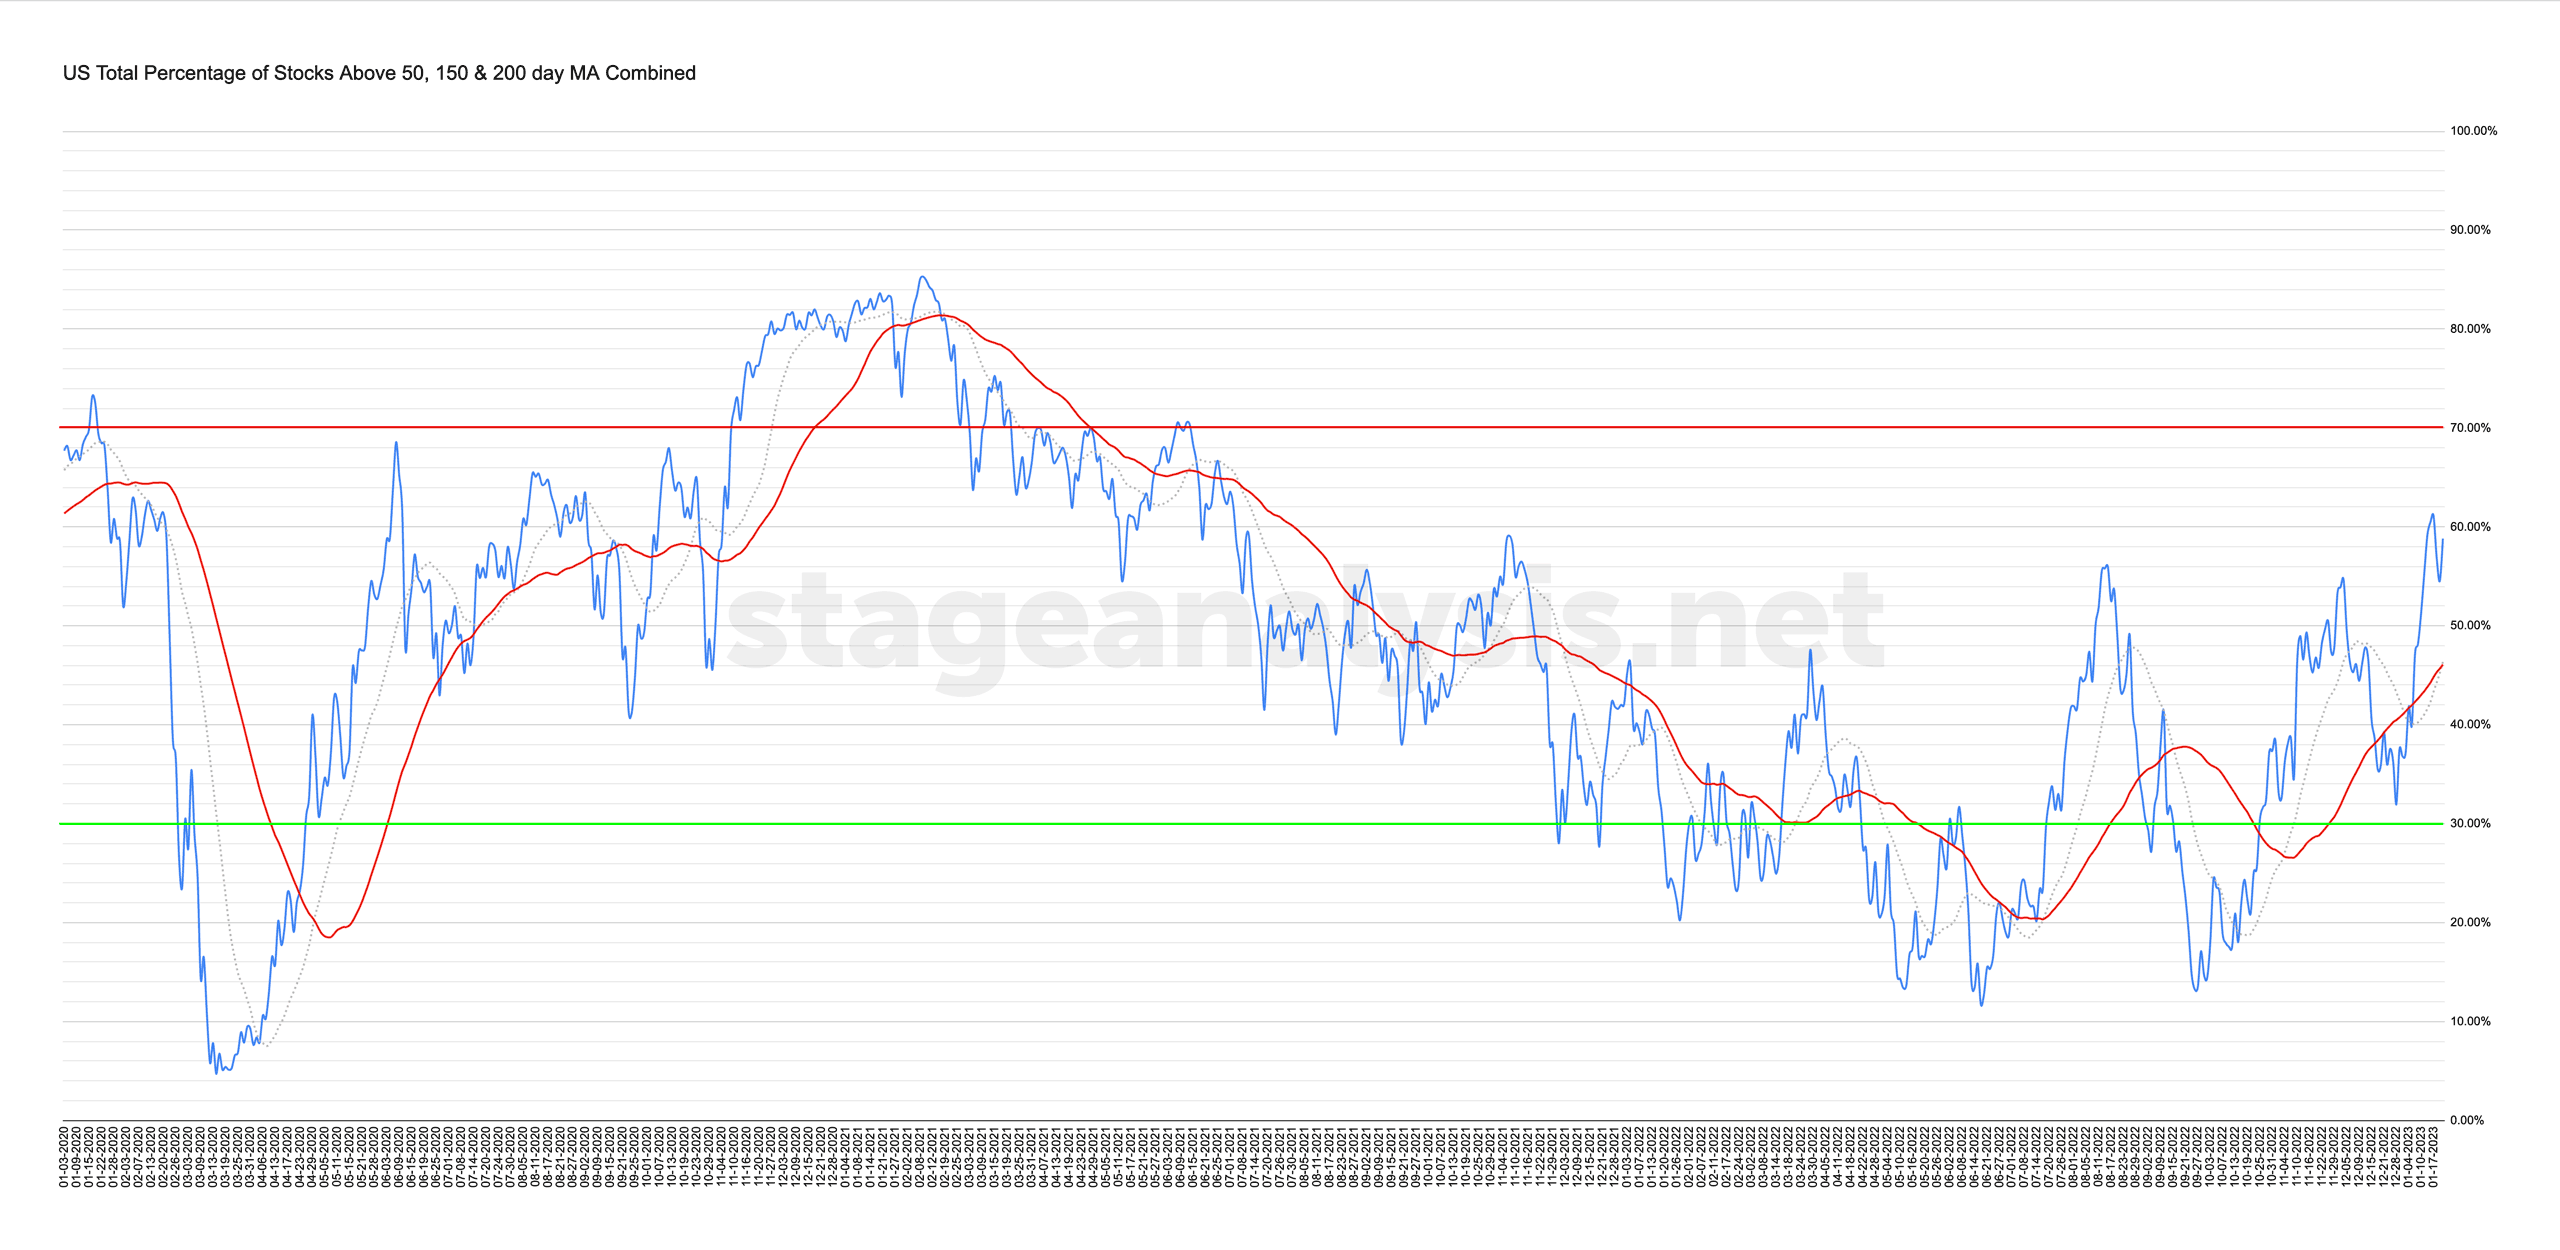
Custom Percentage of Stocks Above Their 50 Day, 150 Day & 200 Day Moving Averages Combined Market Breadth Charts for the Overall US Market, NYSE and Nasdaq for Market Timing and Strategy.
Read More
20 January, 2023
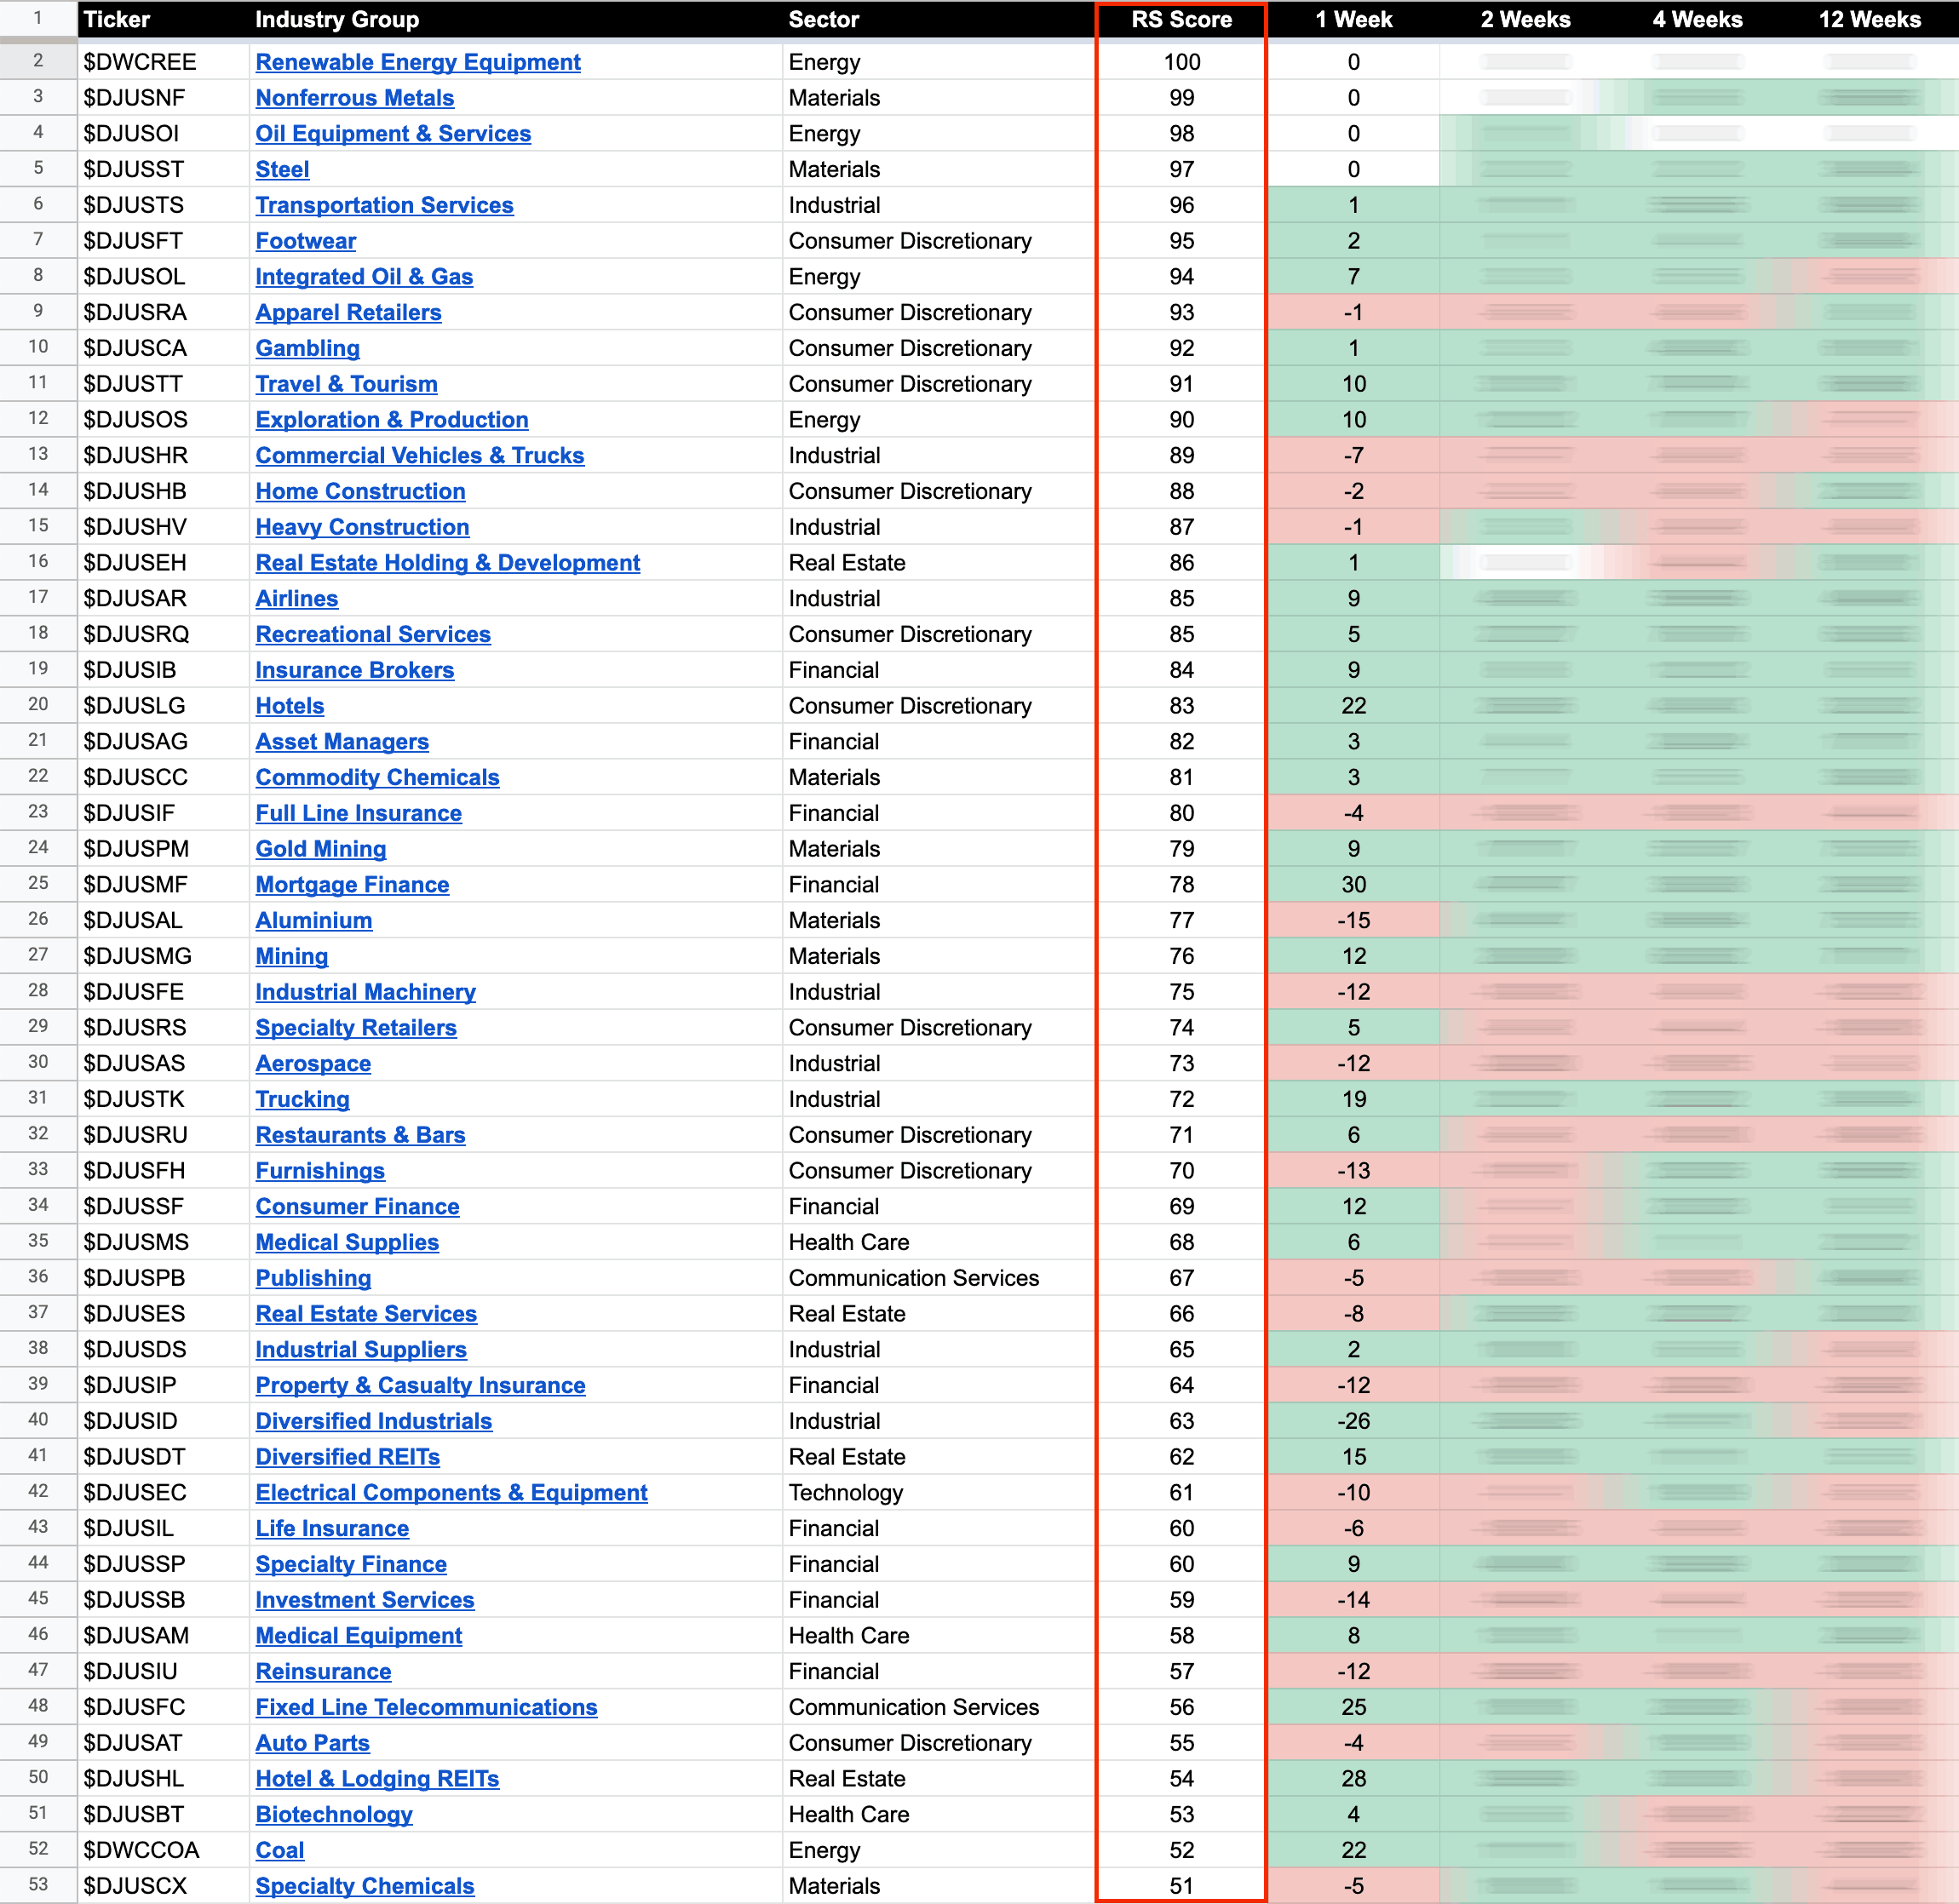
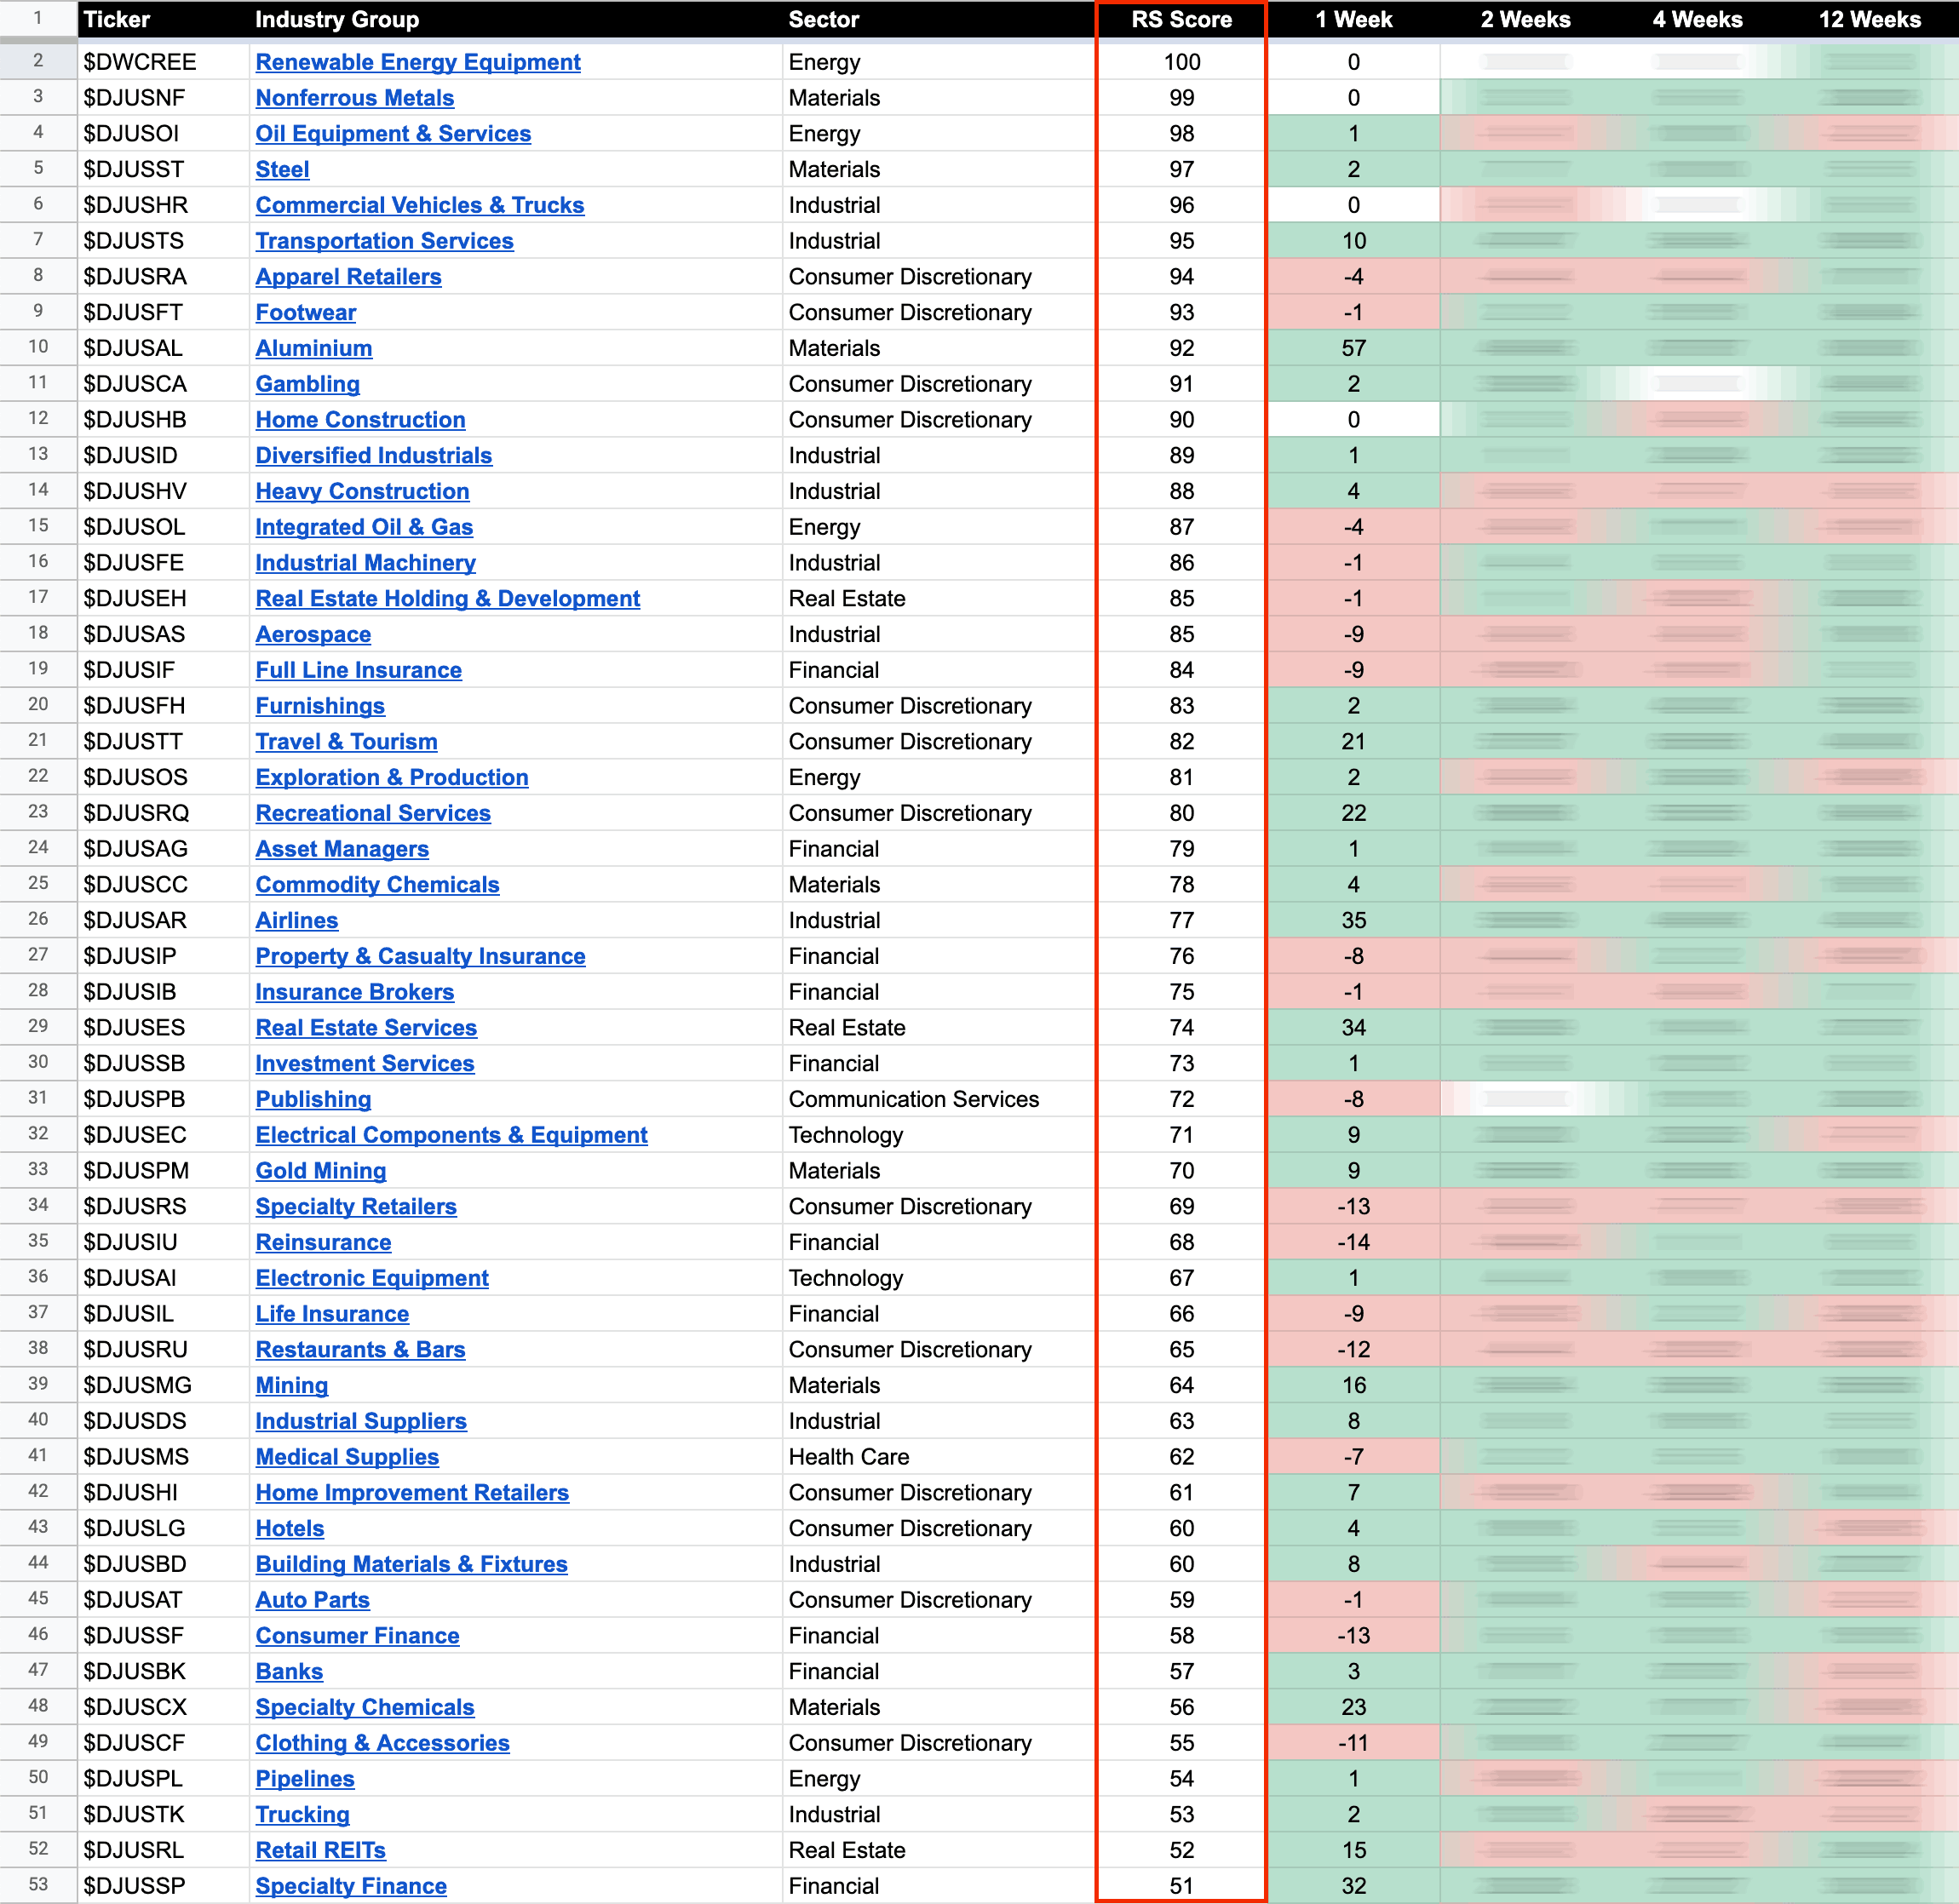
US Stocks Industry Groups Relative Strength Rankings
The purpose of the Relative Strength (RS) tables is to track the short, medium and long term RS changes of the individual groups to find the new leadership earlier than the crowd...
Read More
15 January, 2023
Stage Analysis Members Video – 15 January 2023 (1hr 15mins)
The Stage Analysis members weekend video featuring analysis of the major US Indexes as many approach their Stage 2 levels. Followed by a look at the futures charts, US Industry Groups RS Rankings, IBD Industry Groups Bell Curve - Bullish Percent, the Market Breadth Update to help to determine the Weight of Evidence and finishing with the US Stocks Watchlist in detail on multiple timeframes.
Read More
14 January, 2023
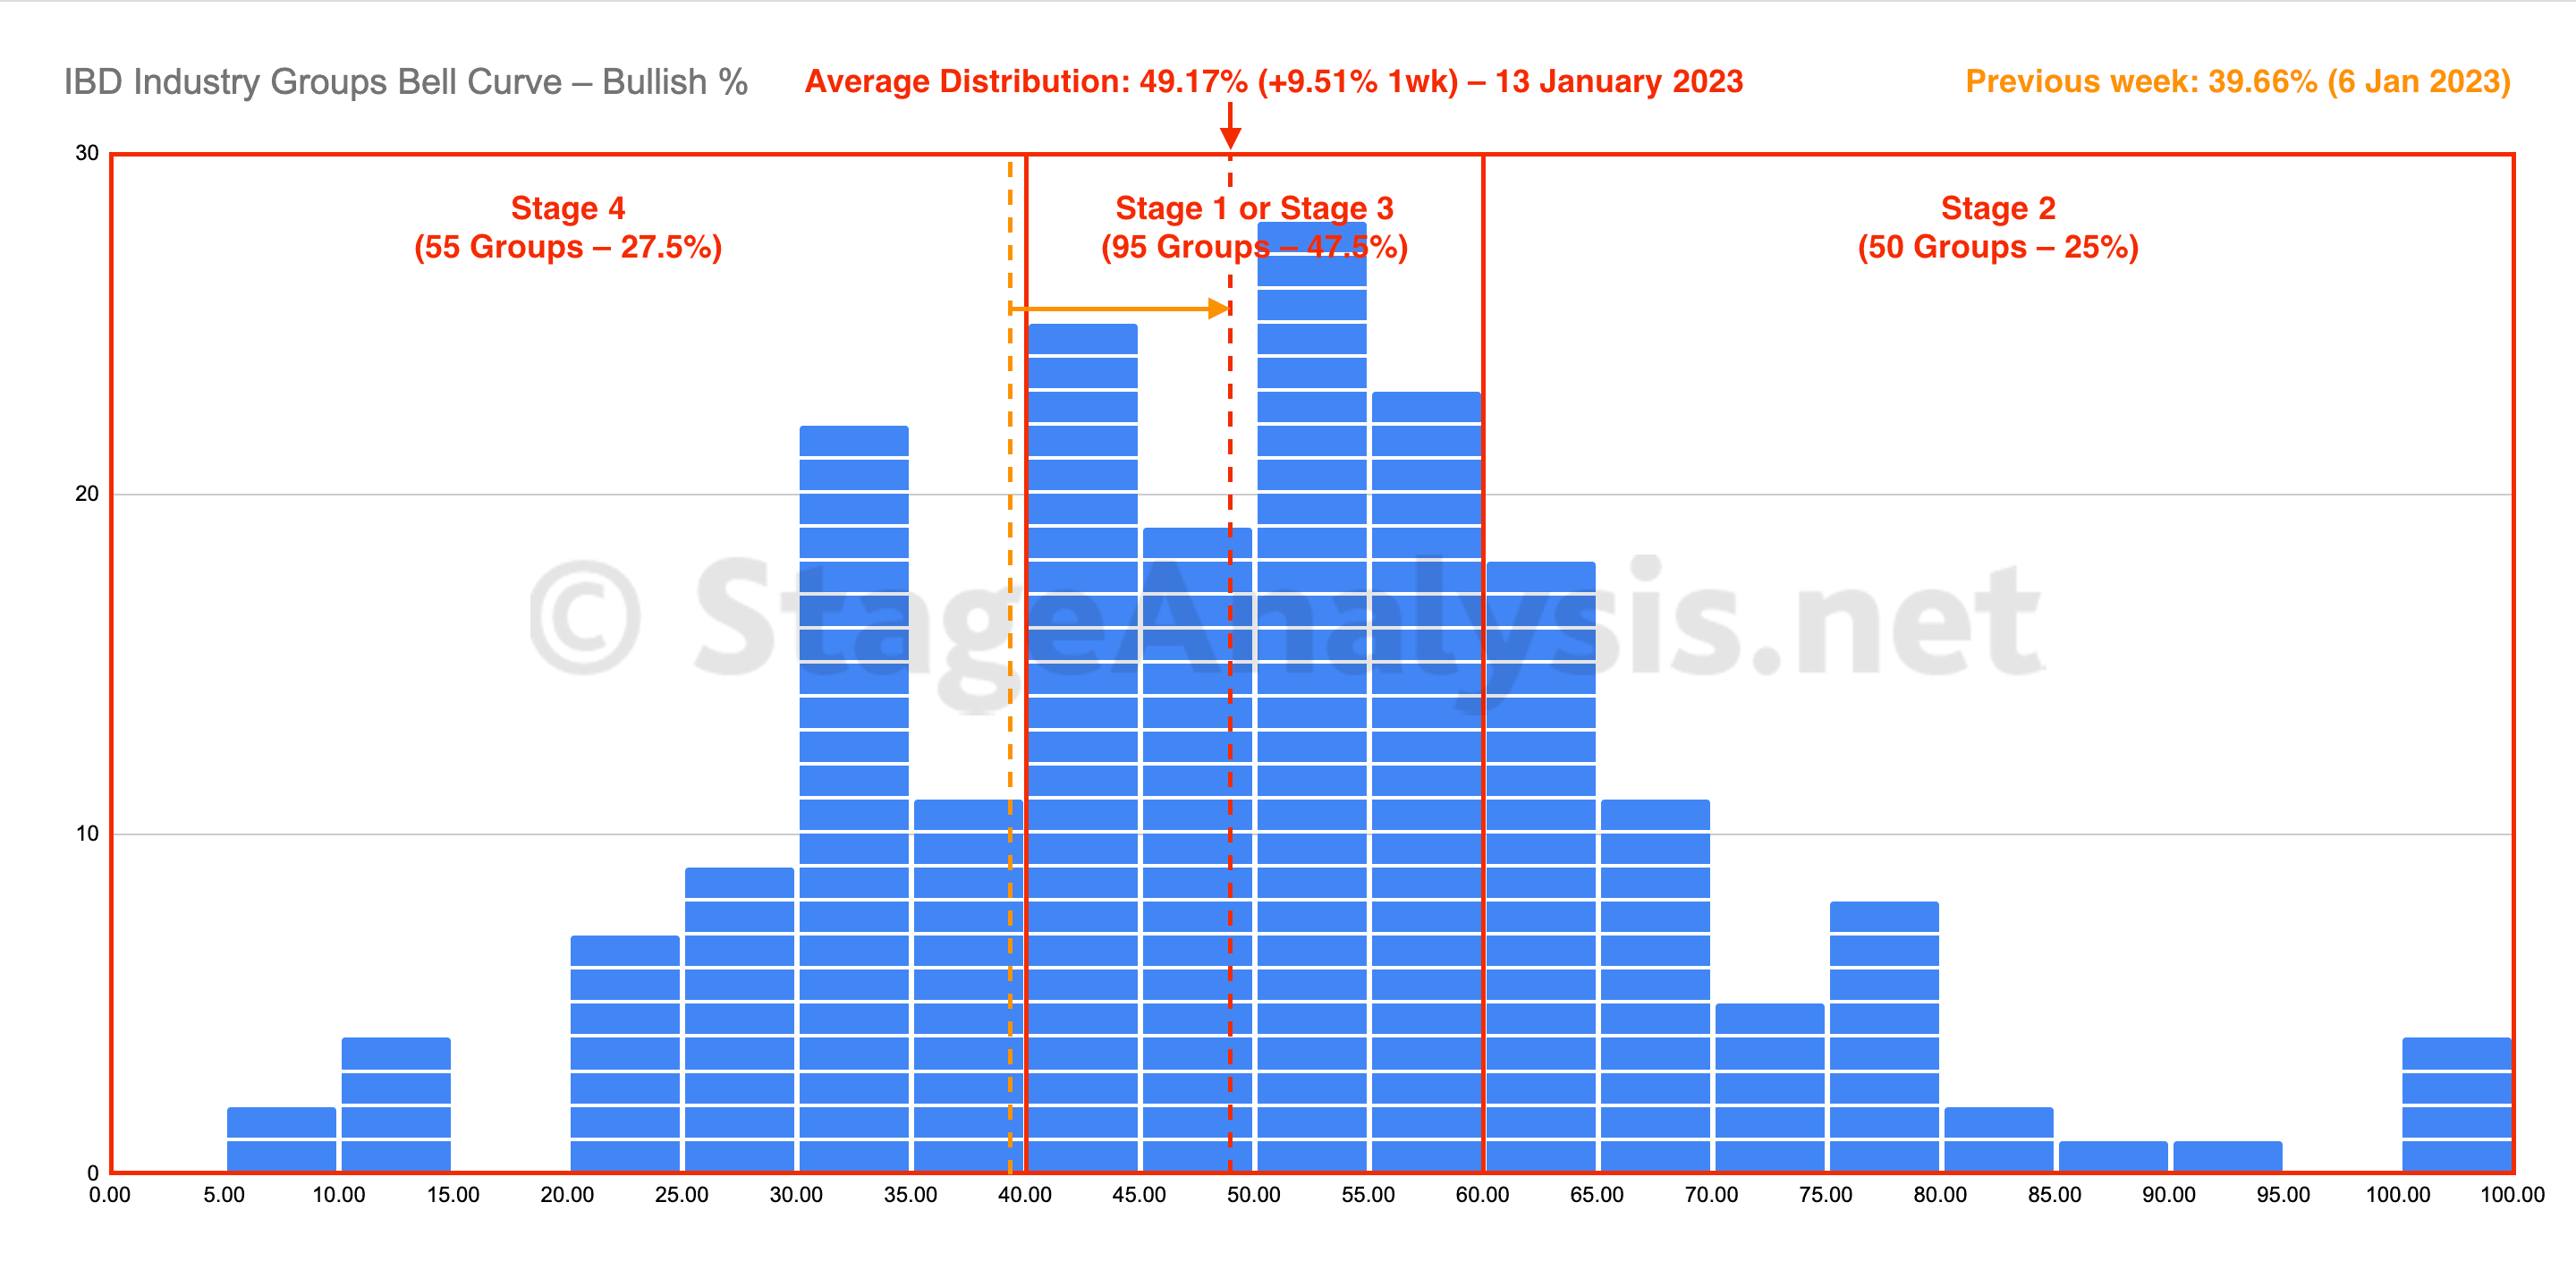
IBD Industry Groups Bell Curve – Bullish Percent
The IBD Industry Groups Bell Curve moved strongly higher this week with a +9.51% gain to close the week at 49.17%. The amount of groups in Stage 4 decreased by -48 (-24%), and the amount of groups in Stage 2 increased by +28 (+14%), while the amount groups in Stage 1 or Stage 3 decreased by -20 (-10%).
Read More
14 January, 2023
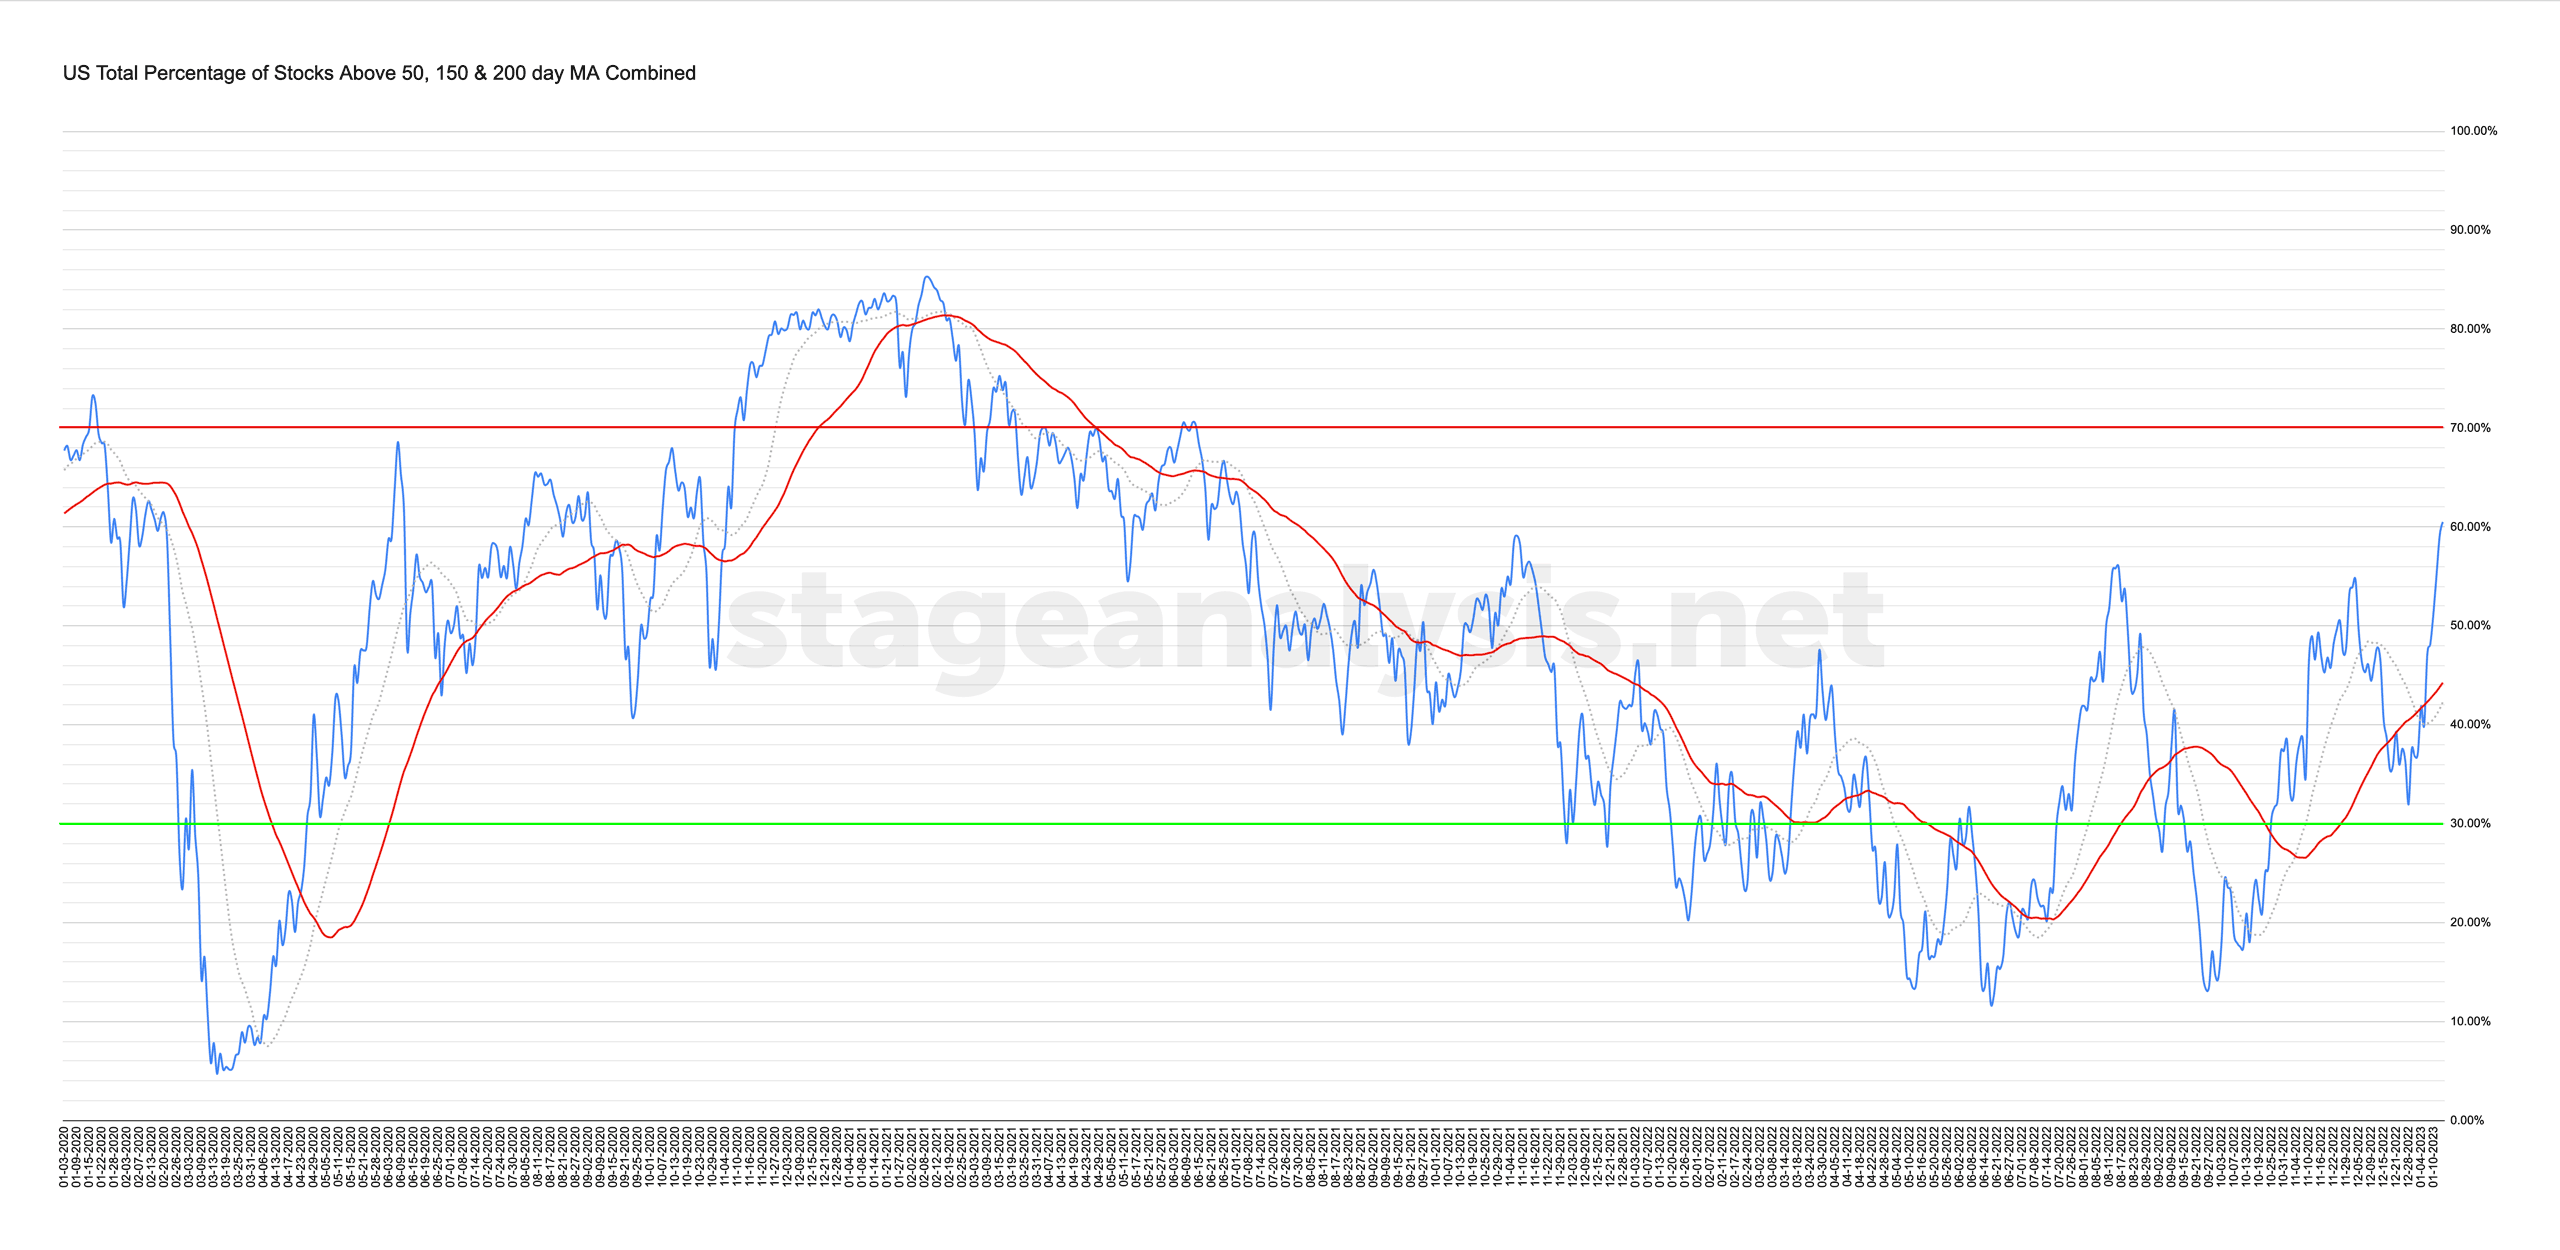
Market Breadth: Percentage of Stocks Above their 50 Day, 150 Day & 200 Day Moving Averages Combined
Custom Percentage of Stocks Above Their 50 Day, 150 Day & 200 Day Moving Averages Combined Market Breadth Charts for the Overall US Market, NYSE and Nasdaq for Market Timing and Strategy.
Read More
13 January, 2023
US Stocks Industry Groups Relative Strength Rankings
The purpose of the Relative Strength (RS) tables is to track the short, medium and long term RS changes of the individual groups to find the new leadership earlier than the crowd...
Read More
08 January, 2023
Stage Analysis Members Video – 8 January 2023 (1hr 22mins)
The Stage Analysis members weekend video featuring analysis of the US Sectors and major US Indexes. Followed by a look at the futures charts, US Industry Groups RS Rankings, IBD Industry Groups Bell Curve - Bullish Percent, Nasdaq 100 SATA Scores, the Market Breadth Update to help to determine the Weight of Evidence and finishing with the US Stocks Watchlist in detail on multiple timeframes.
Read More

