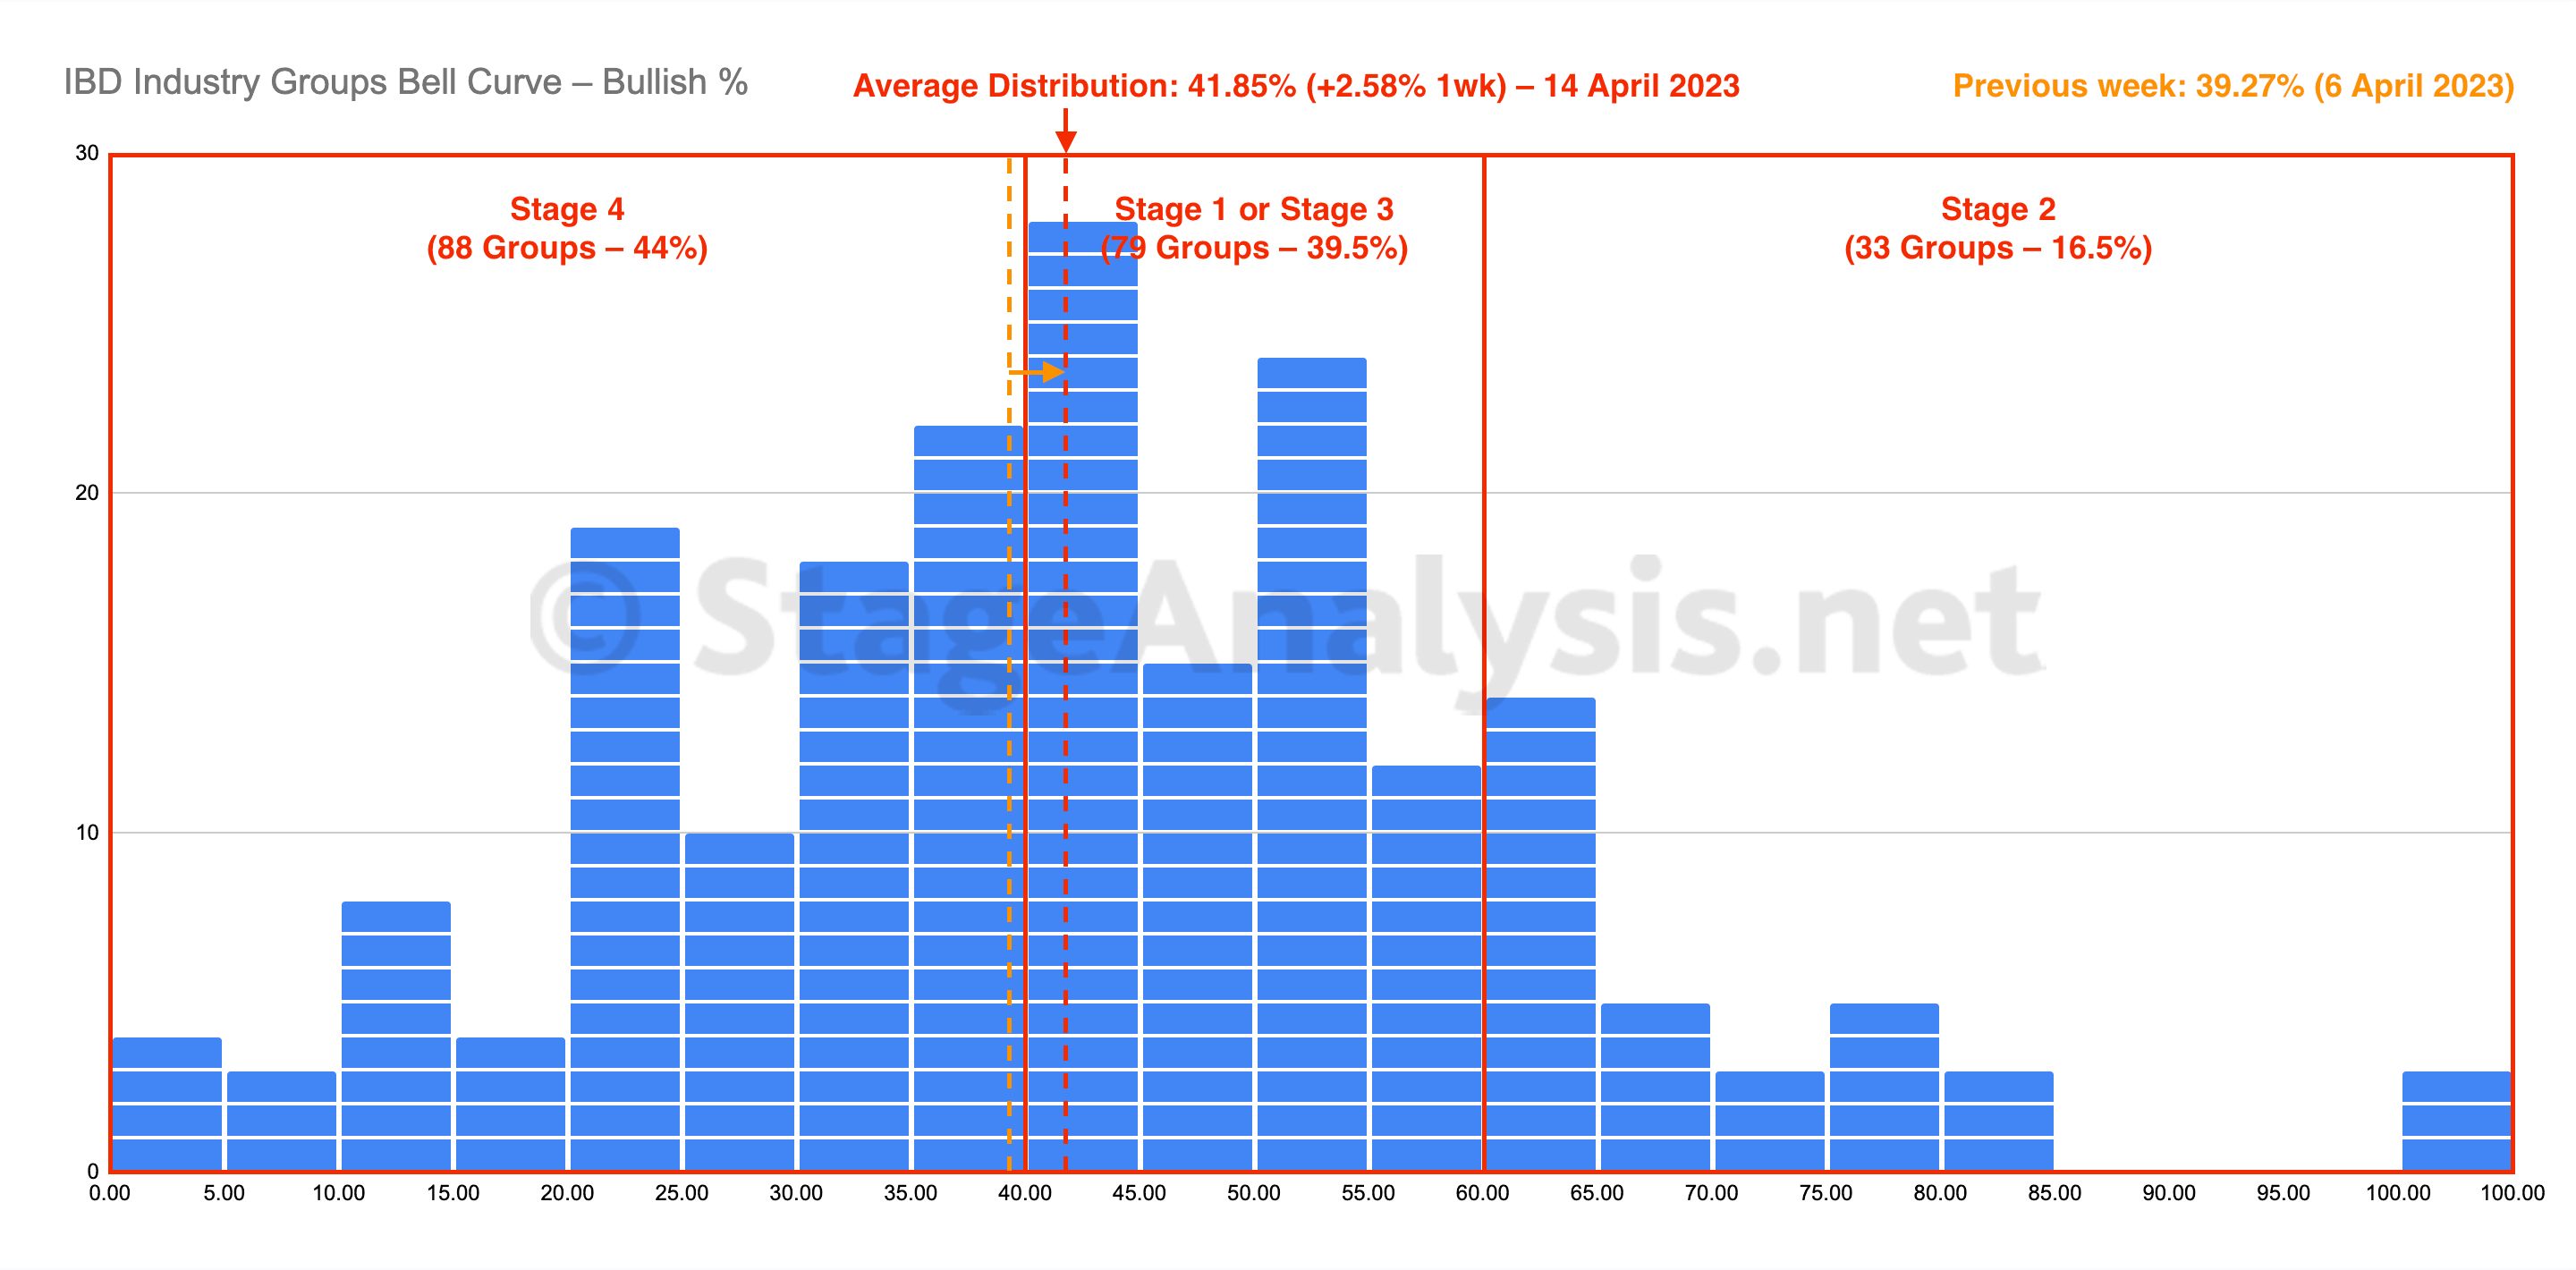
The IBD Industry Groups Bell Curve advanced slightly for a fourth week by +2.58% to finish the week at 41.85%. The amount of groups in Stage 4 decreased by 19 (-9.5%), and the amount of groups in Stage 2 increased by 9 (+4.5%), while the amount groups in Stage 1 or Stage 3 decreased by 10 (-5%).
Read More

Blog
15 April, 2023
IBD Industry Groups Bell Curve – Bullish Percent
15 April, 2023
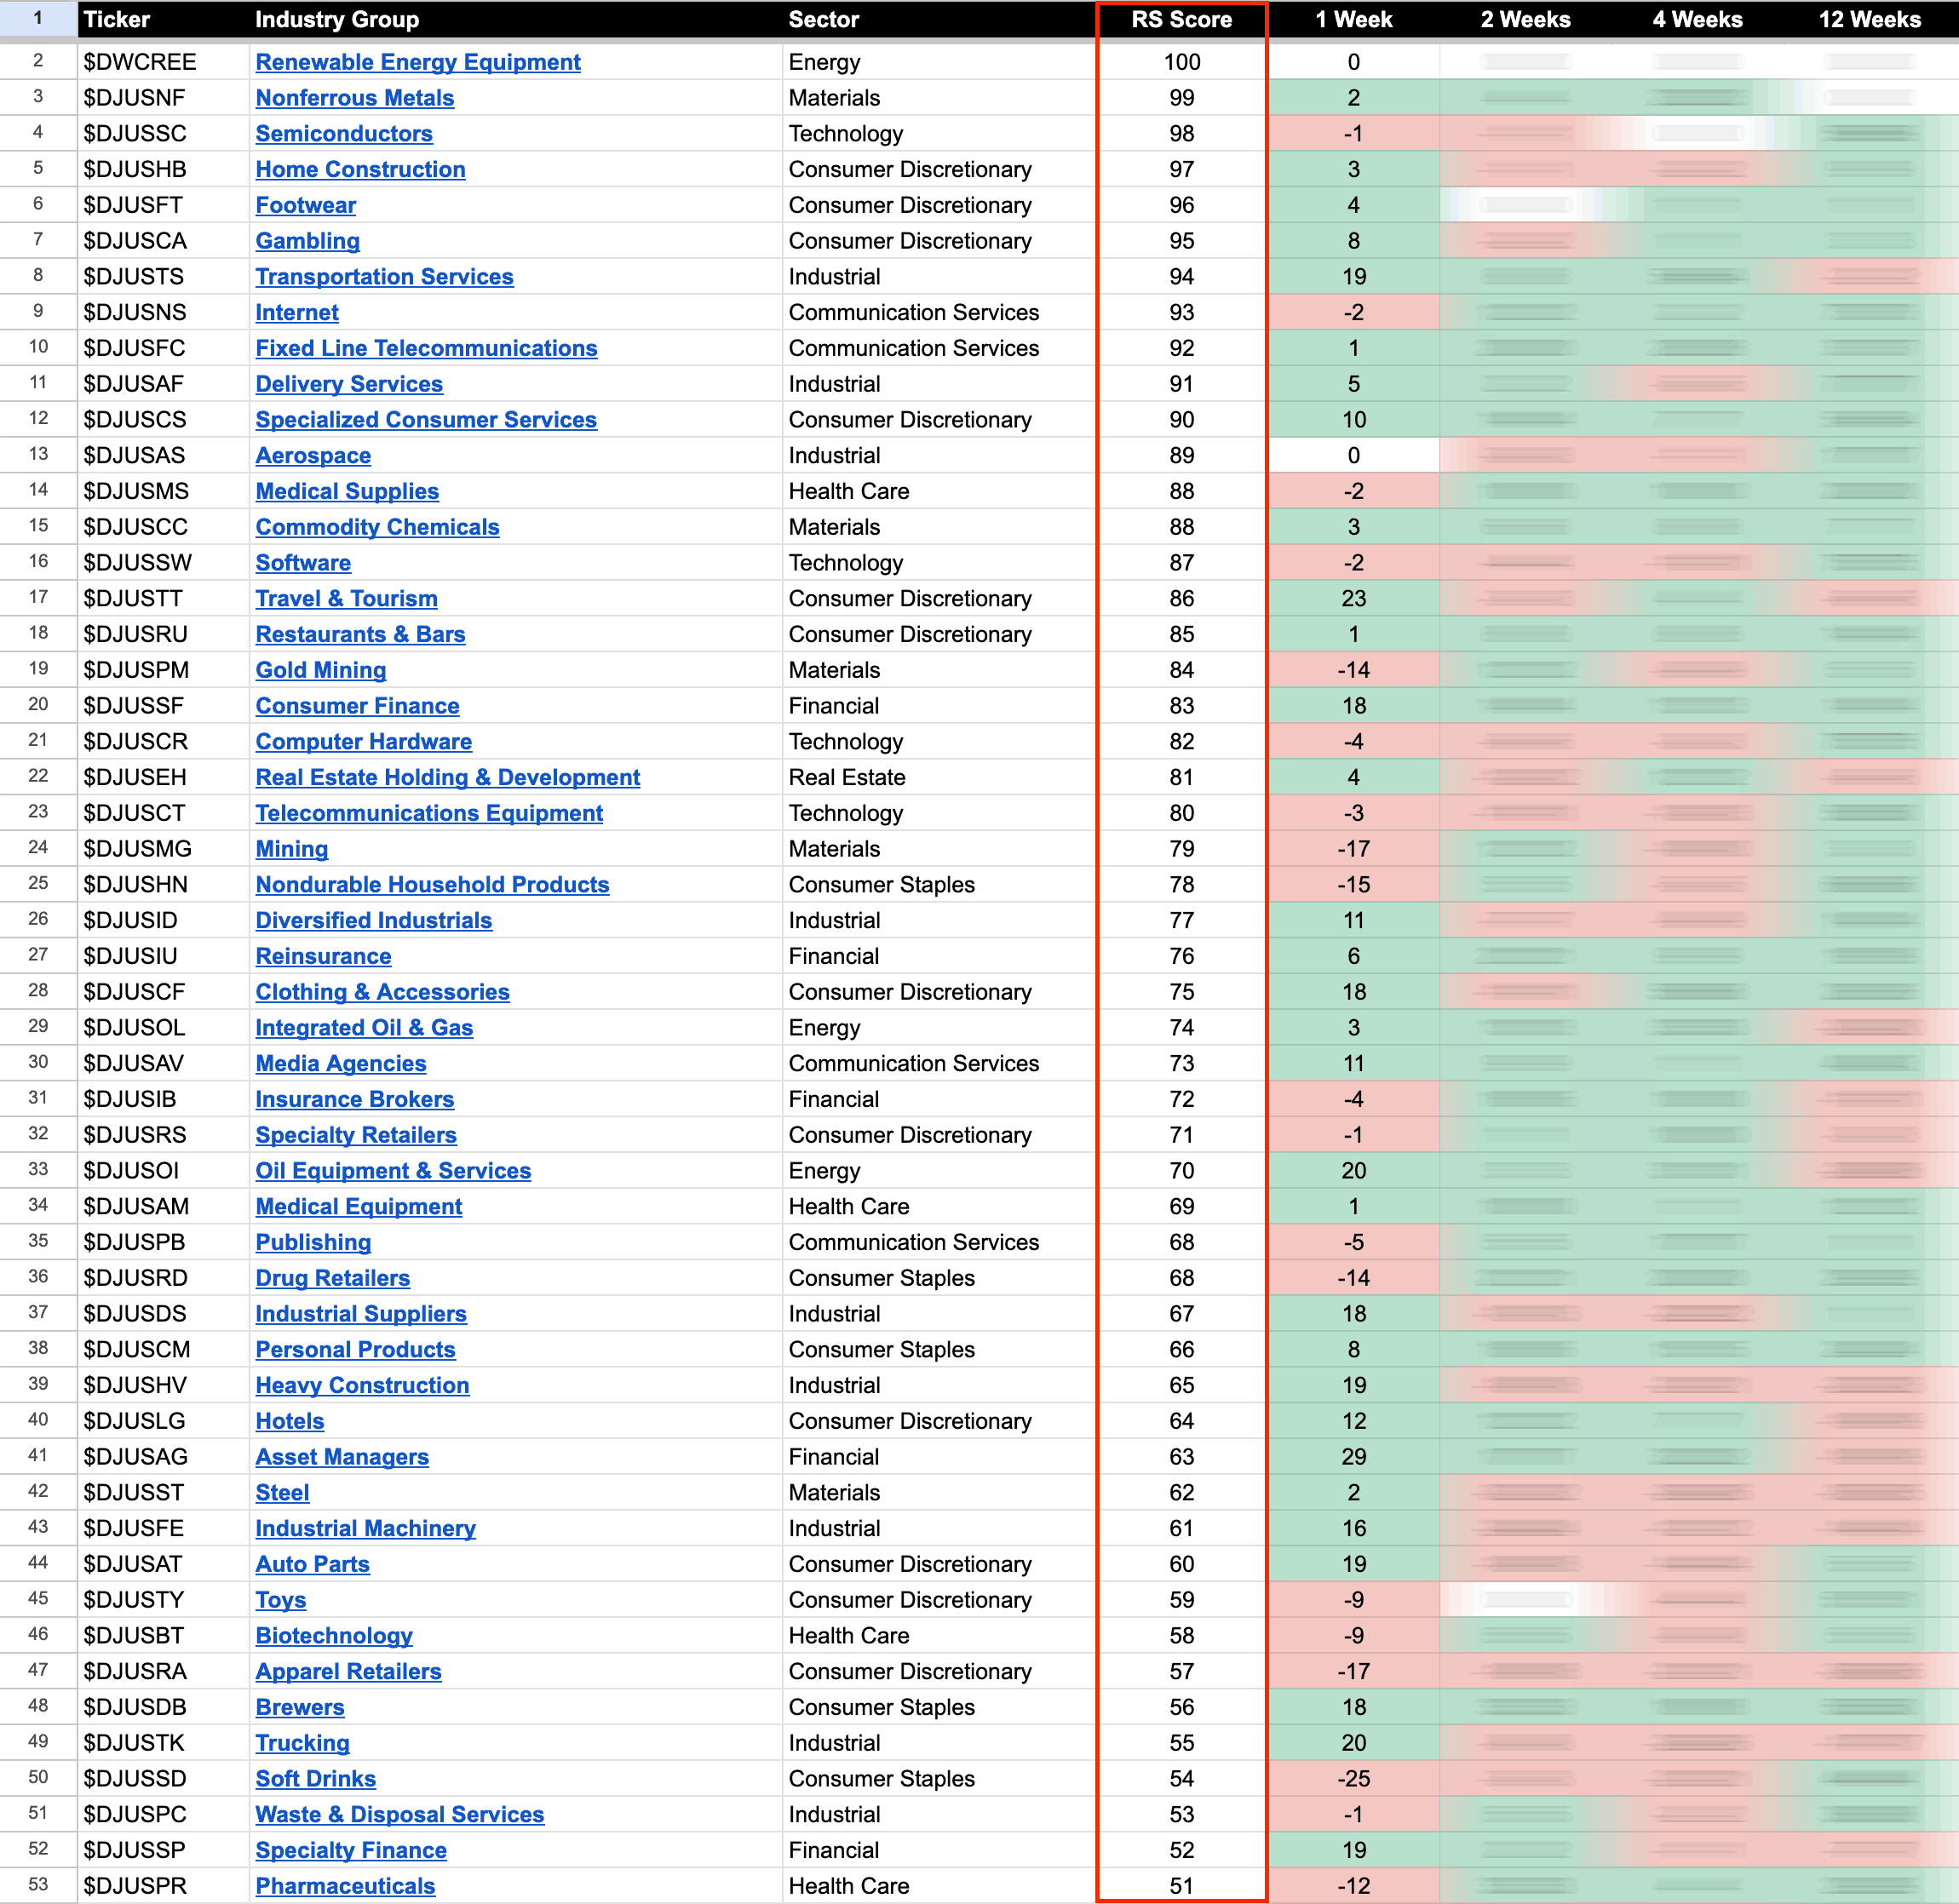
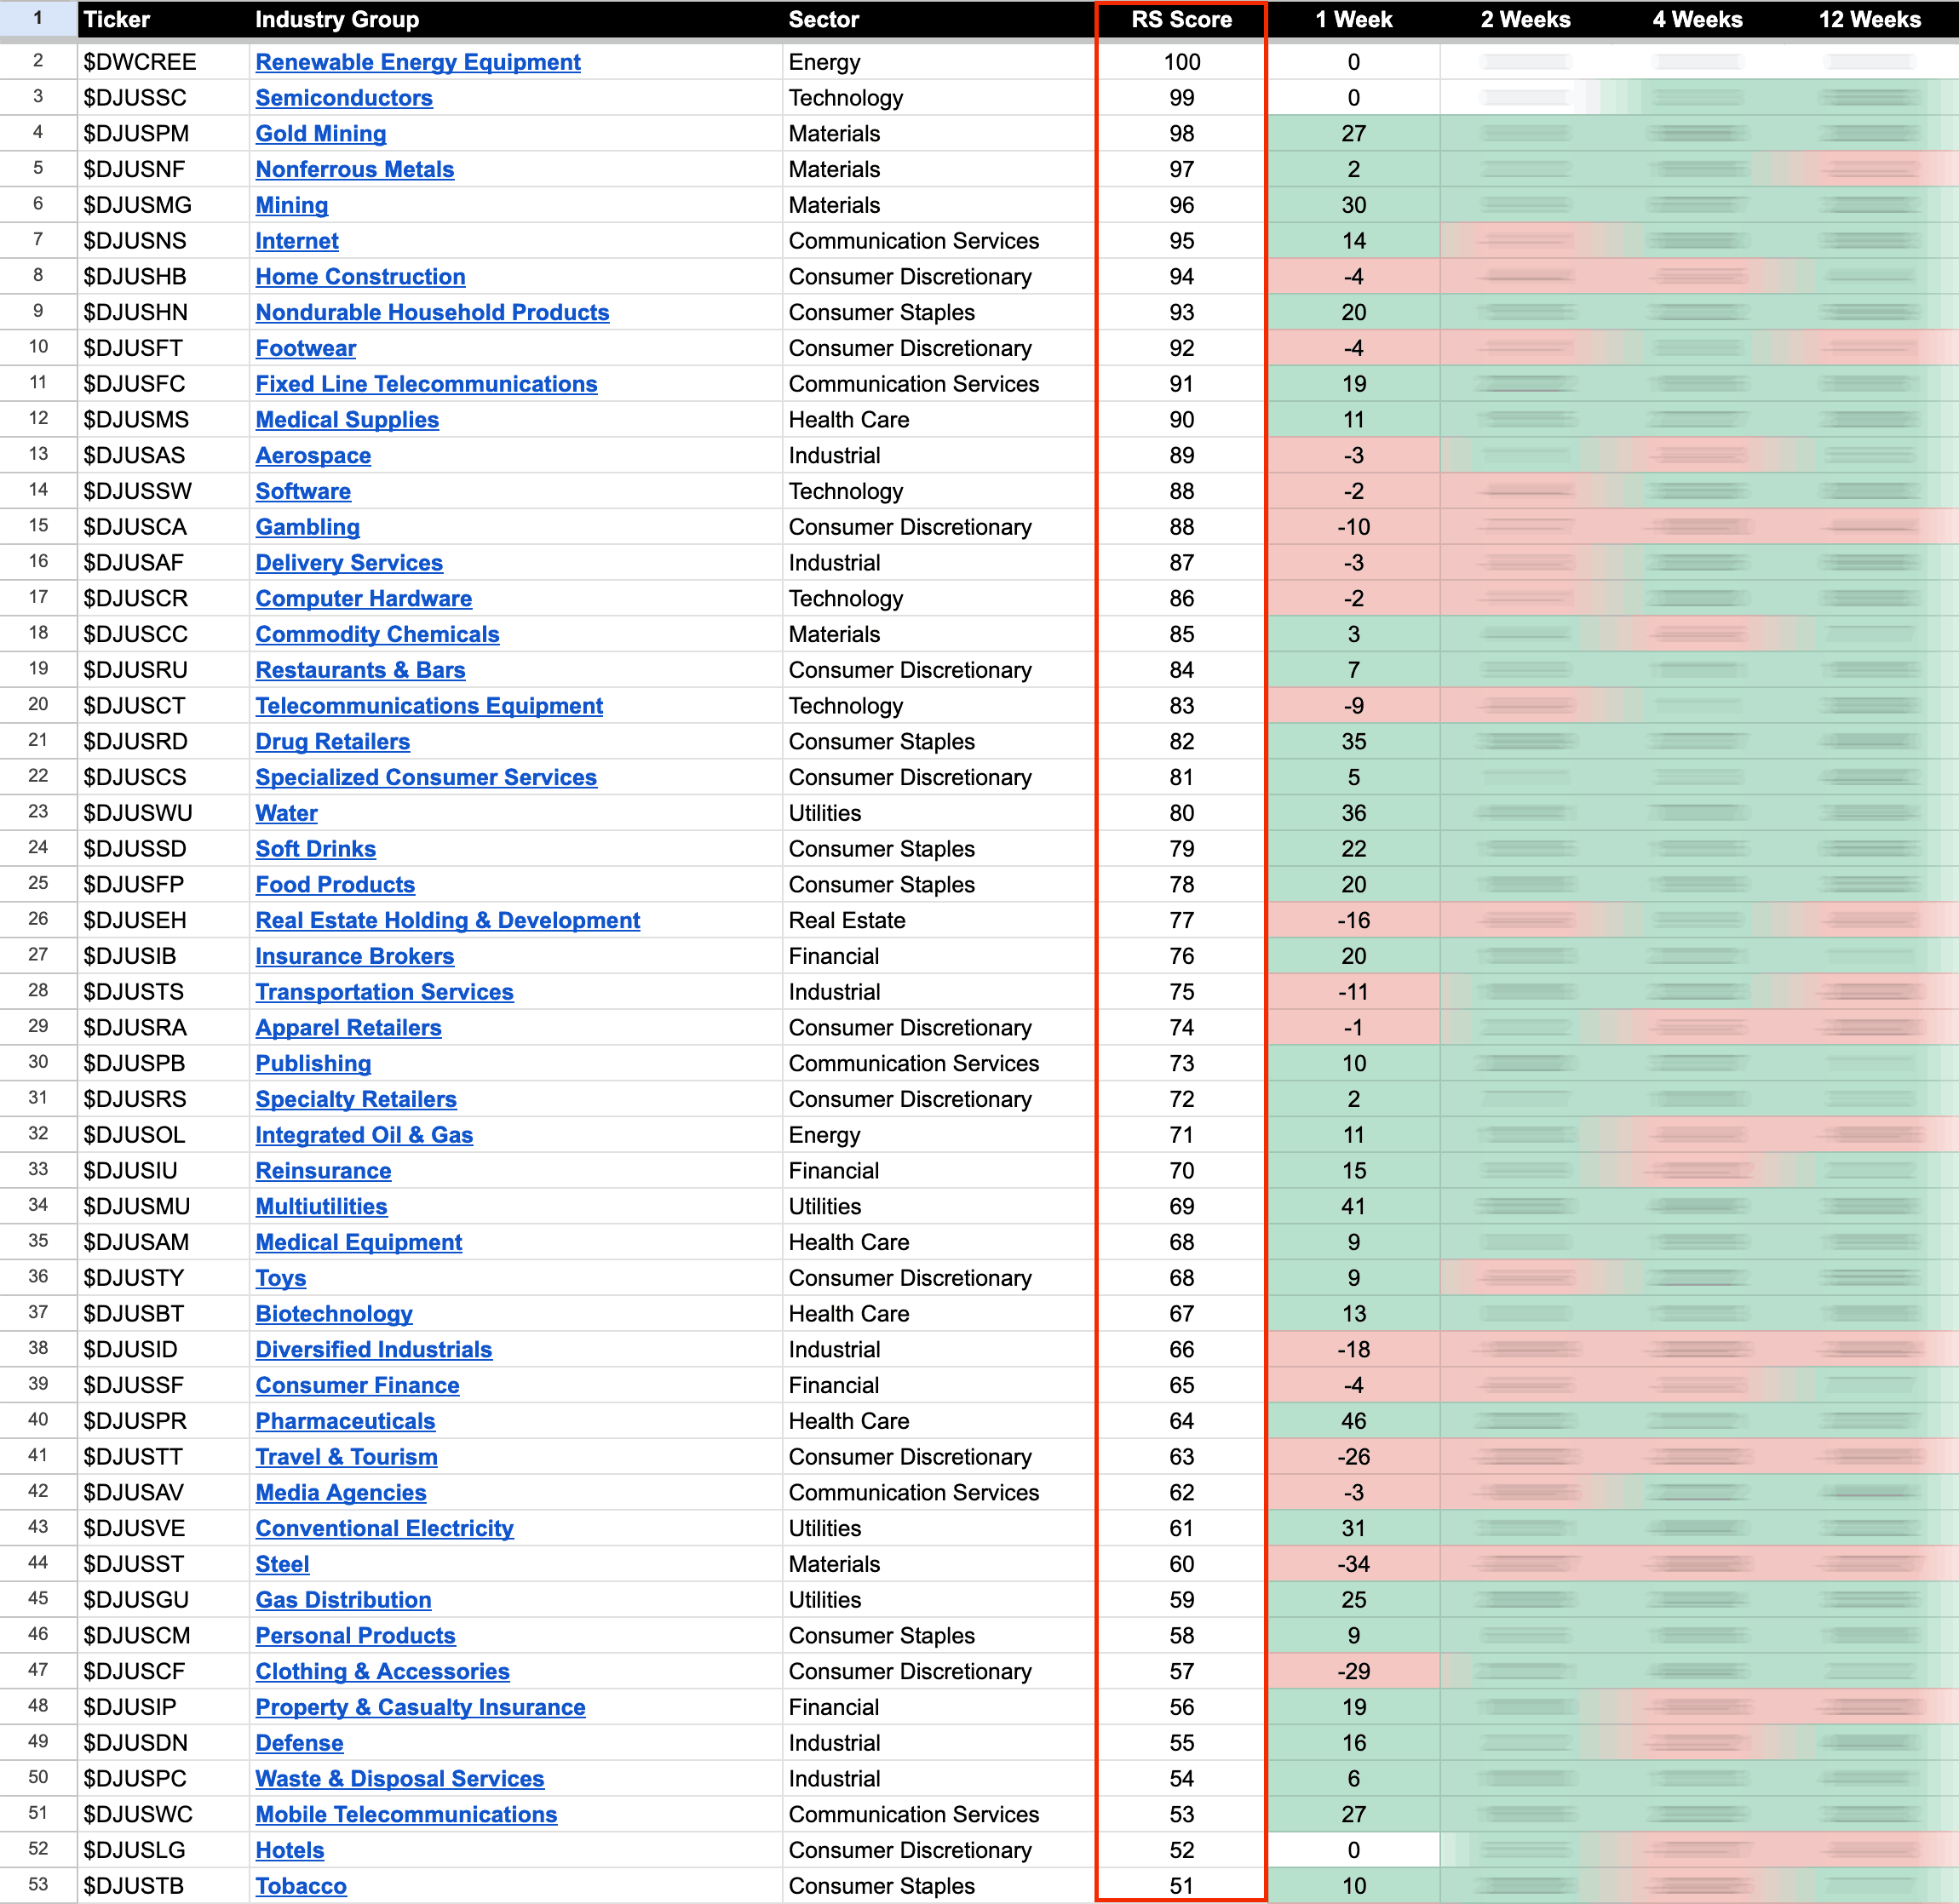
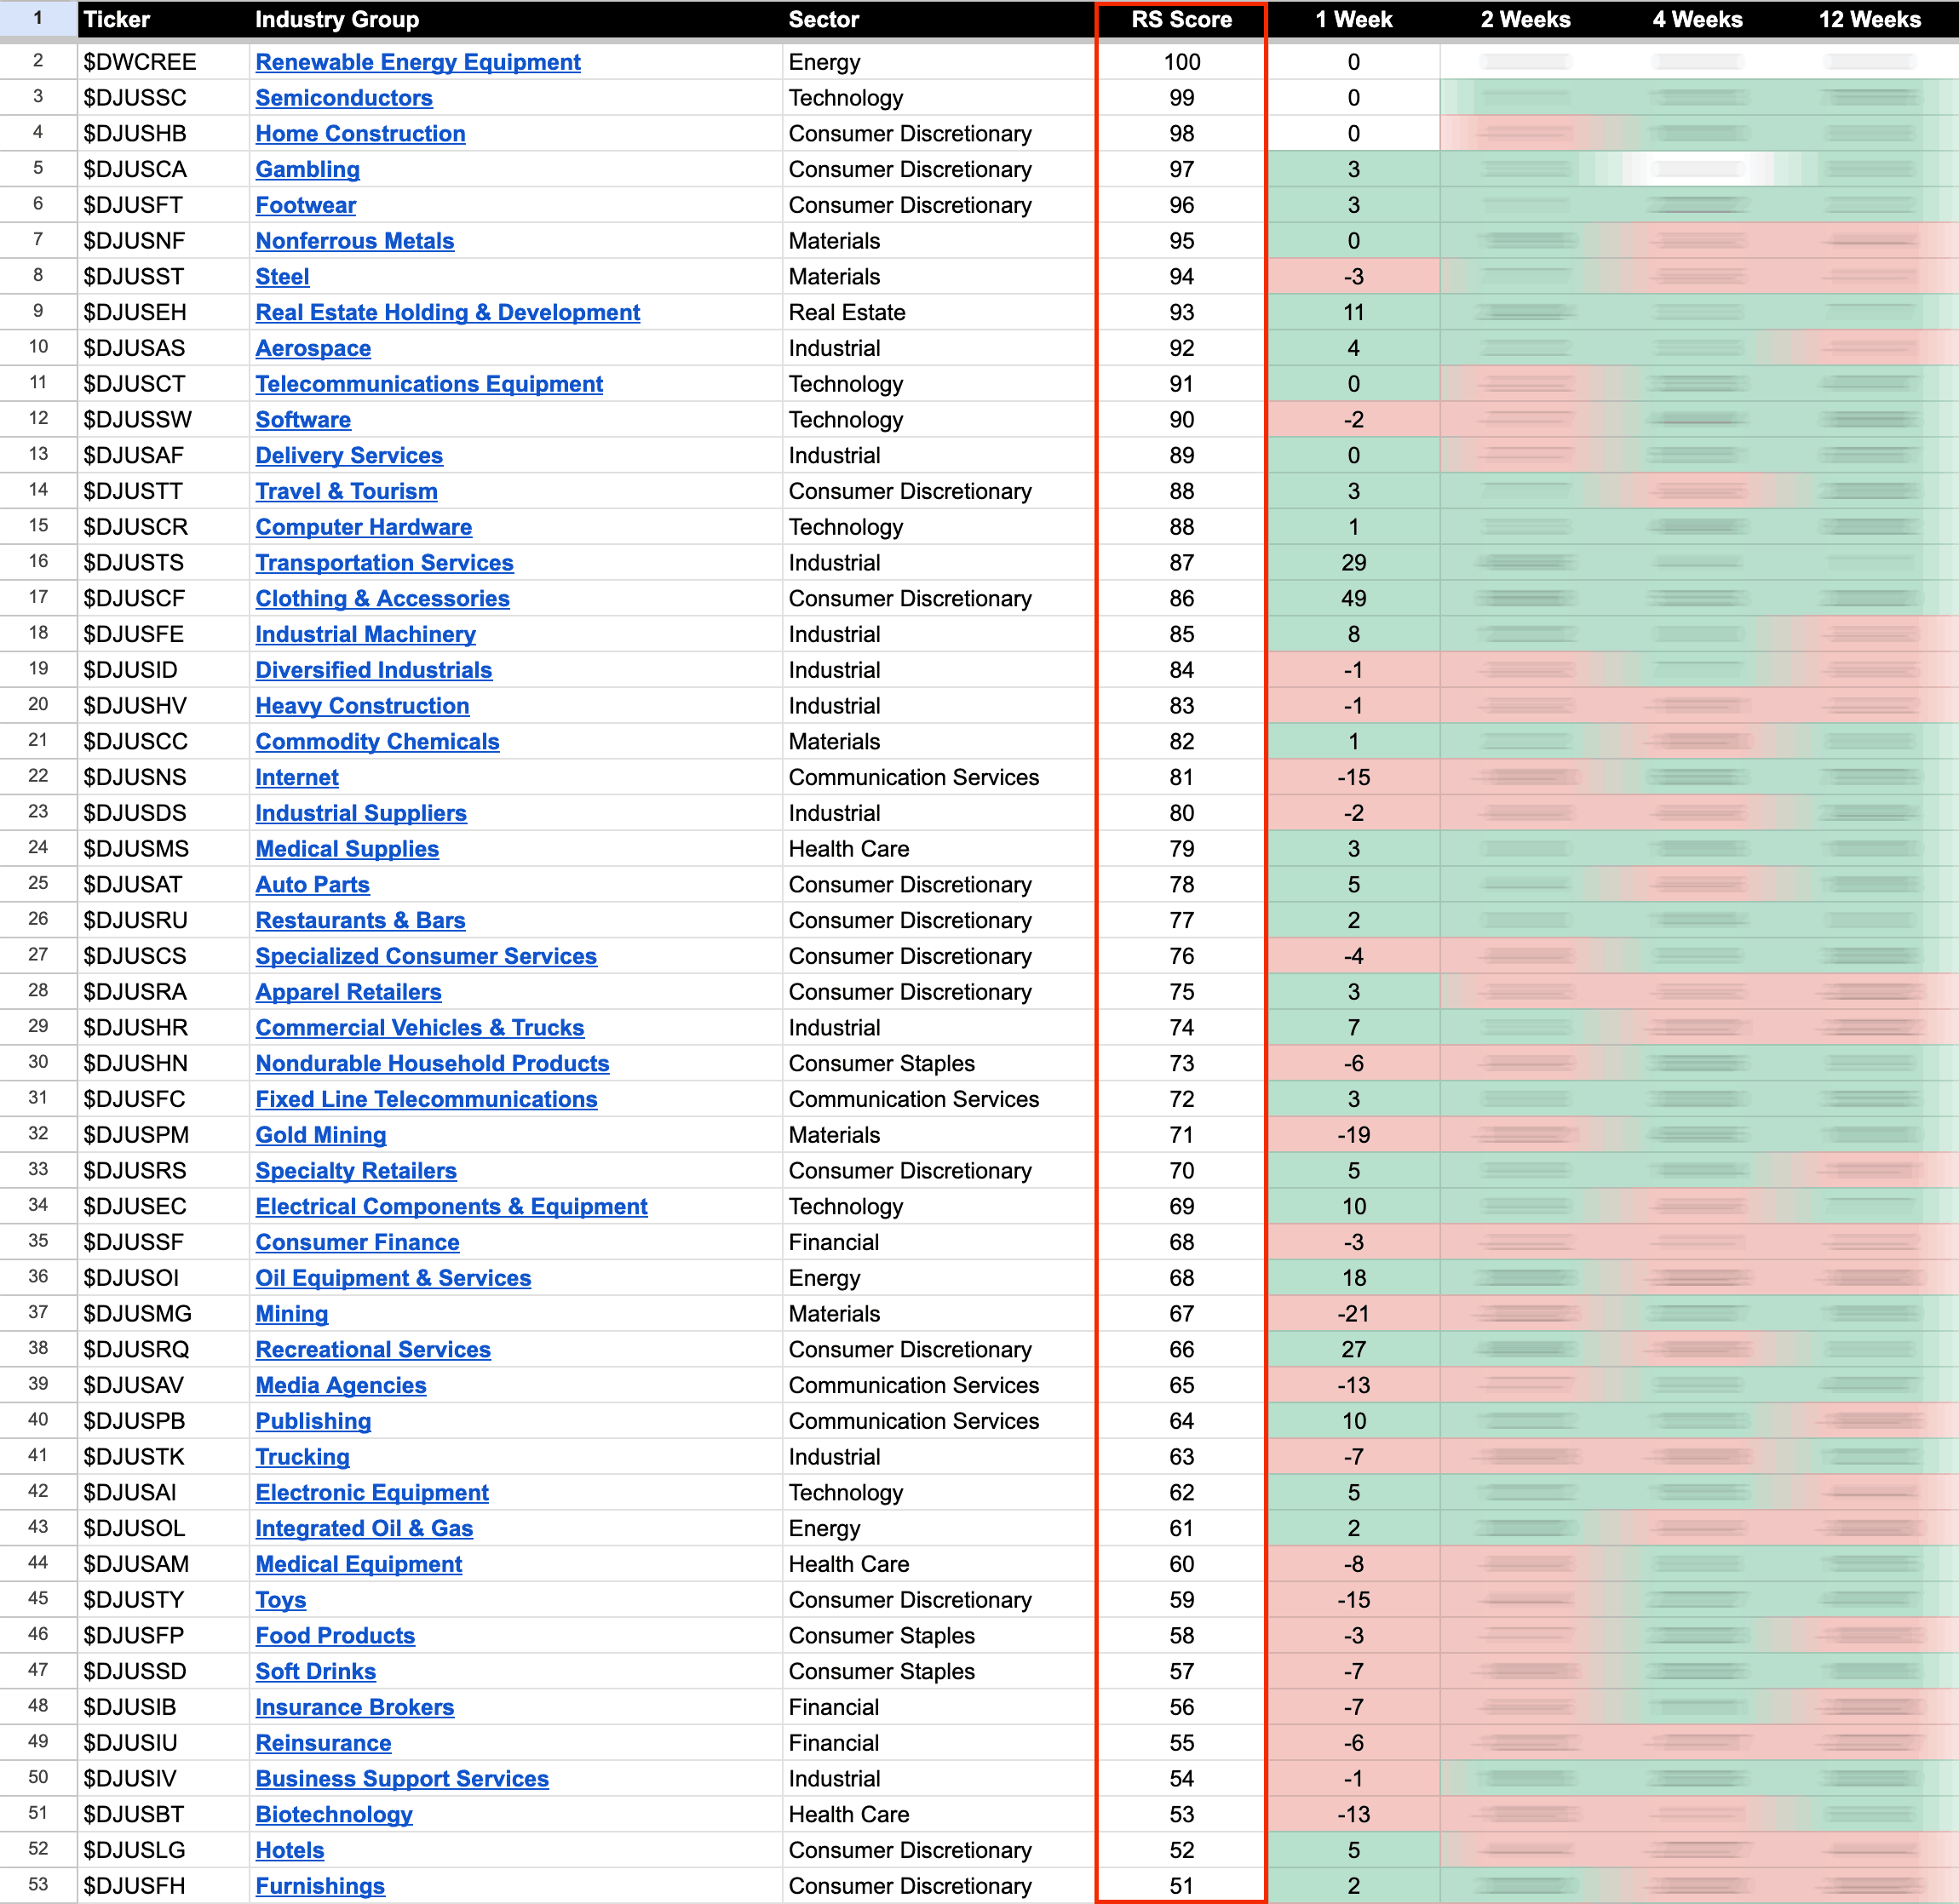
US Stocks Industry Groups Relative Strength Rankings
The purpose of the Relative Strength (RS) tables is to track the short, medium and long term RS changes of the individual groups to find the new leadership earlier than the crowd...
Read More
09 April, 2023
Stage Analysis Members Video – 9 April 2023 (1hr 21mins)
The Stage Analysis members weekend video this week begins with a feature on the mega cap stocks, as many are attempting to move into early Stage 2. Then the more regular member content covering the major US stock market indexes update, Futures stock charts, US Stocks Industry Groups Relative Strength (RS) Rankings...
Read More
08 April, 2023
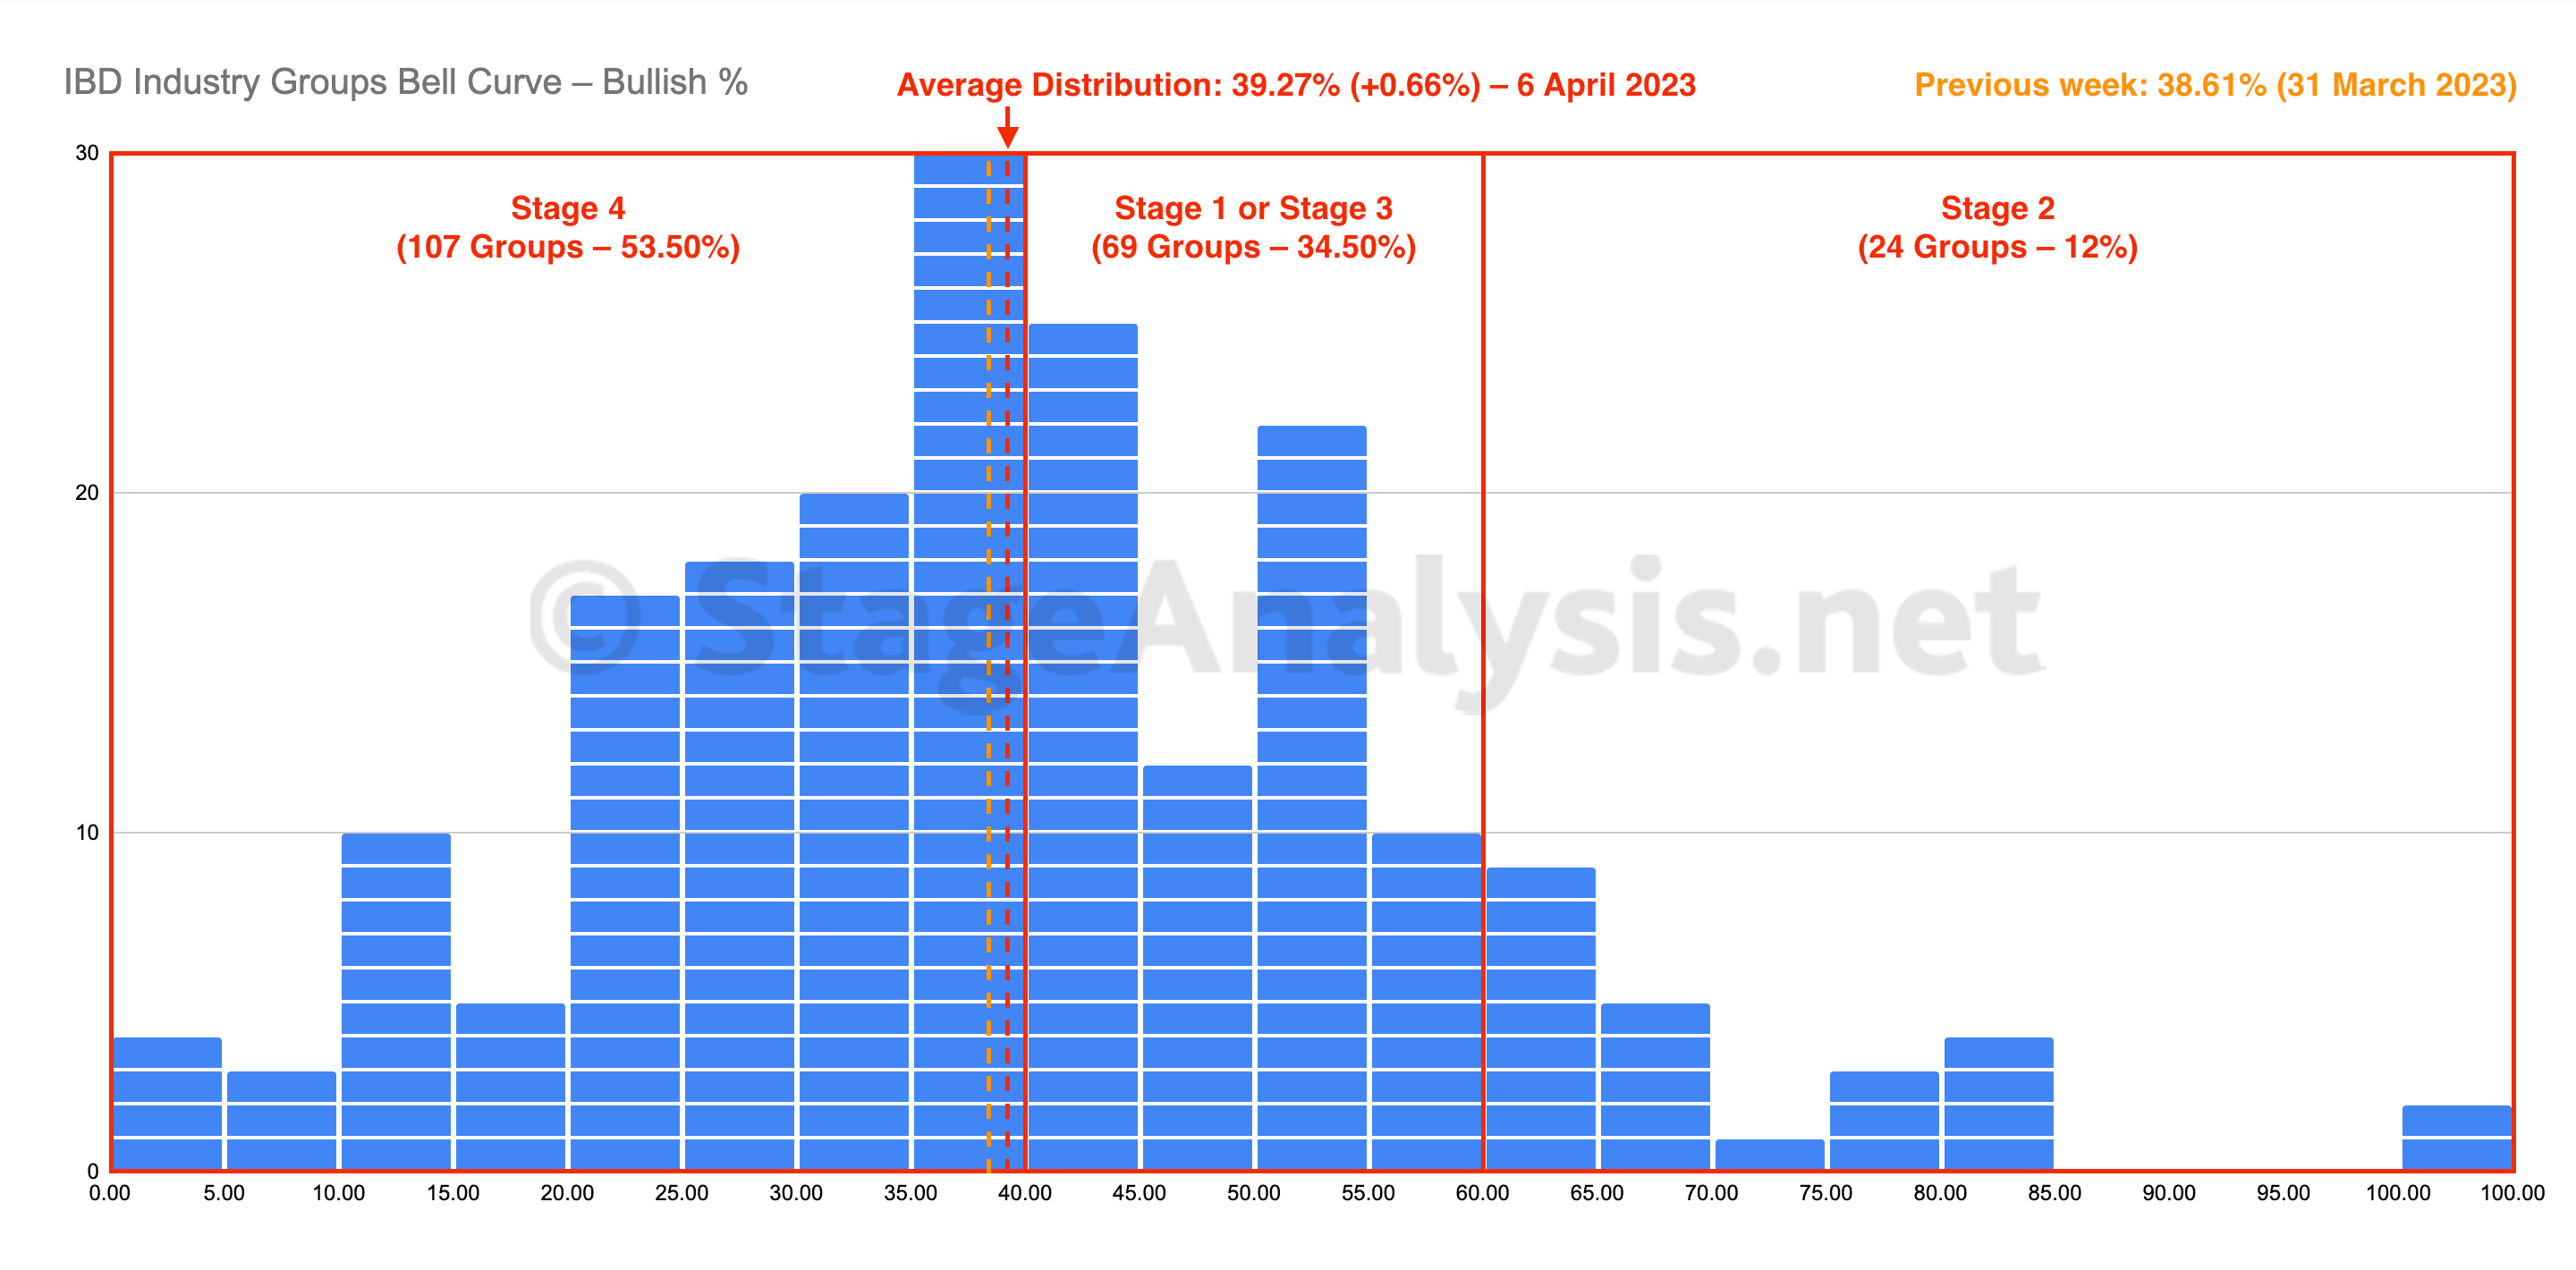
IBD Industry Groups Bell Curve – Bullish Percent
The IBD Industry Groups Bell Curve advanced slightly by 0.66% to finish the week at 39.27%. The amount of groups in Stages 1,2,3 and 4 remained unchanged...
Read More
06 April, 2023
US Stocks Industry Groups Relative Strength Rankings
The purpose of the Relative Strength (RS) tables is to track the short, medium and long term RS changes of the individual groups to find the new leadership earlier than the crowd...
Read More
02 April, 2023
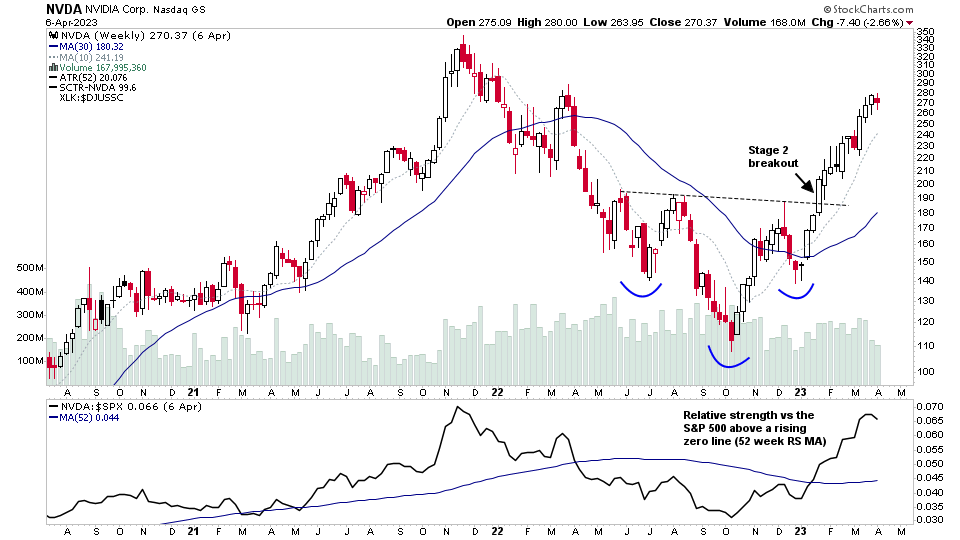
Stage Analysis Members Video – 2 April 2023 (1hr 17mins)
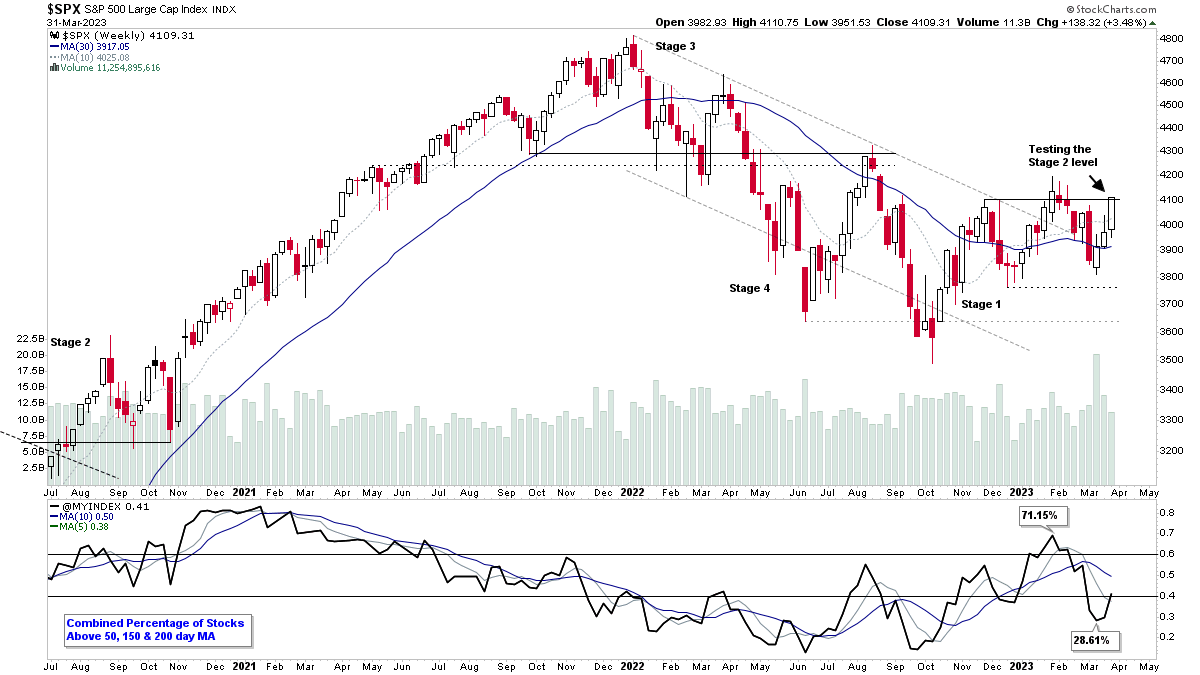
The Stage Analysis members weekend video this week features analysis of the Stage 2 breakout attempt in the Nasdaq 100, and test of the Stage 2 level by the S&P 500. Also discussion of the futures charts, US Stocks Industry Groups RS Rankings...
Read More
01 April, 2023
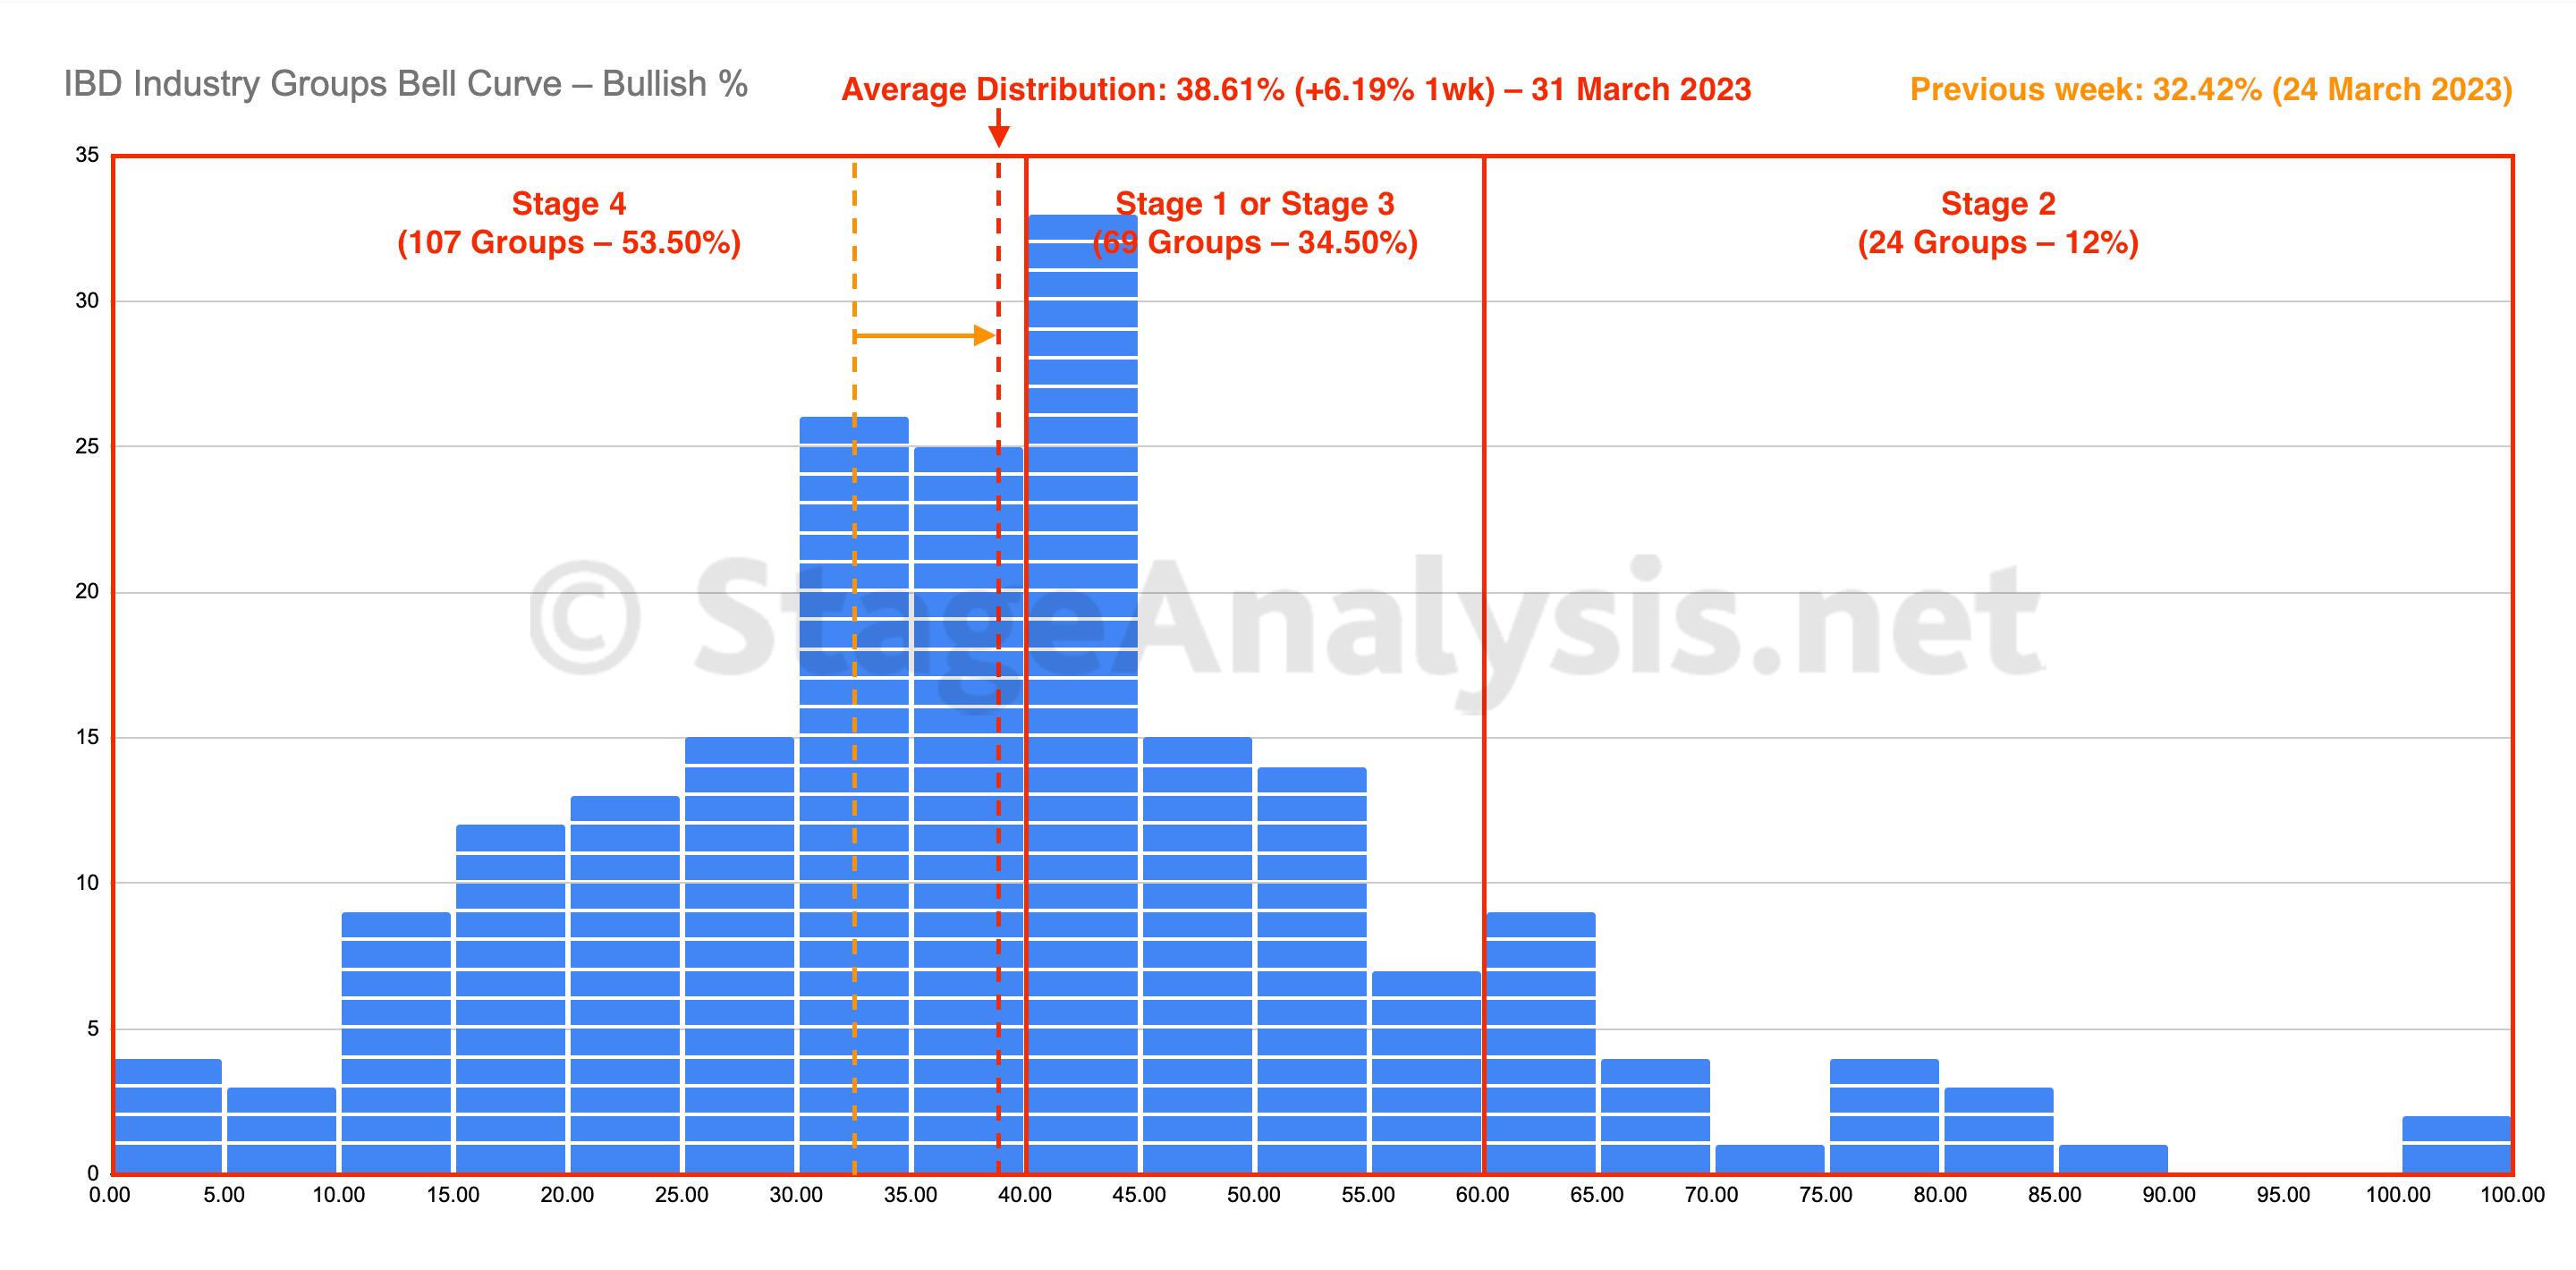
IBD Industry Groups Bell Curve – Bullish Percent
The IBD Industry Groups Bell Curve reversed its decline with a rebound this week of +6.19%, to finish at 38.61%. The amount of groups in Stage 4 decreased by 35 (-17.50%), and the amount of groups in Stage 2 increased by 14 (+7%), while the amount groups in Stage 1 or Stage 3 increased by 21 (+10.50%).
Read More
31 March, 2023
US Stocks Industry Groups Relative Strength Rankings
The purpose of the Relative Strength (RS) tables is to track the short, medium and long term RS changes of the individual groups to find the new leadership earlier than the crowd...
Read More
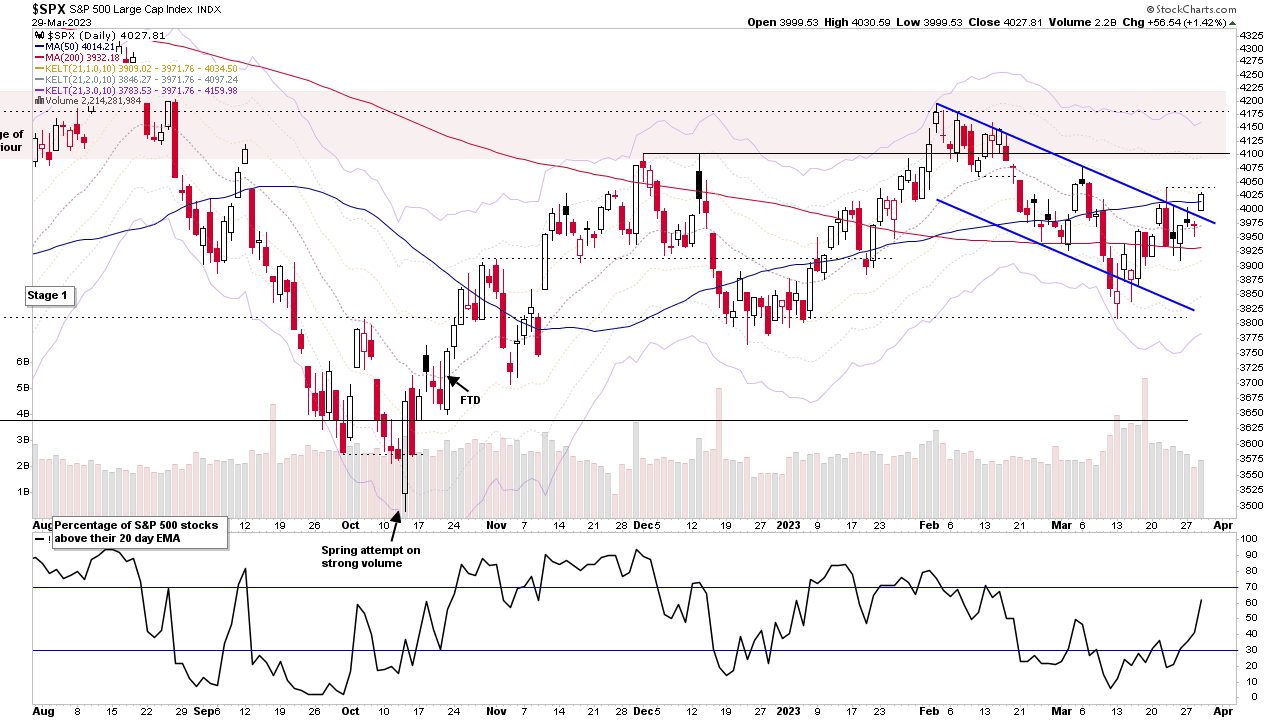
29 March, 2023
Stage Analysis Members Video – 29 March 2023 (1hr 4mins)
The Stage Analysis members midweek video discussing the improvements in the short-term market breadth indicators, the major market indexes. Stage Analysis of the mega cap stocks, and review of the banks position. Followed by discussion of the recent US watchlist stocks in more detail, and finishing off with a look at Bitcoin and Ethereum.
Read More
28 March, 2023
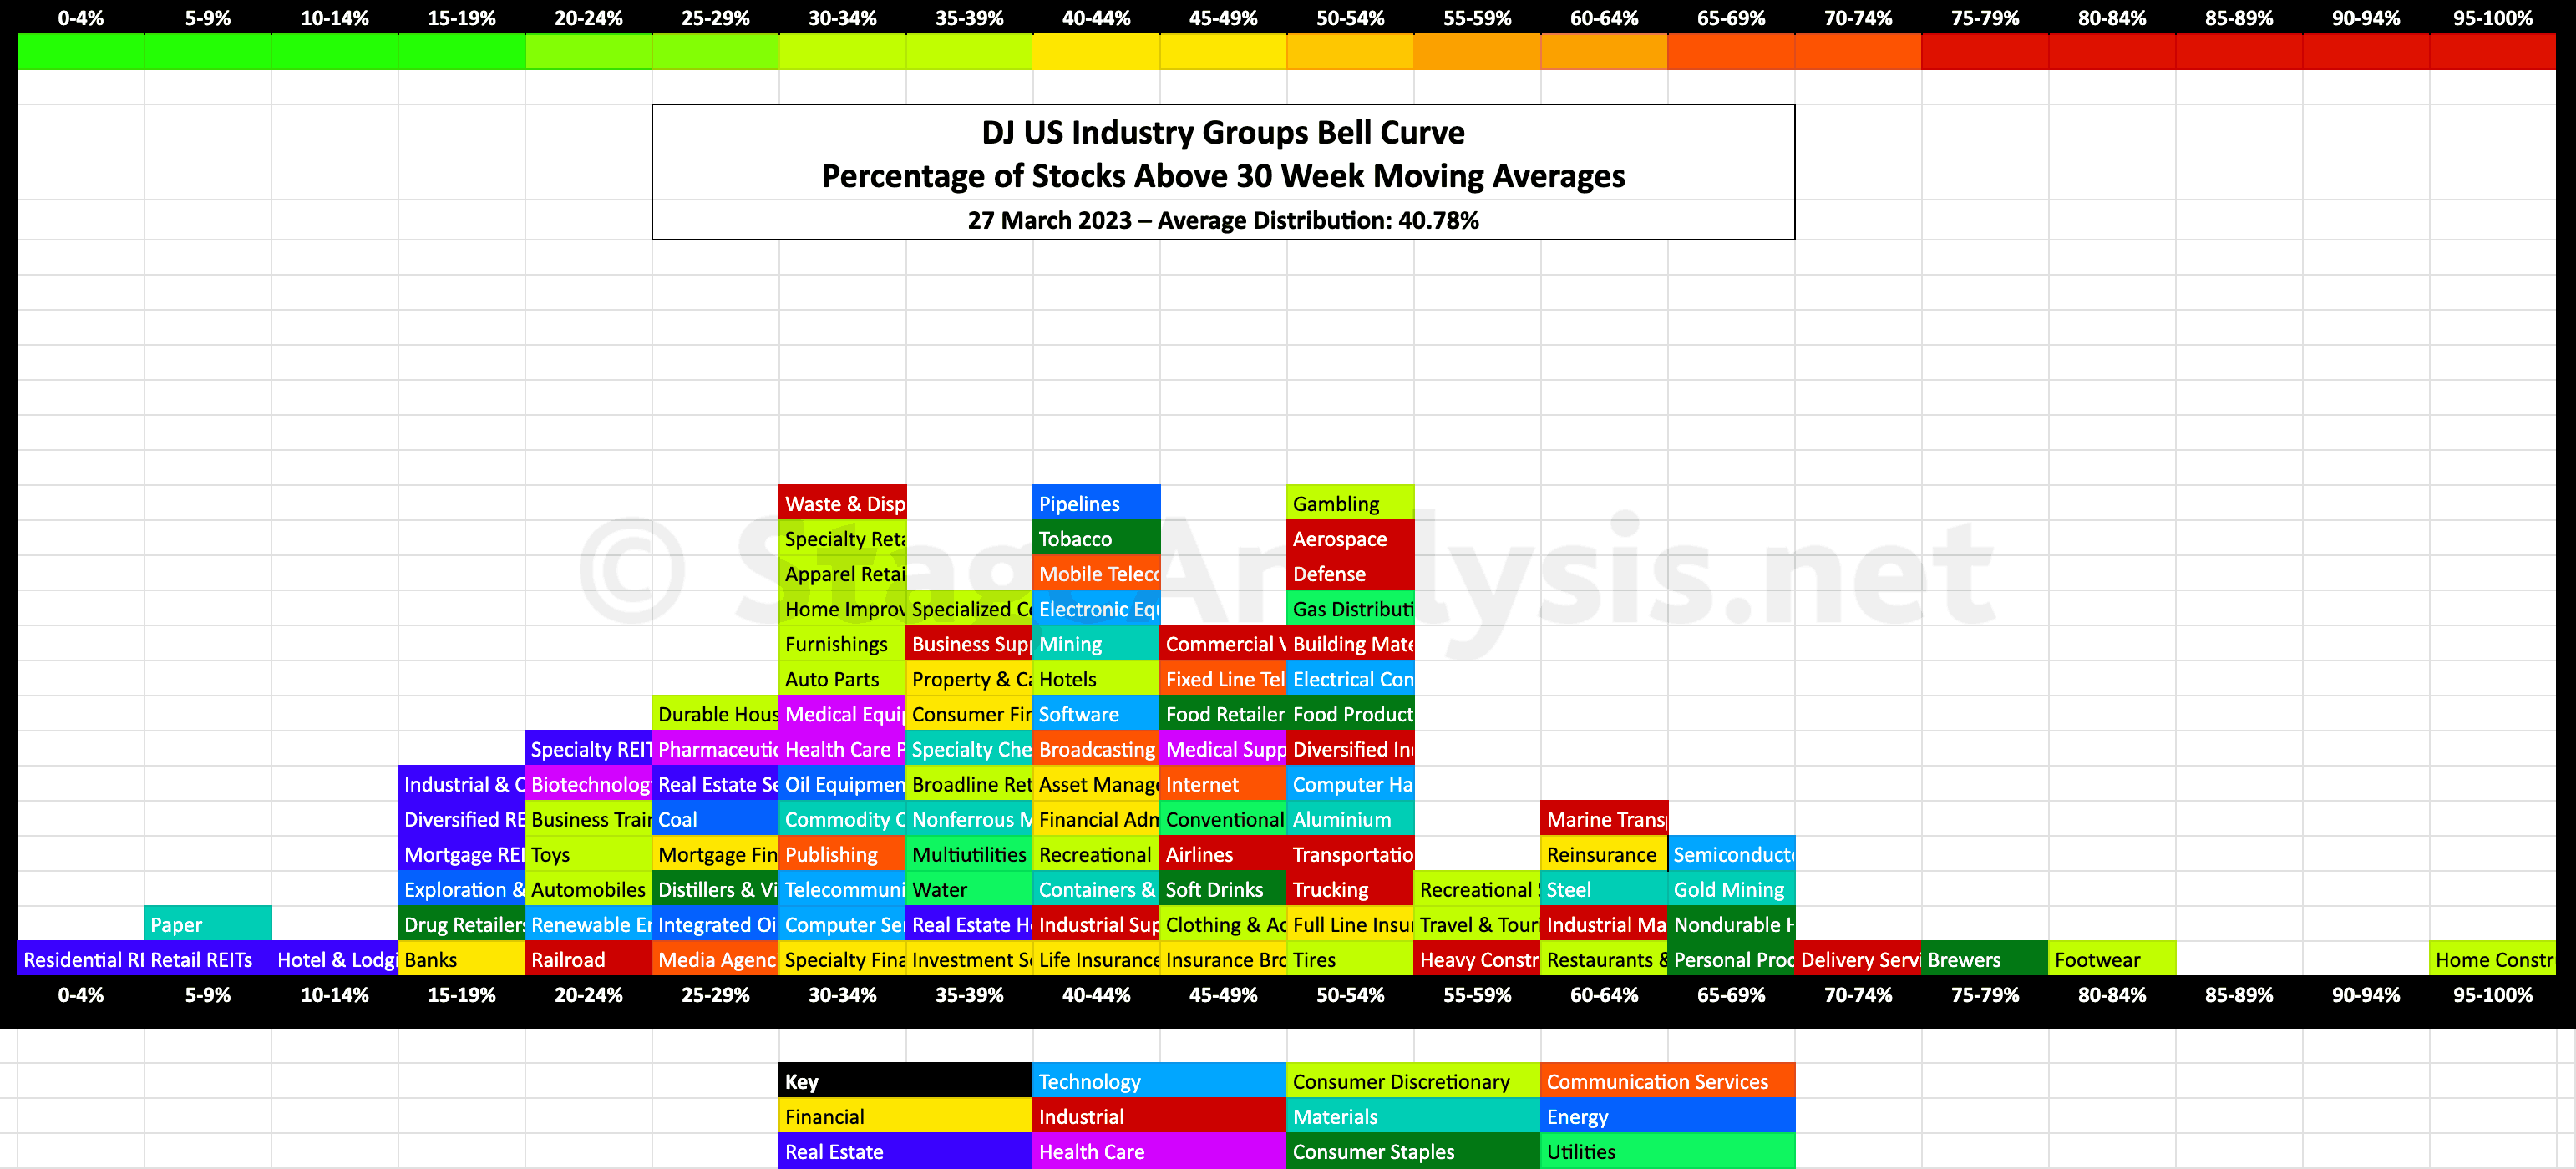
US Industry Groups Bell Curve – Exclusive to StageAnalysis.net
Exclusive graphic of the 104 Dow Jones Industry Groups showing the Percentage of Stocks Above 30 week MA in each group visualised as a Bell Curve chart...
Read More