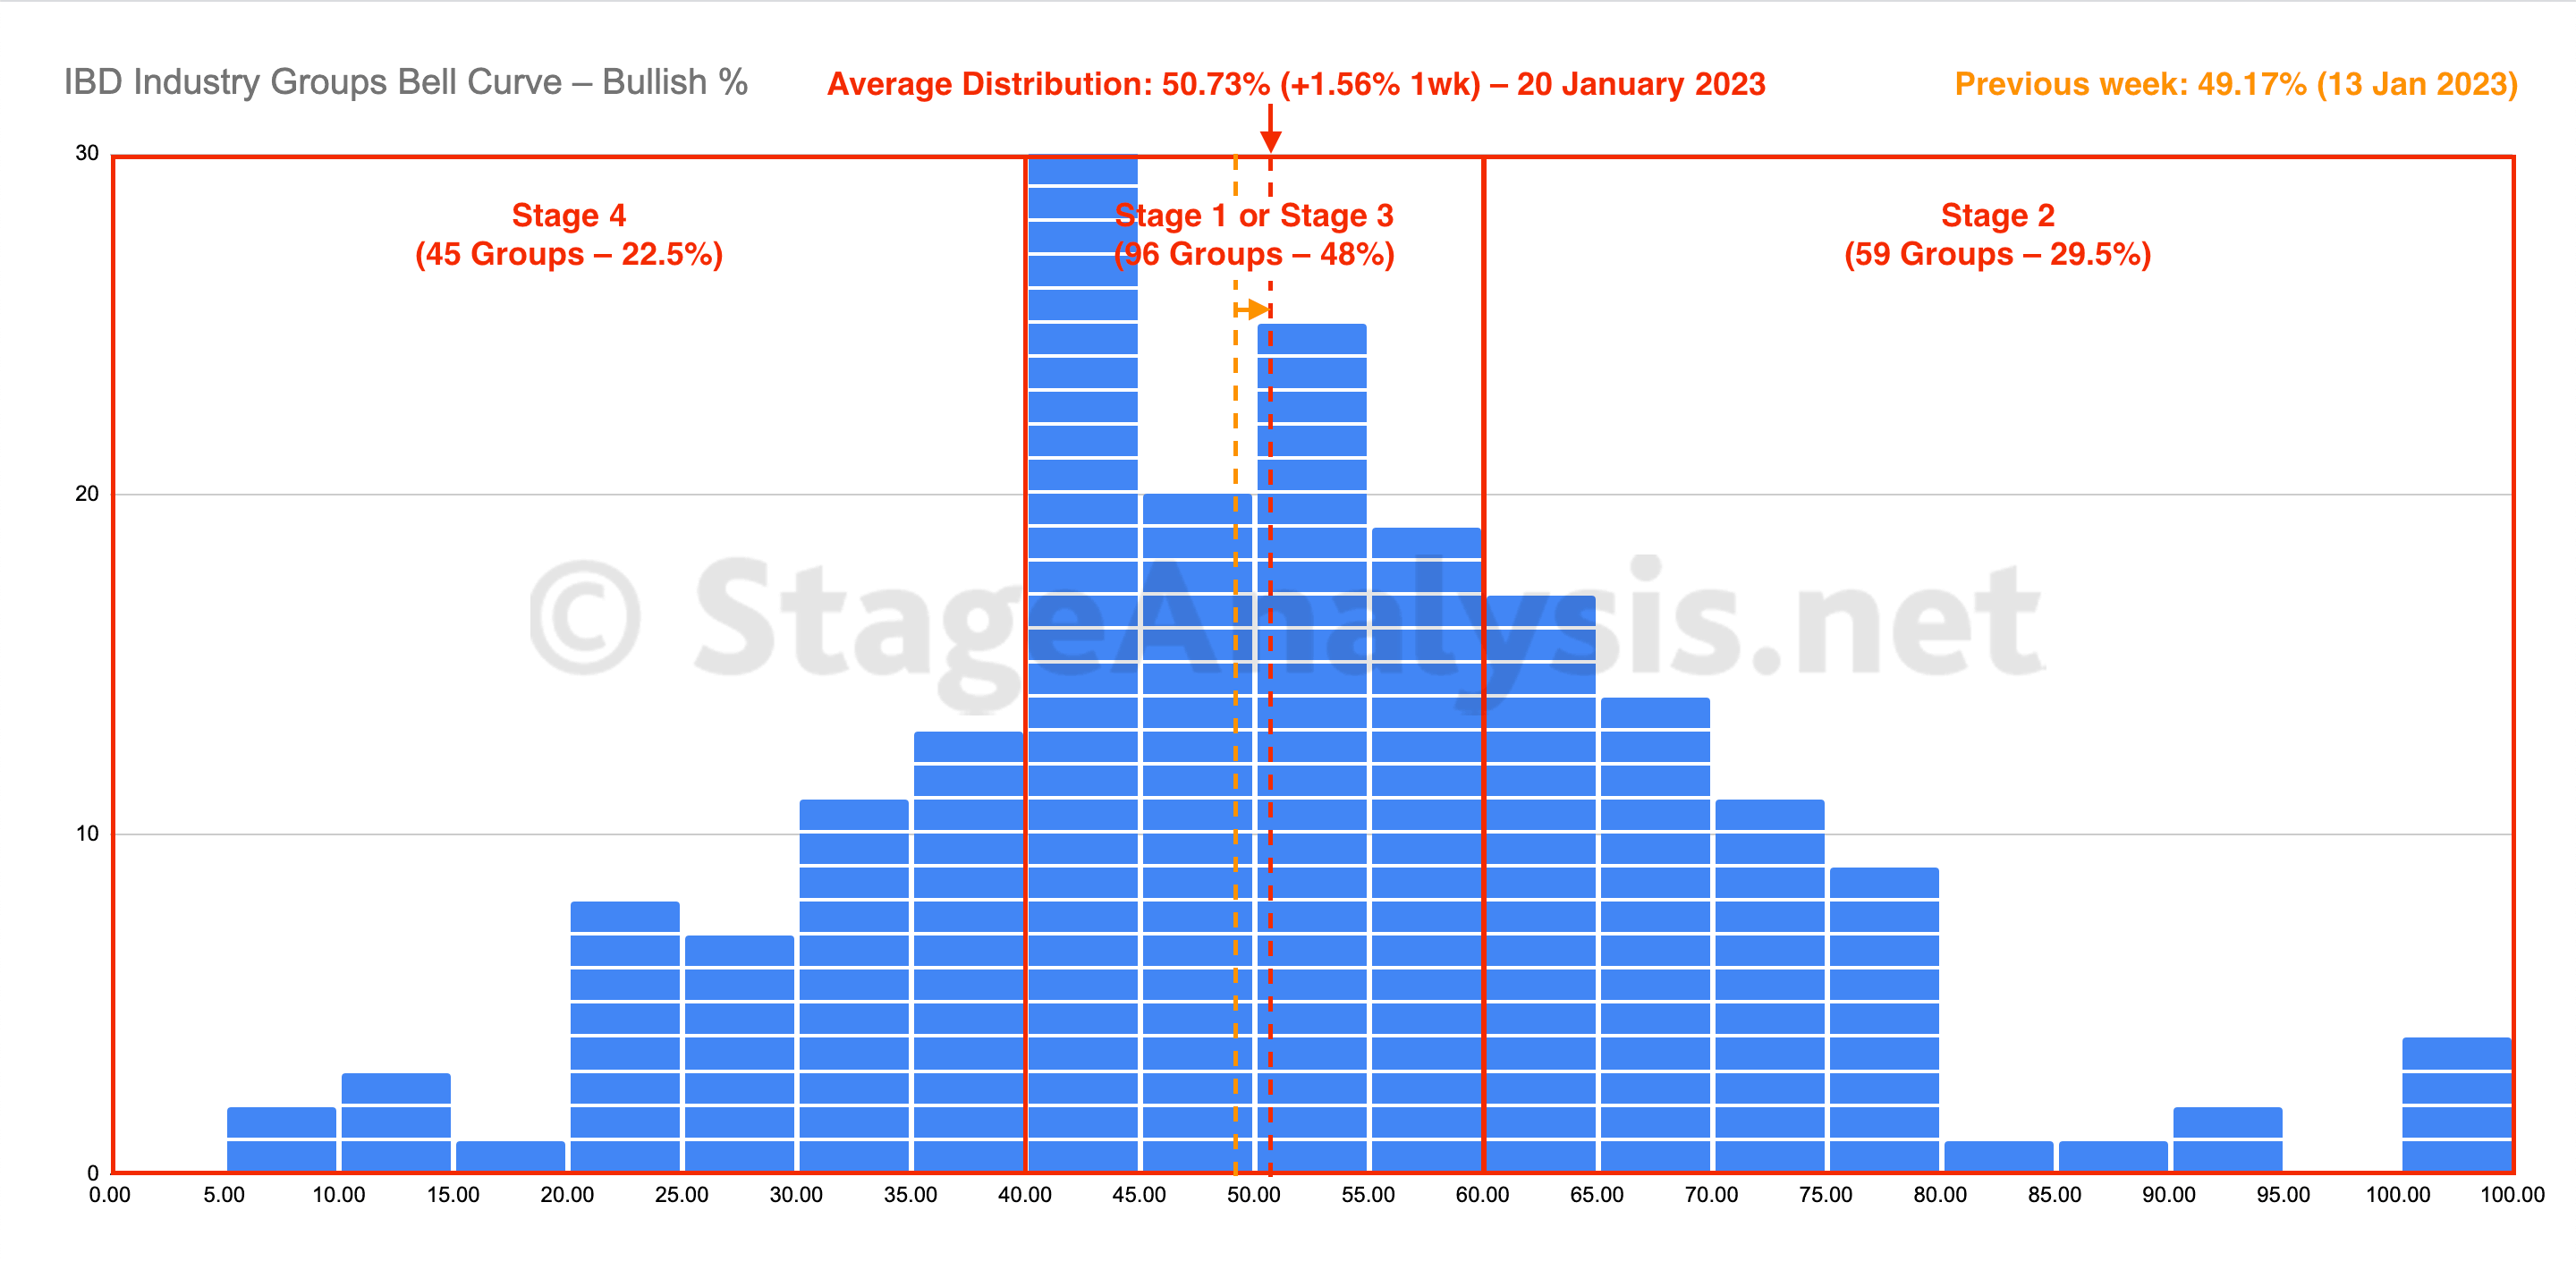
The IBD Industry Groups Bell Curve – Bullish Percent shows the few hundred industry groups plotted as a histogram chart and represents the percentage of stocks in each group that are on a point & figure (P&F) buy signal...
Read More

Blog
06 May, 2023
IBD Industry Groups Bell Curve – Bullish Percent
05 May, 2023
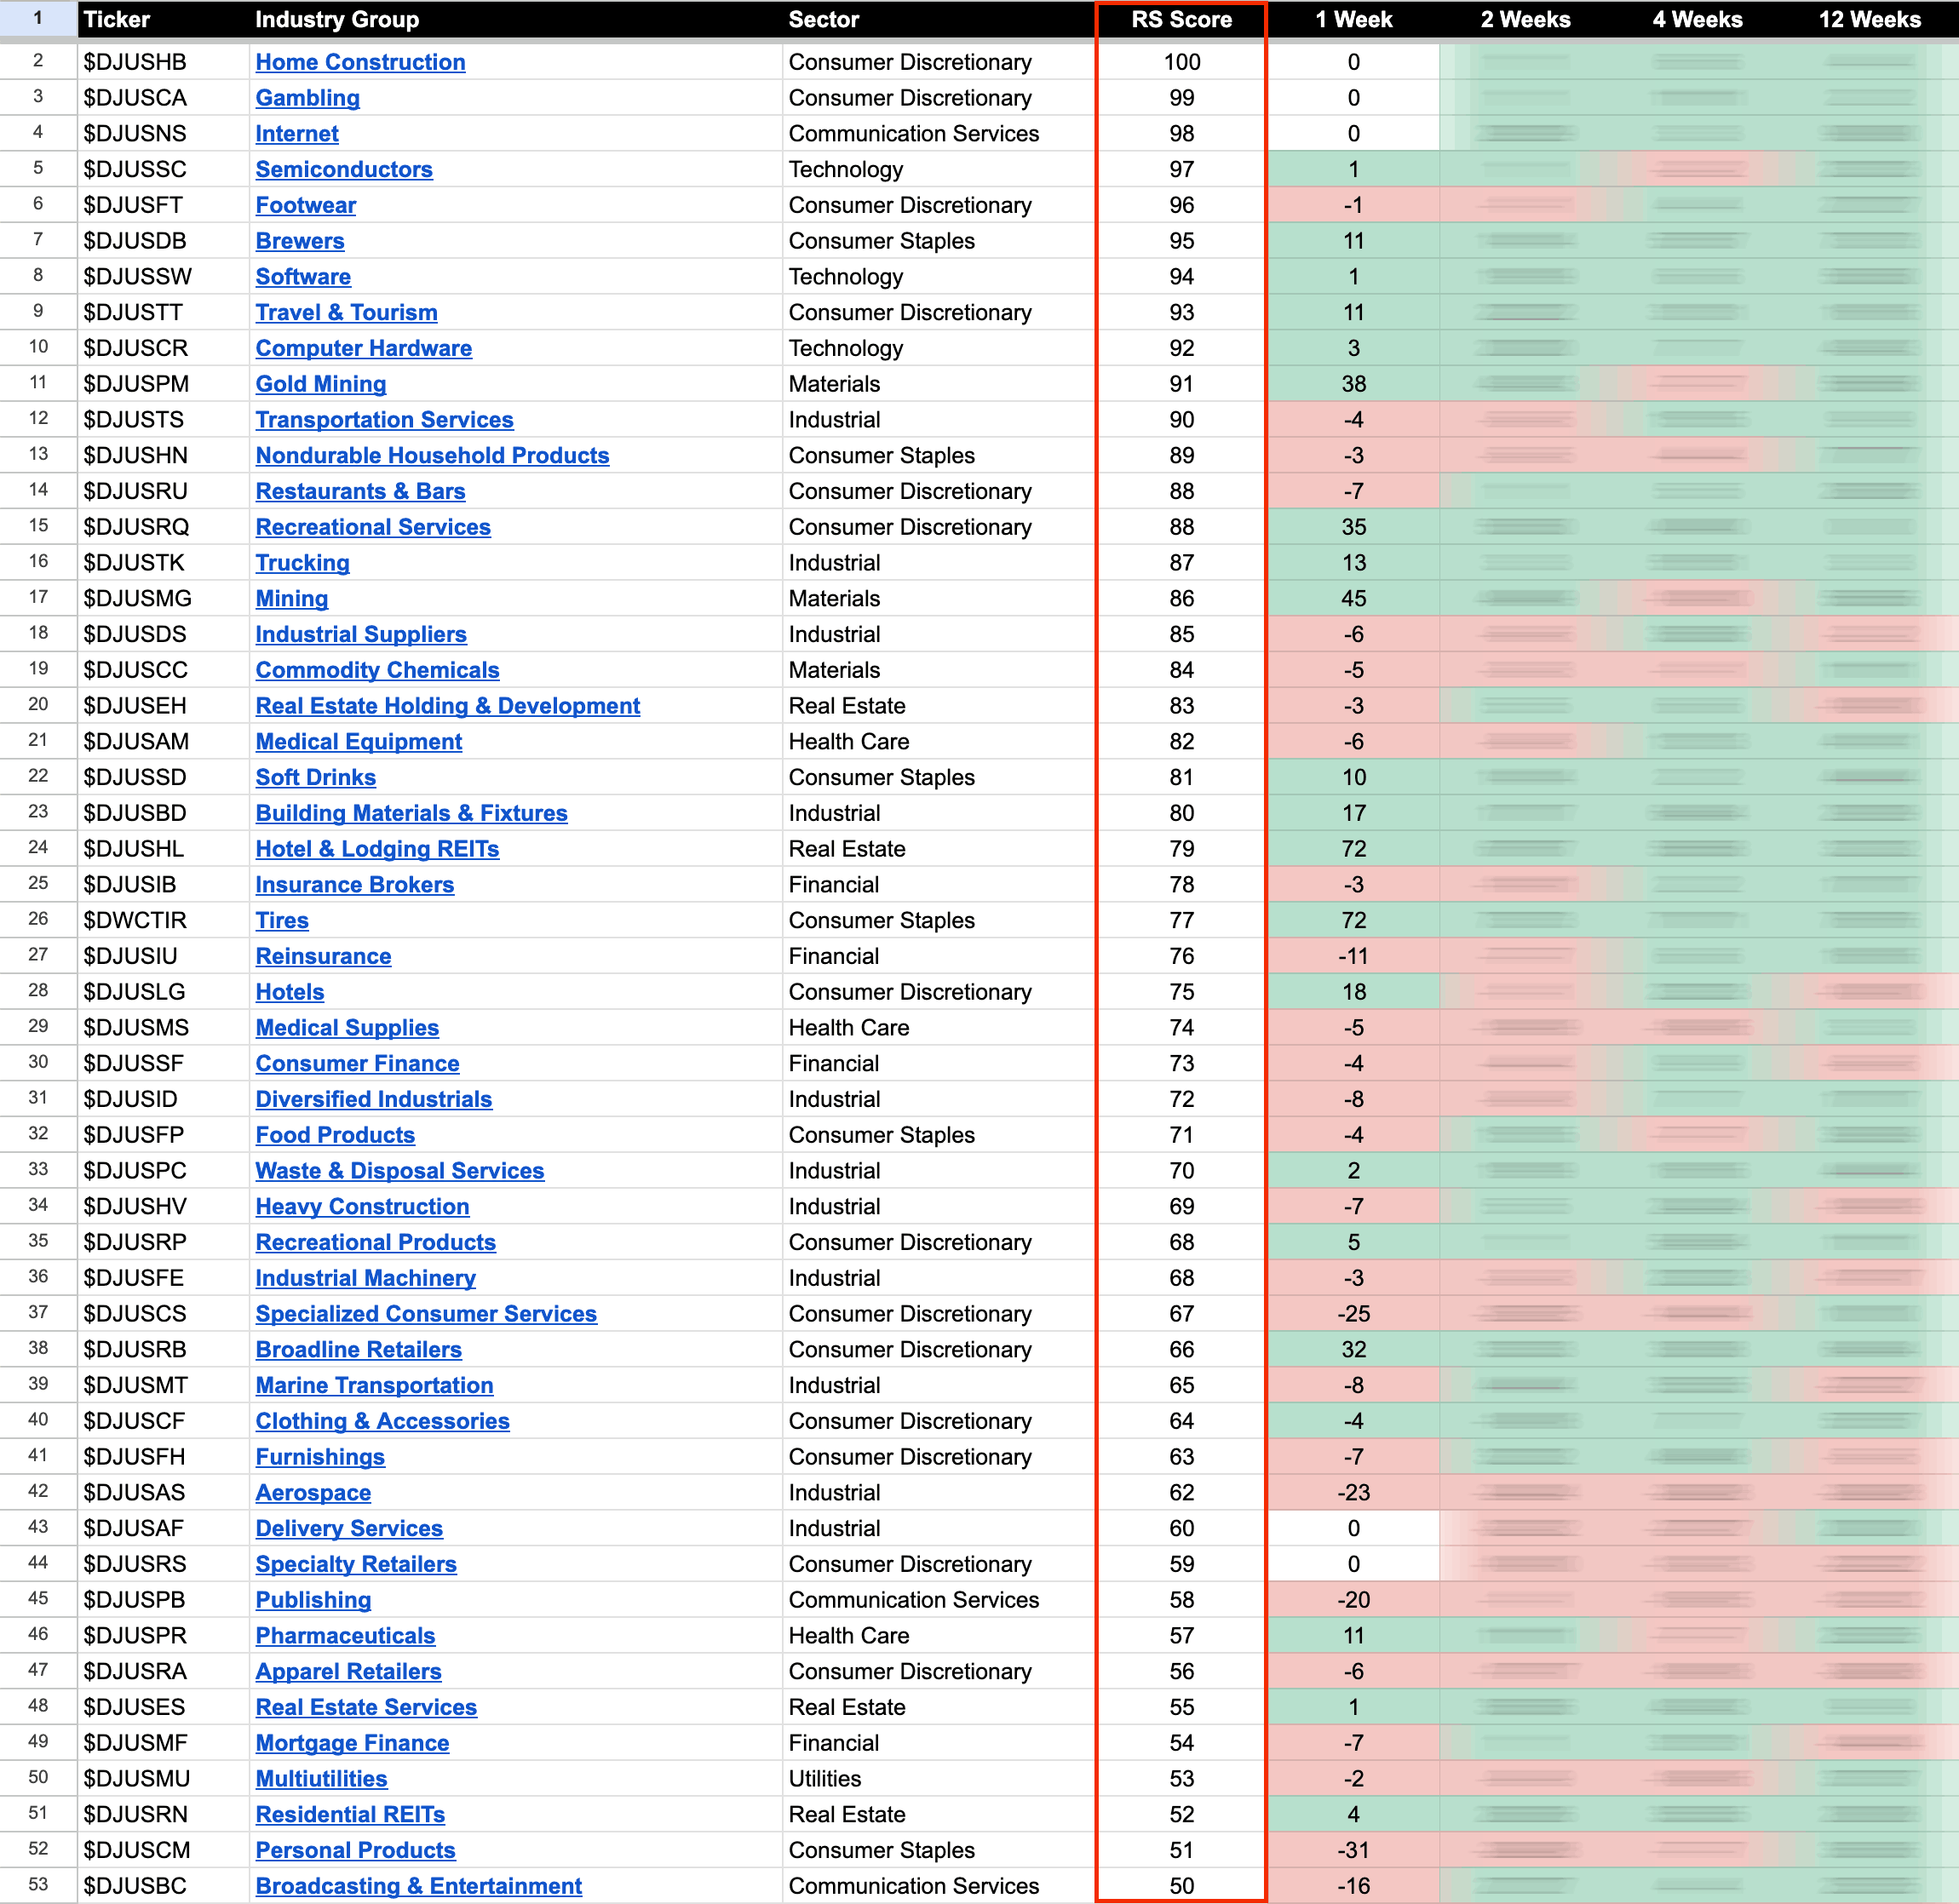
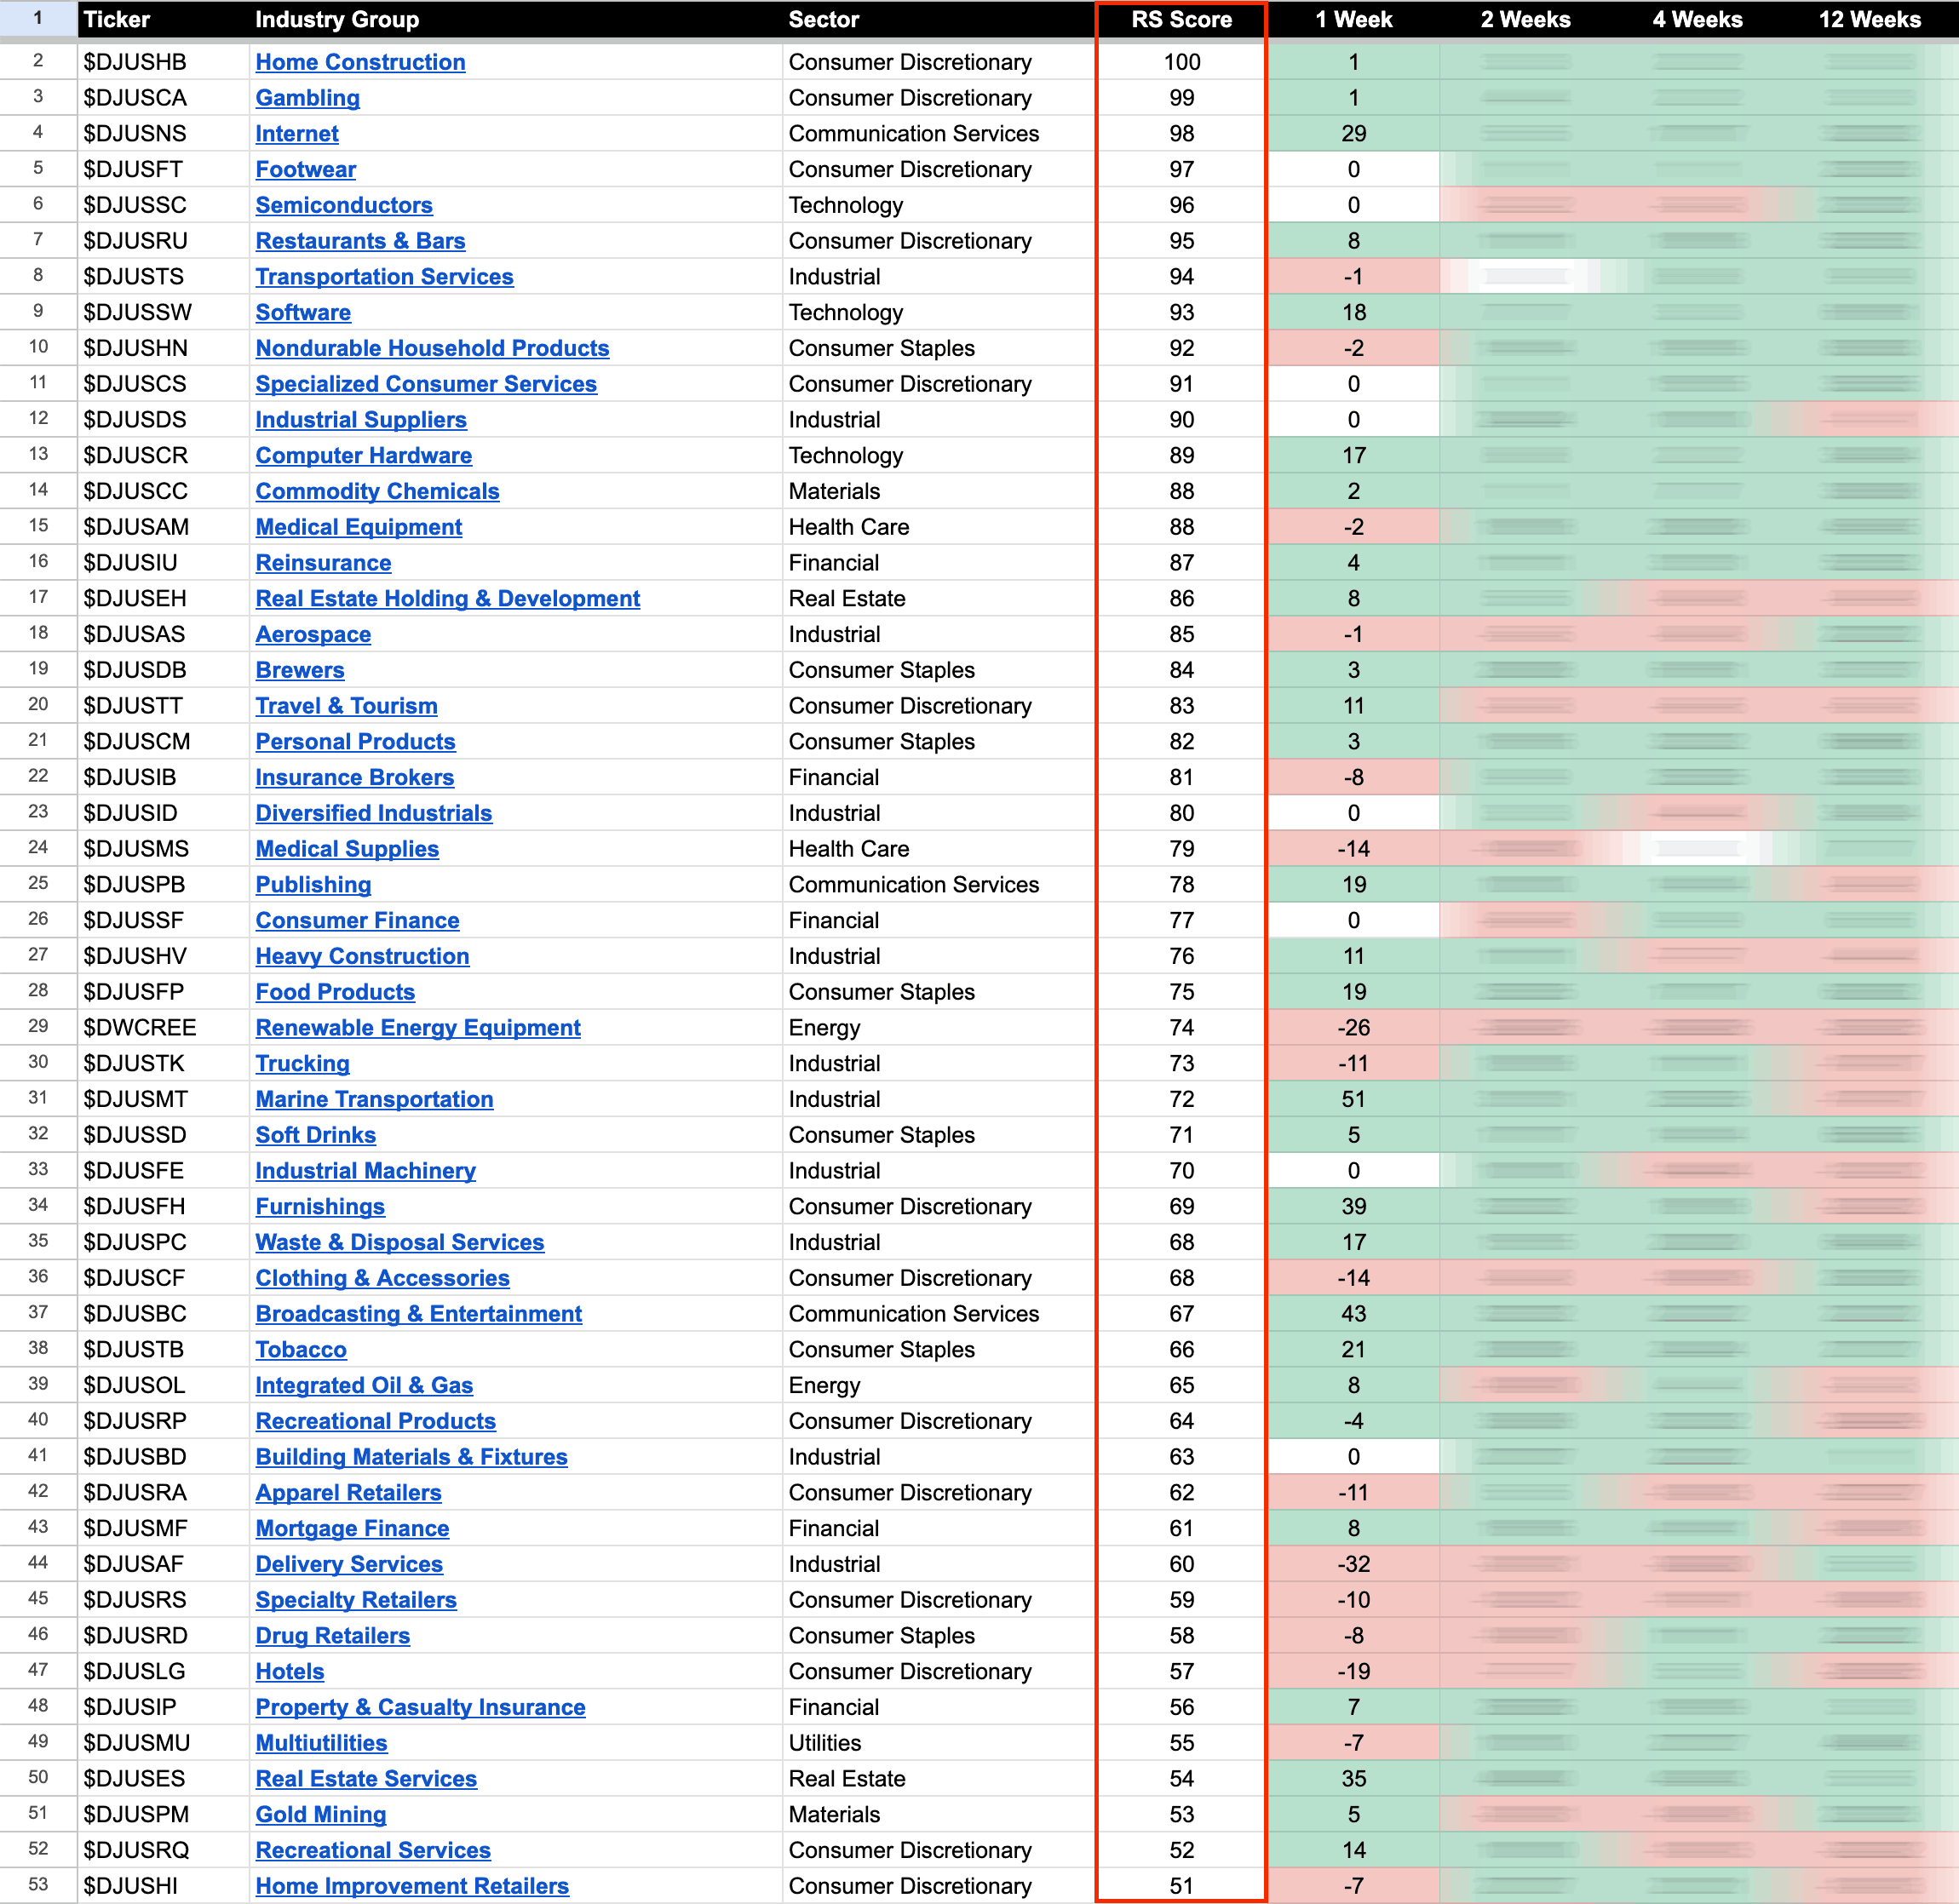
US Stocks Industry Groups Relative Strength Rankings
The purpose of the Relative Strength (RS) tables is to track the short, medium and long term RS changes of the individual groups to find the new leadership earlier than the crowd...
Read More
30 April, 2023
Stage Analysis Members Video – 30 April 2023 (1hr 31mins)
Stage Analysis members weekend video beginning by discussing this weeks Stage 2 stocks with strong volume moves. Followed by the Major Indexes Update, US Industry Groups RS Rankings, IBD Industry Group Bell Curve, Market Breadth Update, and the US Watchlist Stocks in Detail...
Read More
29 April, 2023
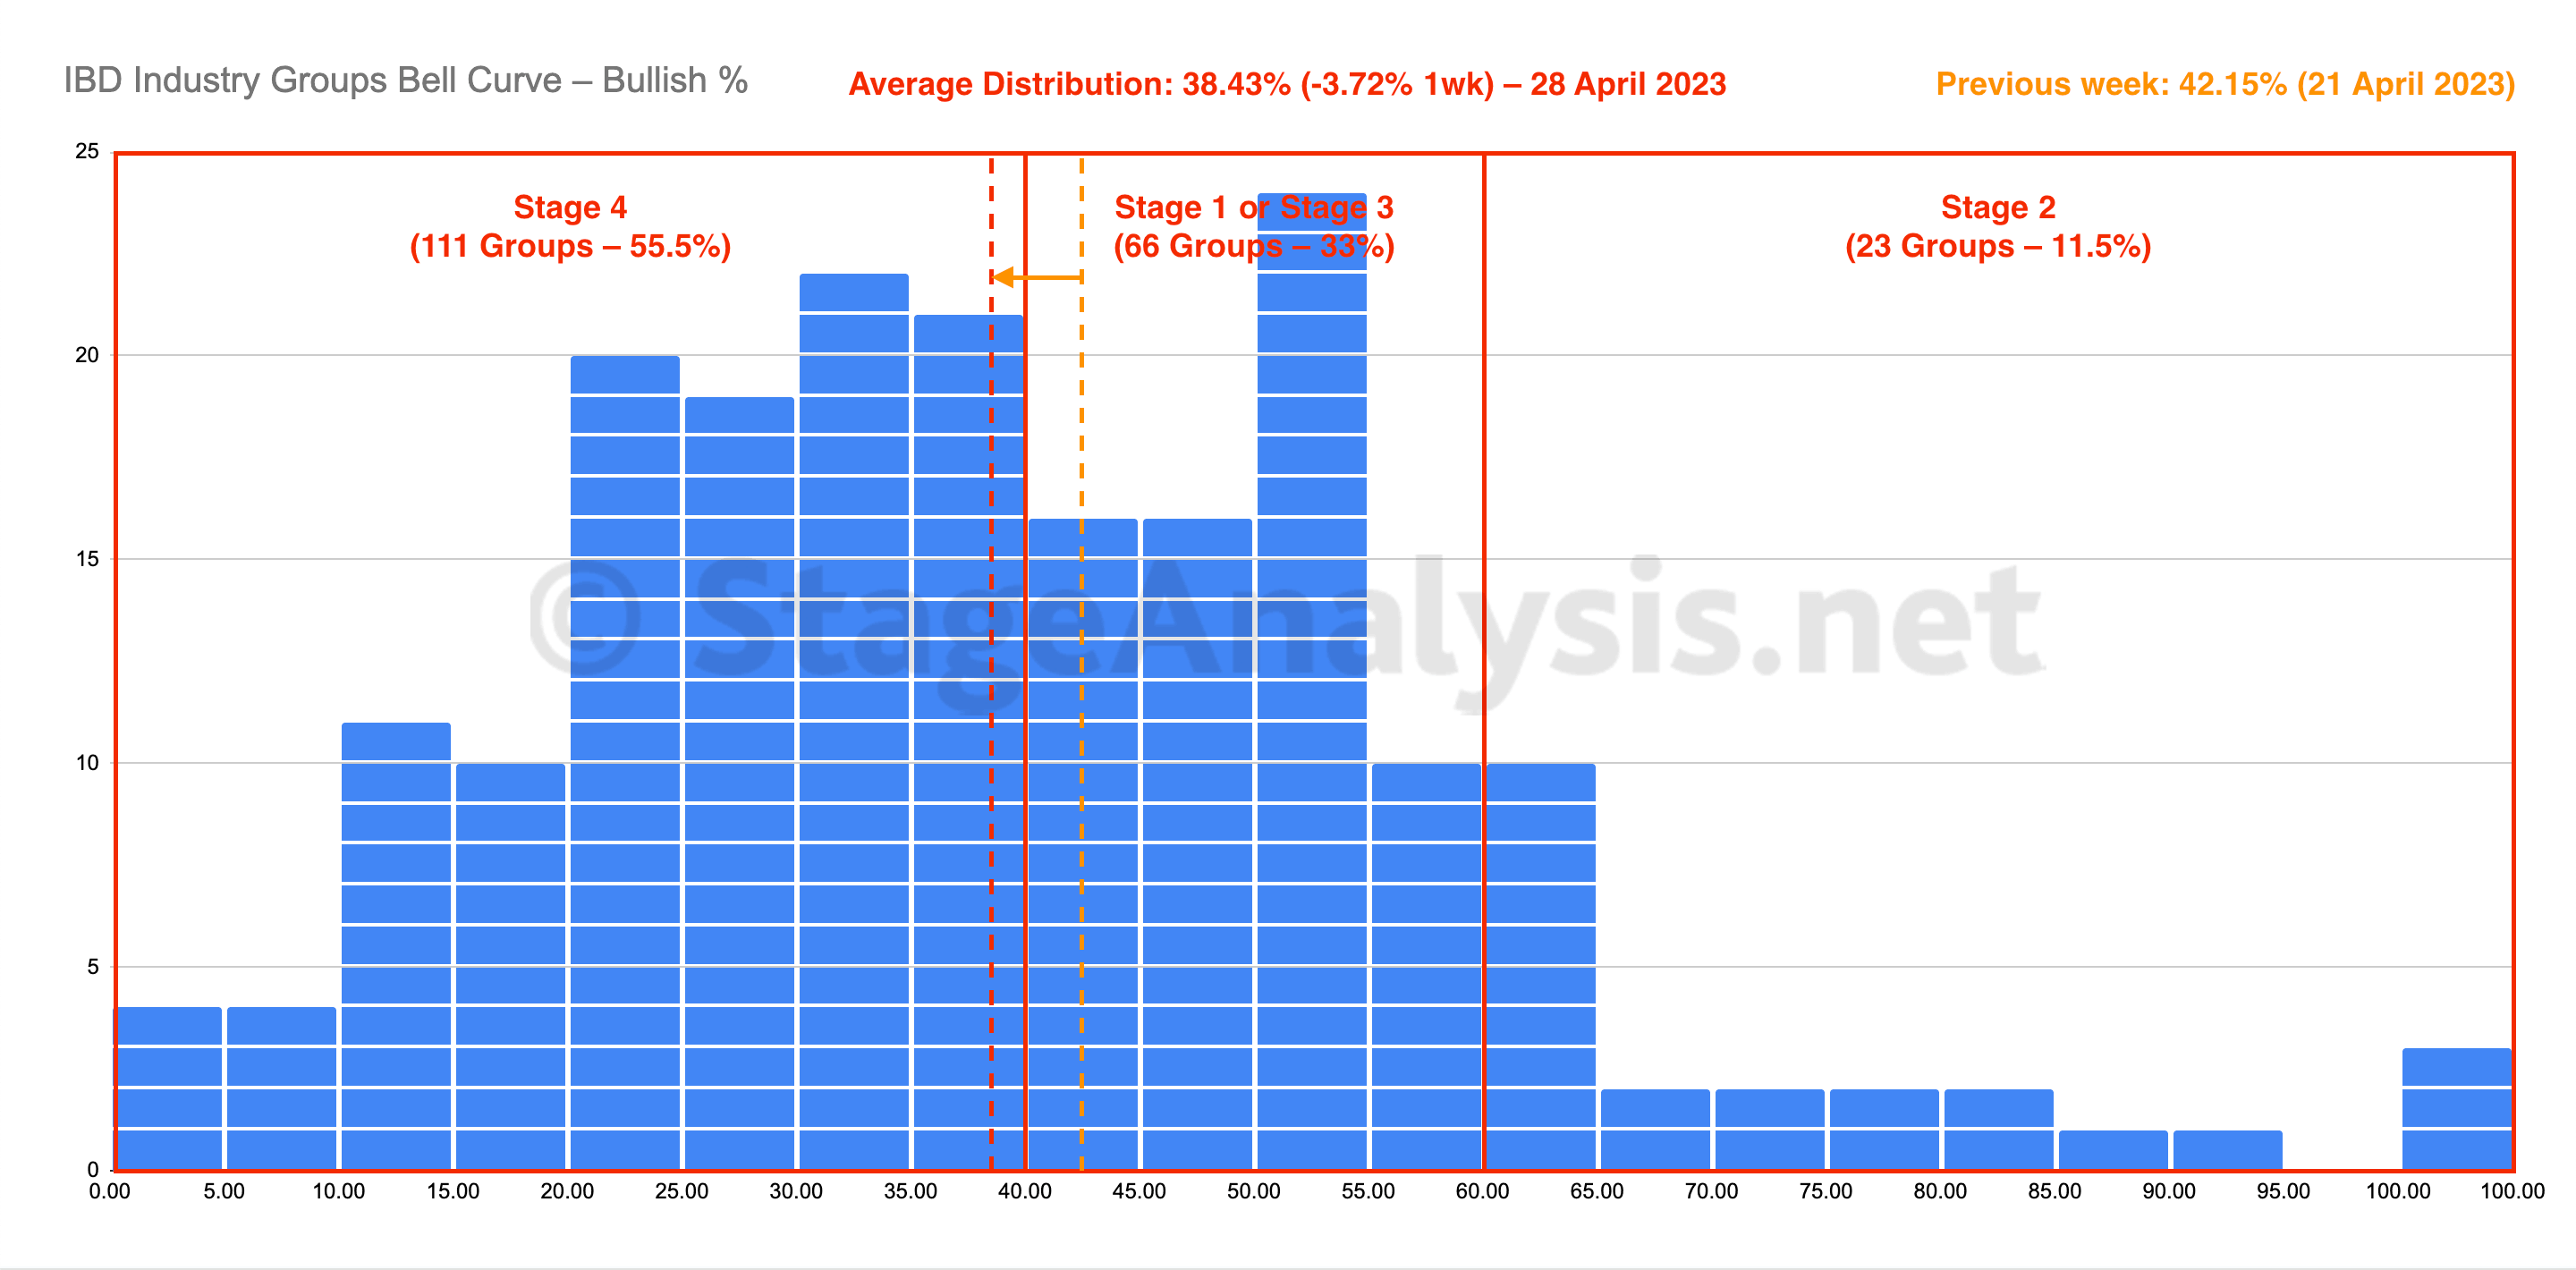
IBD Industry Groups Bell Curve – Bullish Percent
The IBD Industry Groups Bell Curve declined this week by -3.72% to finish at 38.43% overall. The amount of groups in Stage 4 increased by 20 (+10%), and the amount of groups in Stage 2 decreased by 7 (-3.5%), while the amount groups in Stage 1 or Stage 3 decreased by 13 (-6.5%)...
Read More
28 April, 2023
US Stocks Industry Groups Relative Strength Rankings
The purpose of the Relative Strength (RS) tables is to track the short, medium and long term RS changes of the individual groups to find the new leadership earlier than the crowd...
Read More
23 April, 2023
Stage Analysis Members Video – 23 April 2023 (1hr 23mins)
Stage Analysis members weekend video featuring Stage Analysis of the mega cap stocks reporting earnings in the coming week, plus the members only content covering the Major Indexes Update, Futures, Industry Group RS Rankings, IBD Industry Groups Bell Curve – Bullish Percent, Market Breadth, Stage 2 Continuation Breakouts and the US Watchlist Stocks detailed discussion...
Read More
22 April, 2023
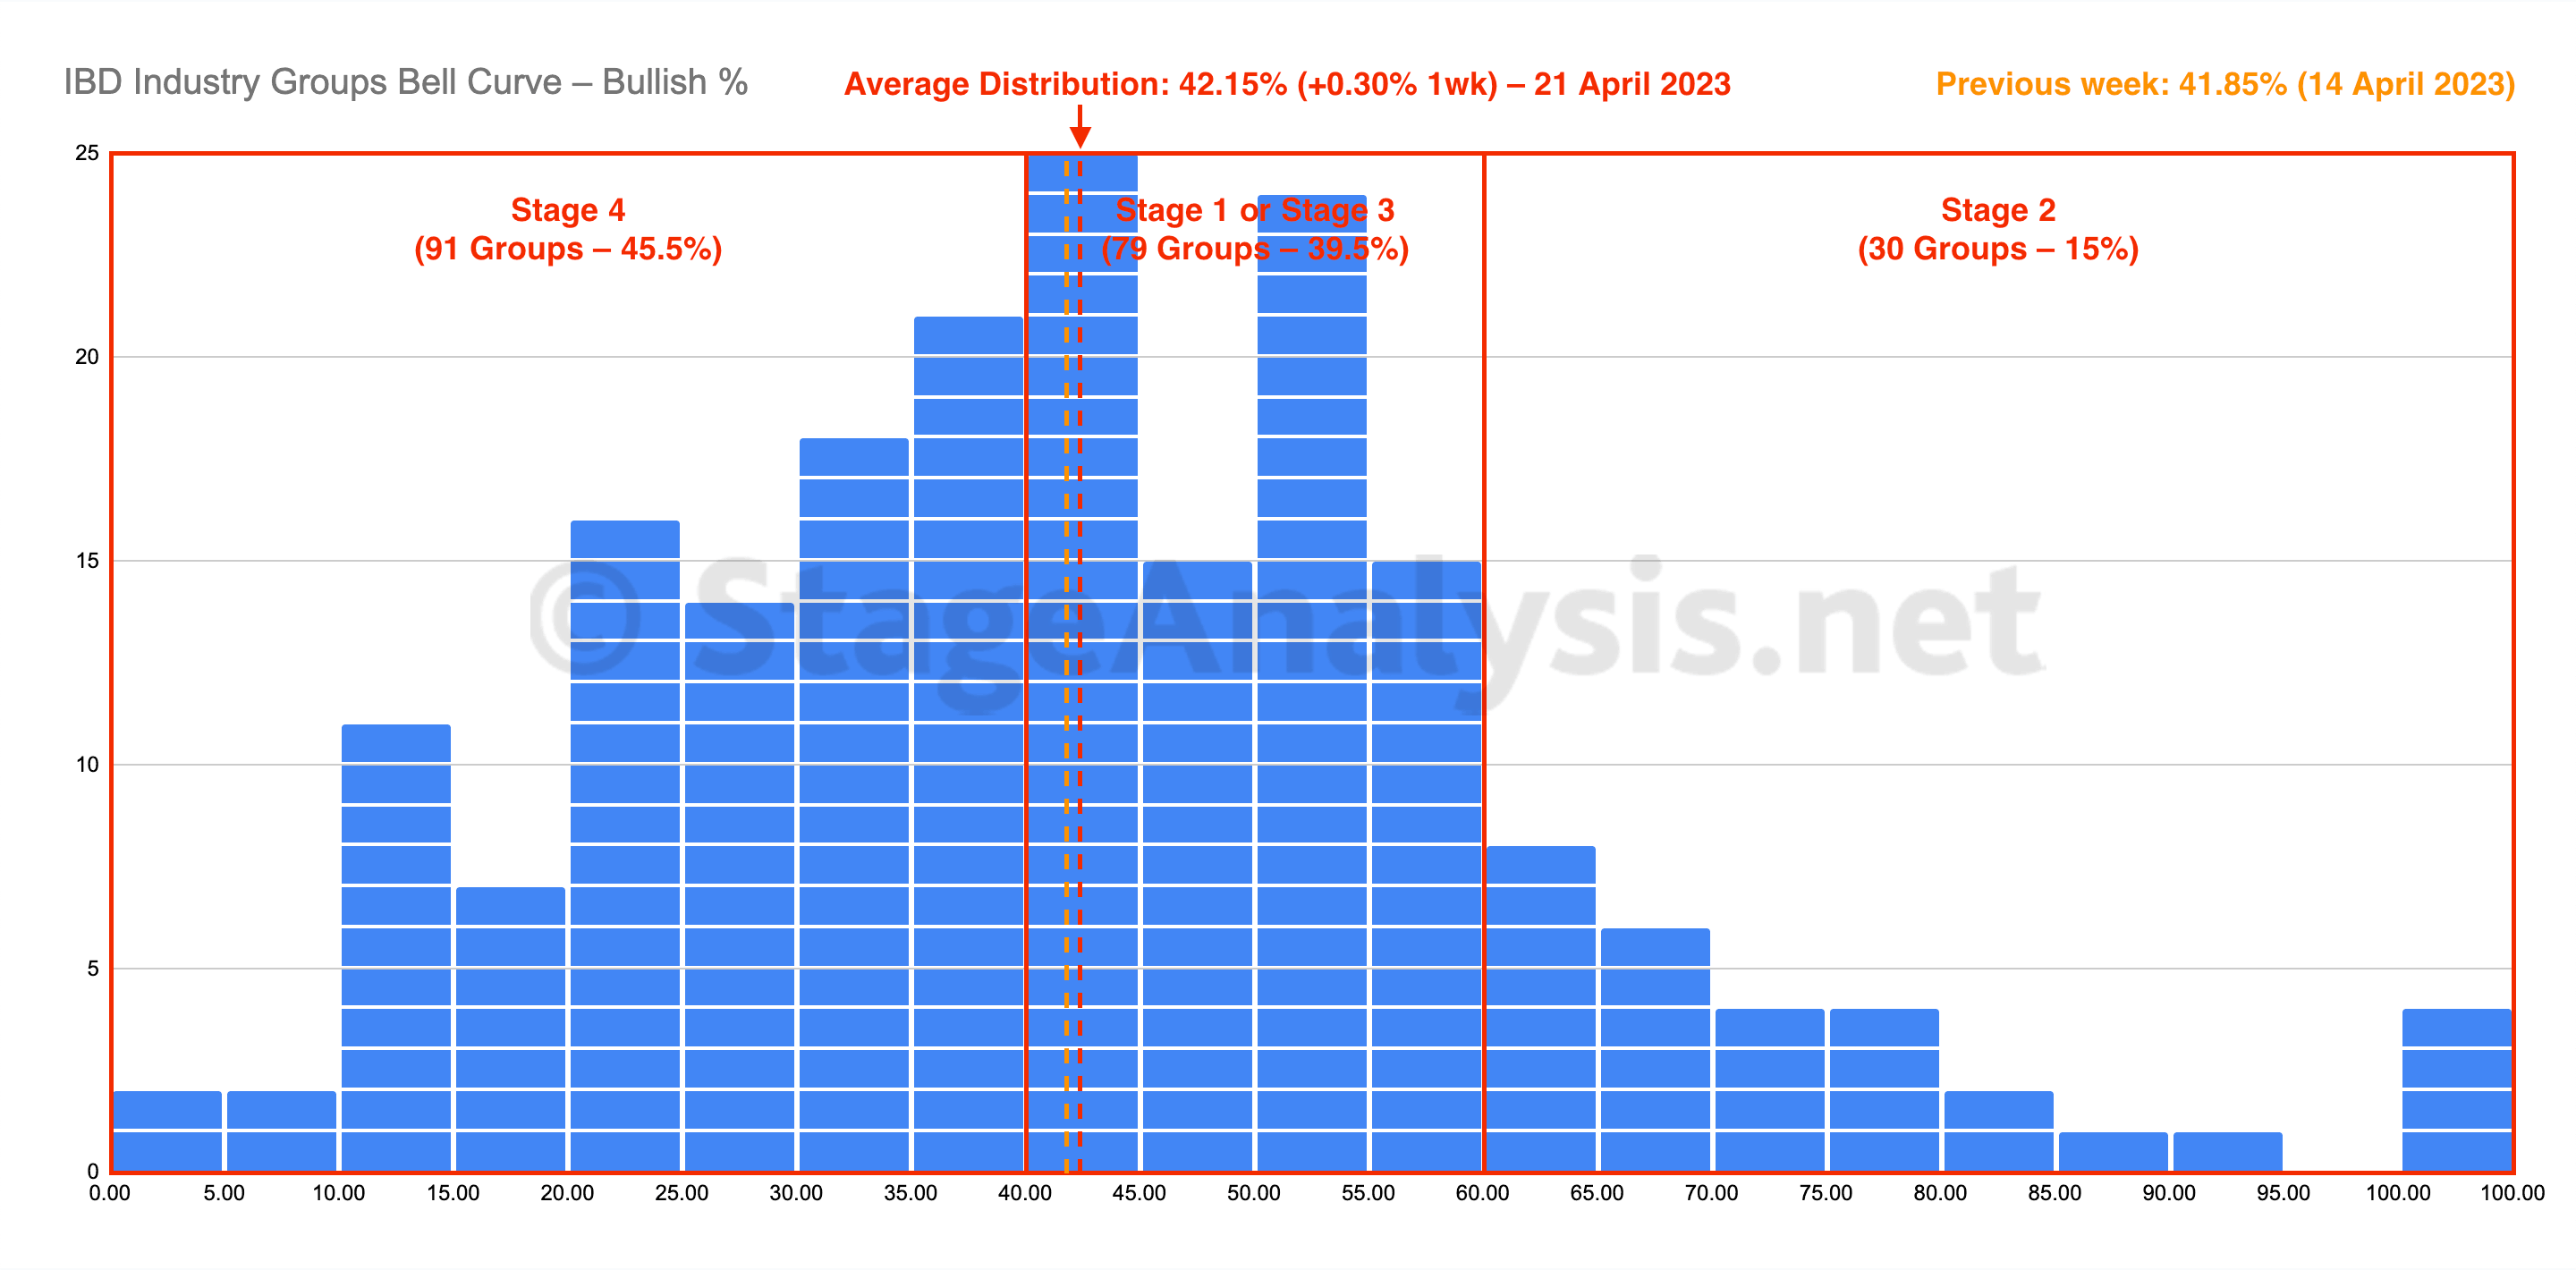
IBD Industry Groups Bell Curve – Bullish Percent
The IBD Industry Groups Bell Curve edged slightly higher this week by +0.30% to finish the week at 42.15%. The amount of groups in Stage 4 increased by 3 (+1.5%), and the amount of groups in Stage 2 decreased by 3 (-1.5%), while the amount groups in Stage 1 or Stage 3 was unchanged...
Read More
21 April, 2023
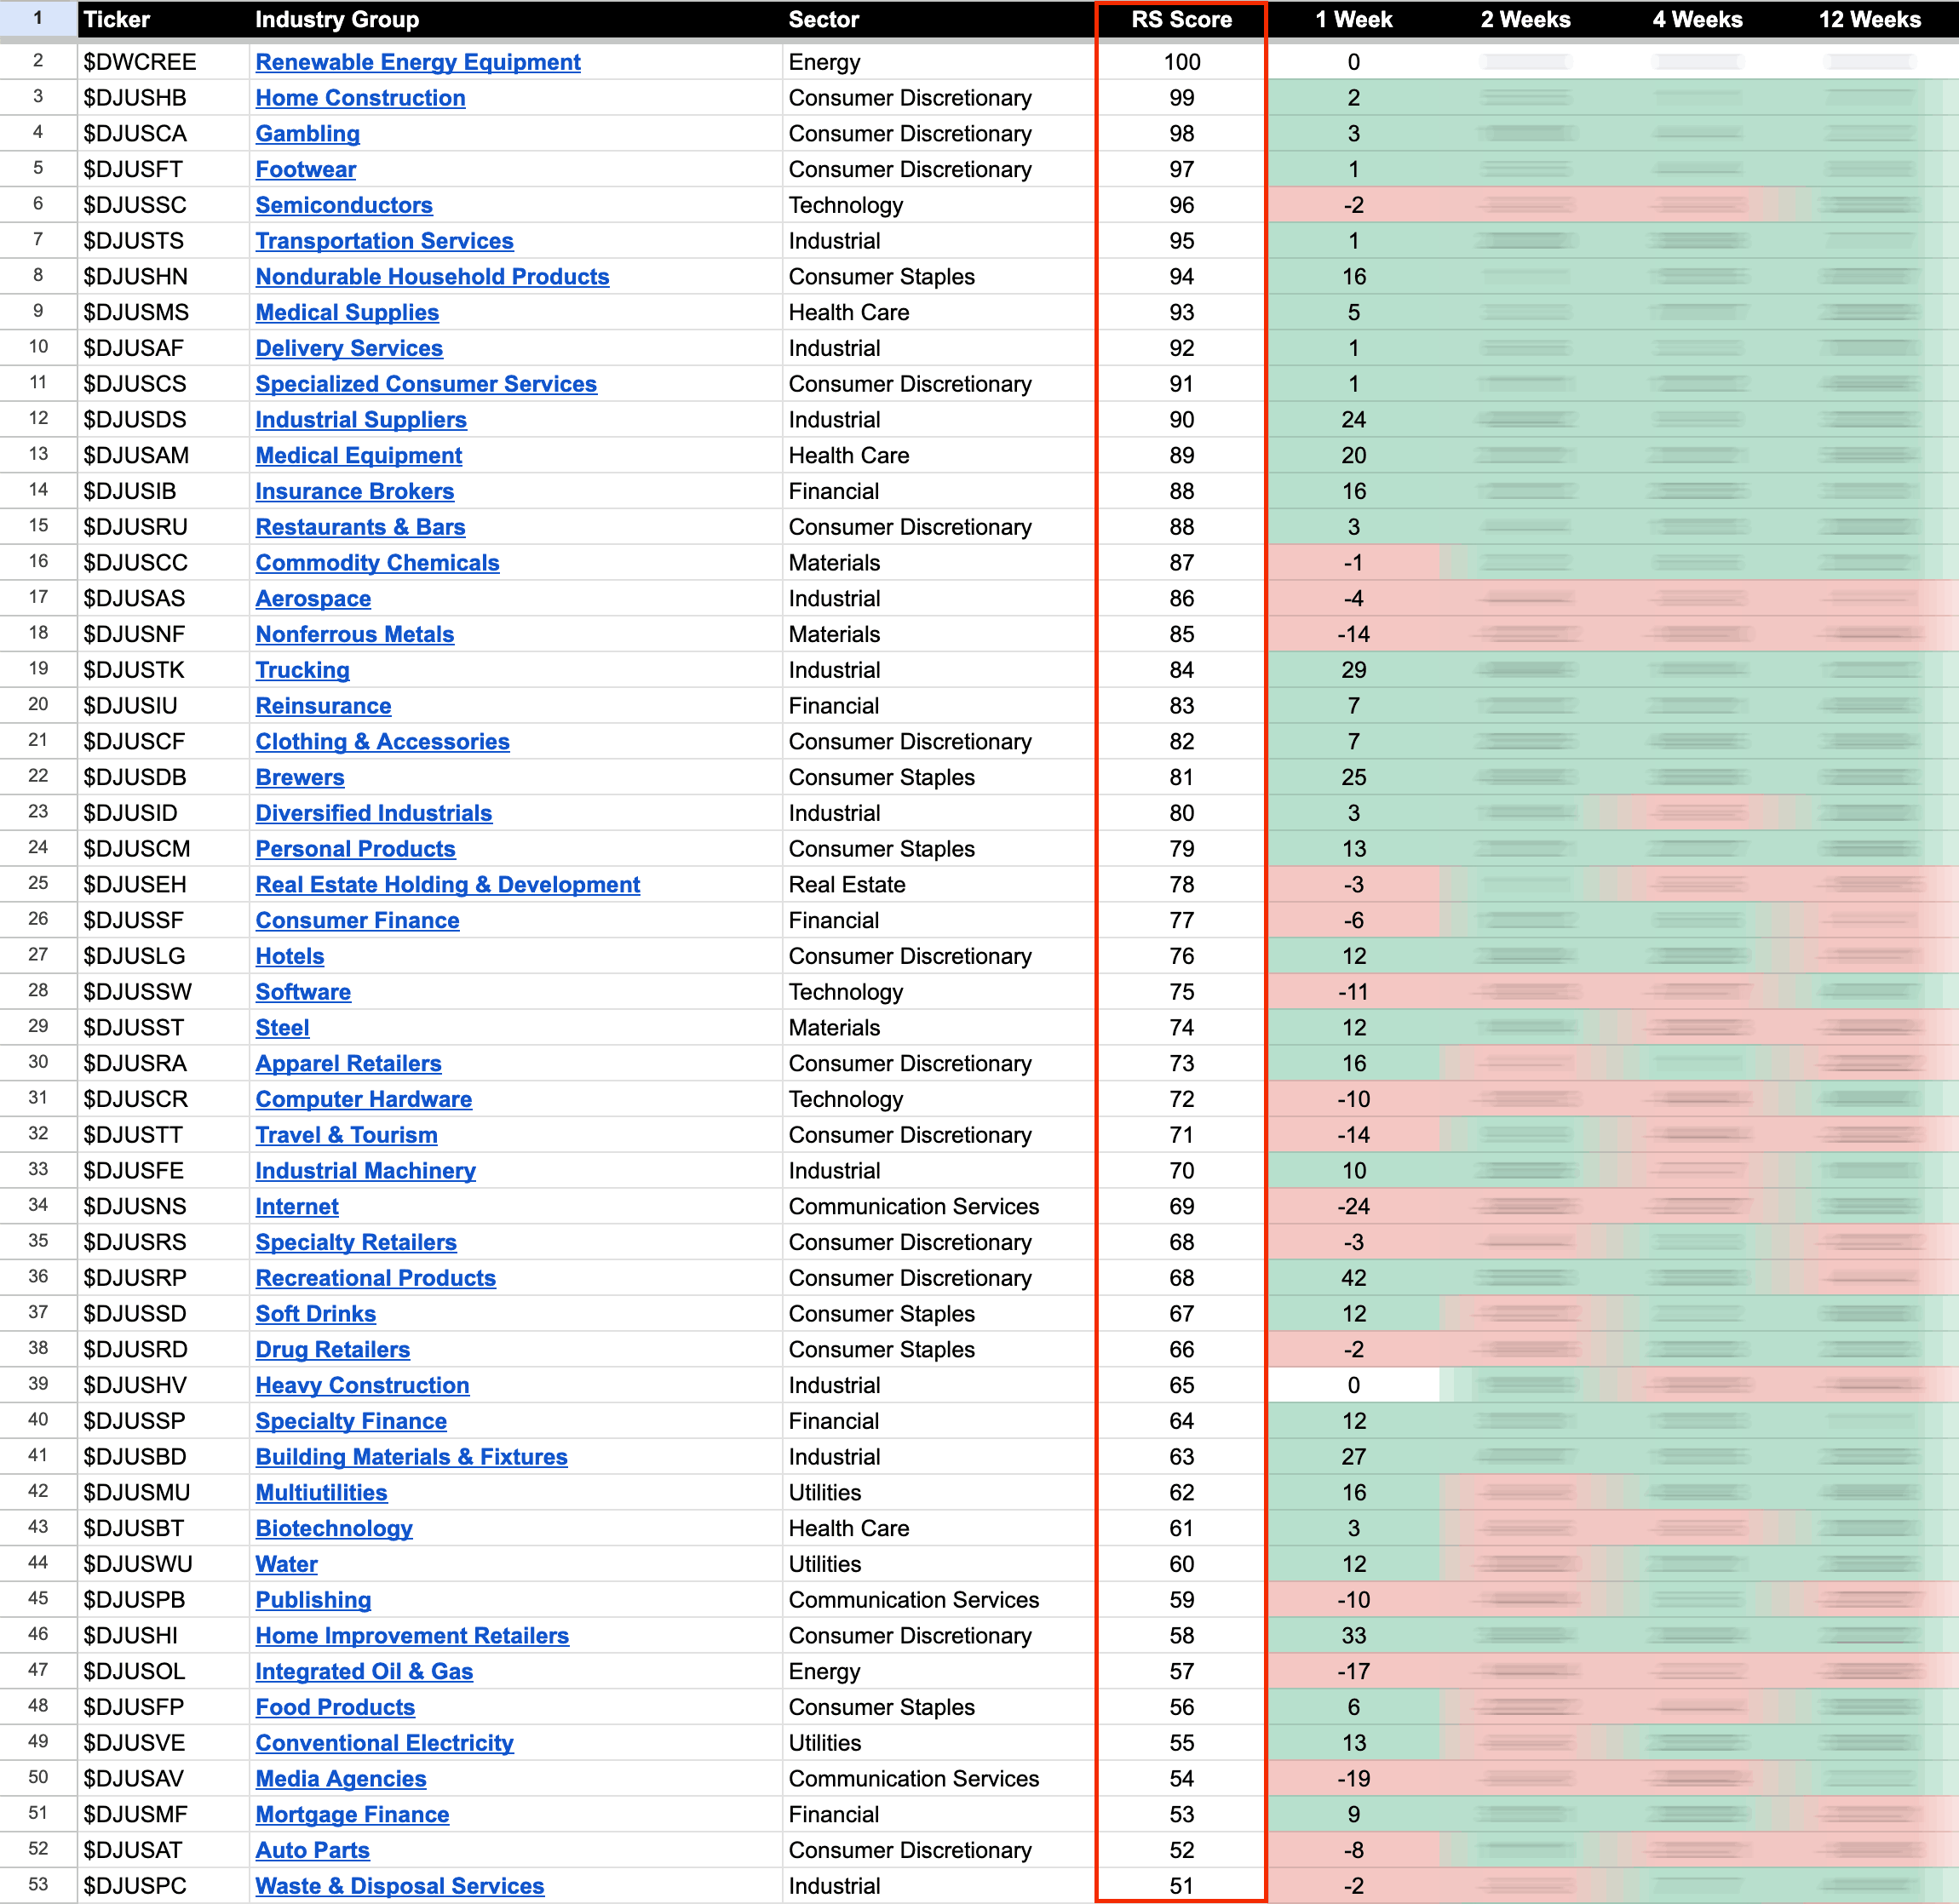
US Stocks Industry Groups Relative Strength Rankings
The purpose of the Relative Strength (RS) tables is to track the short, medium and long term RS changes of the individual groups to find the new leadership earlier than the crowd...
Read More
20 April, 2023
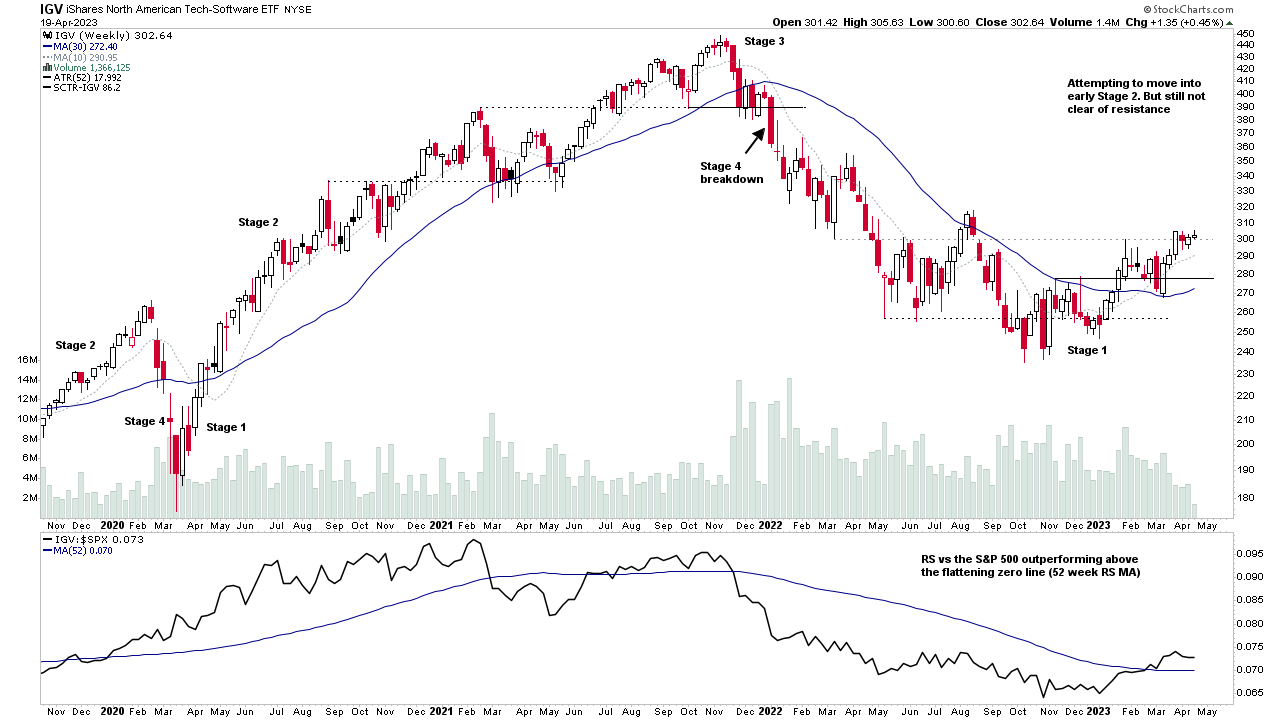
Software Group Focus Video – 19 April 2023 (36mins)
The Stage Analysis members midweek video is a special group focus on the Software group this week, looking at the top 10% of stocks within the group and how they are developing in Stage 2 and late Stage 1...
Read More
16 April, 2023
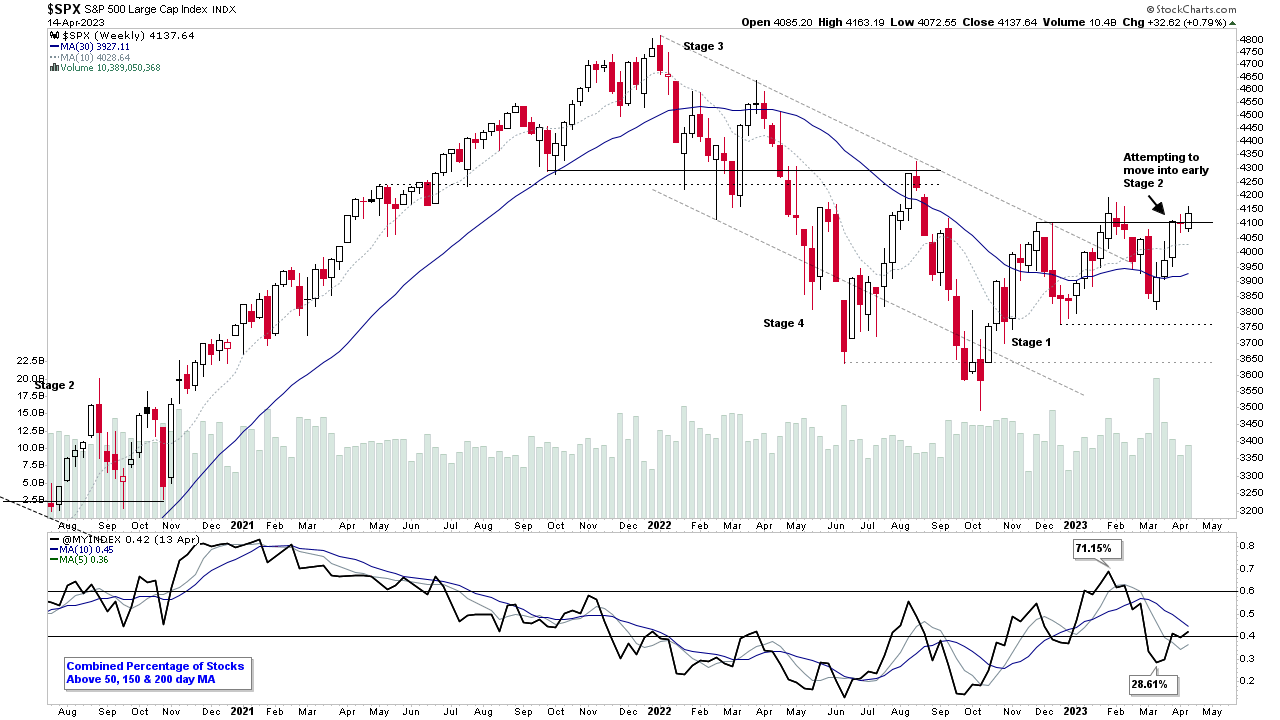
Stage Analysis Members Video – 16 April 2023 (1hr 25mins)
Stage Analysis Members Weekend Video featuring Stage Analysis of the major US indexes on multiple timeframes, Futures (SATA) Stage Analysis Technical Attributes Charts, Industry Group RS Rankings and changes, IBD Industry Groups Bell Curve – Bullish Percent data. The Market Breadth Update to help to determine the Weight of Evidence, which is so crucial to Stan Weinstein's Stage Analysis method....
Read More