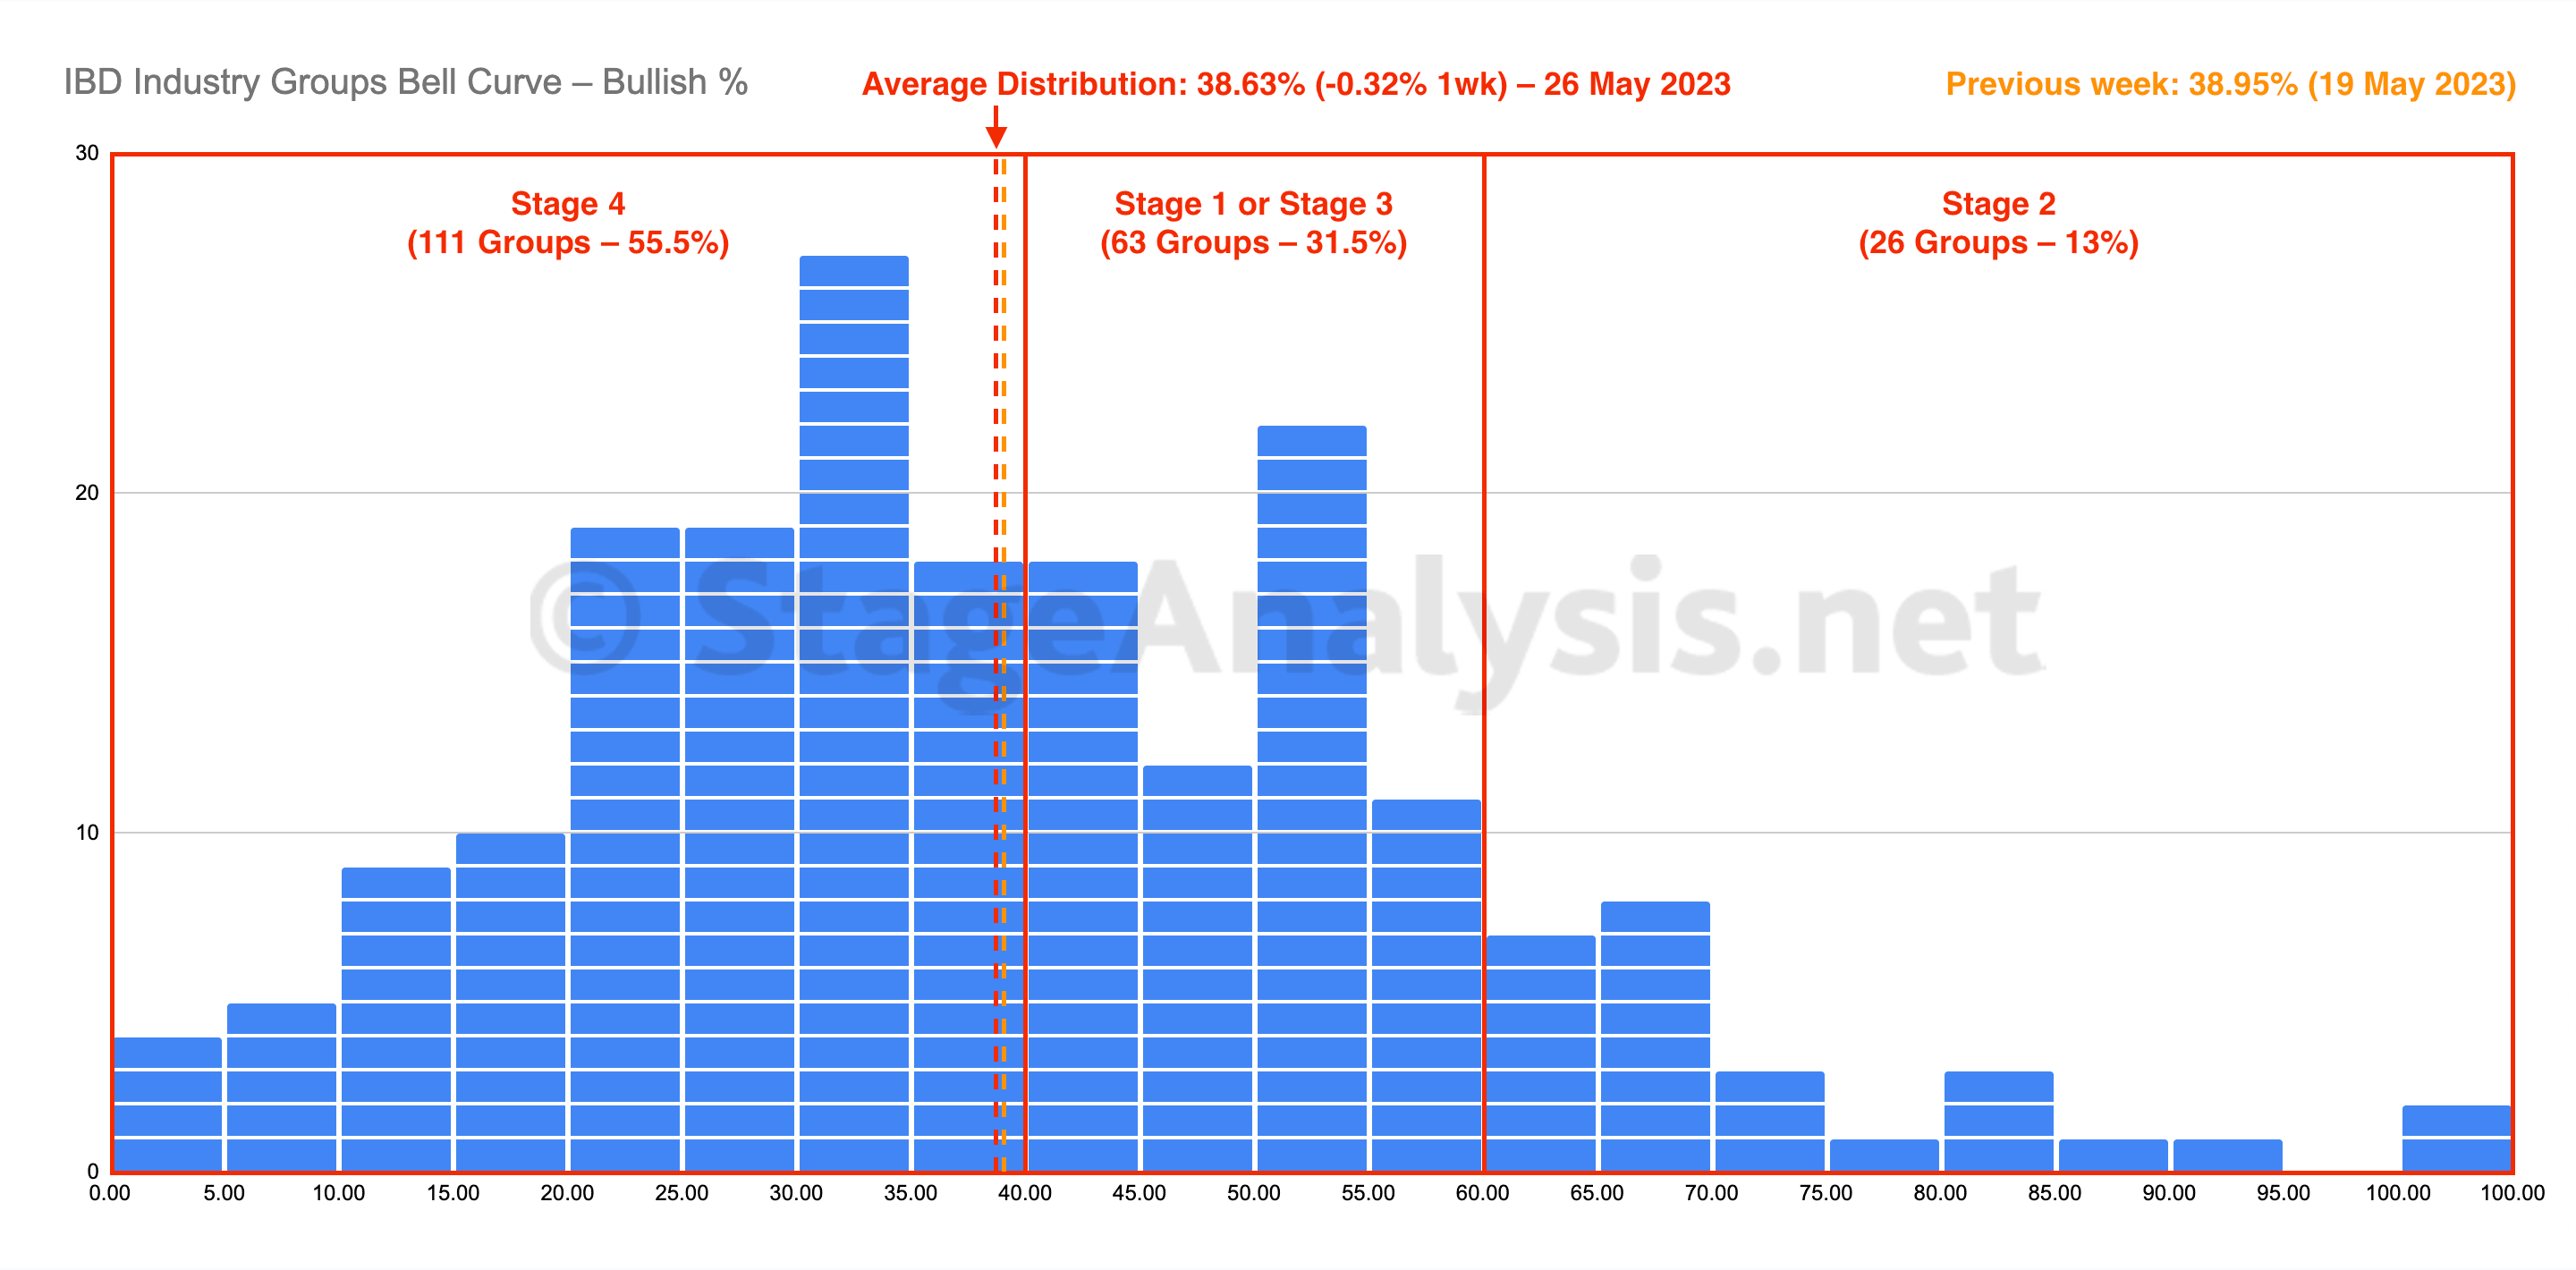
The IBD Industry Groups Bell Curve decreased by -0.32% this week to finish at 38.63% overall. The amount of groups in Stage 4 increased by 4 (+2%), and the amount of groups in Stage 2 increased by 2 (+1%), while the amount groups in Stage 1 or Stage 3 decreased by 7 (-3.5%).
Read More

Blog
27 May, 2023
IBD Industry Groups Bell Curve – Bullish Percent
26 May, 2023
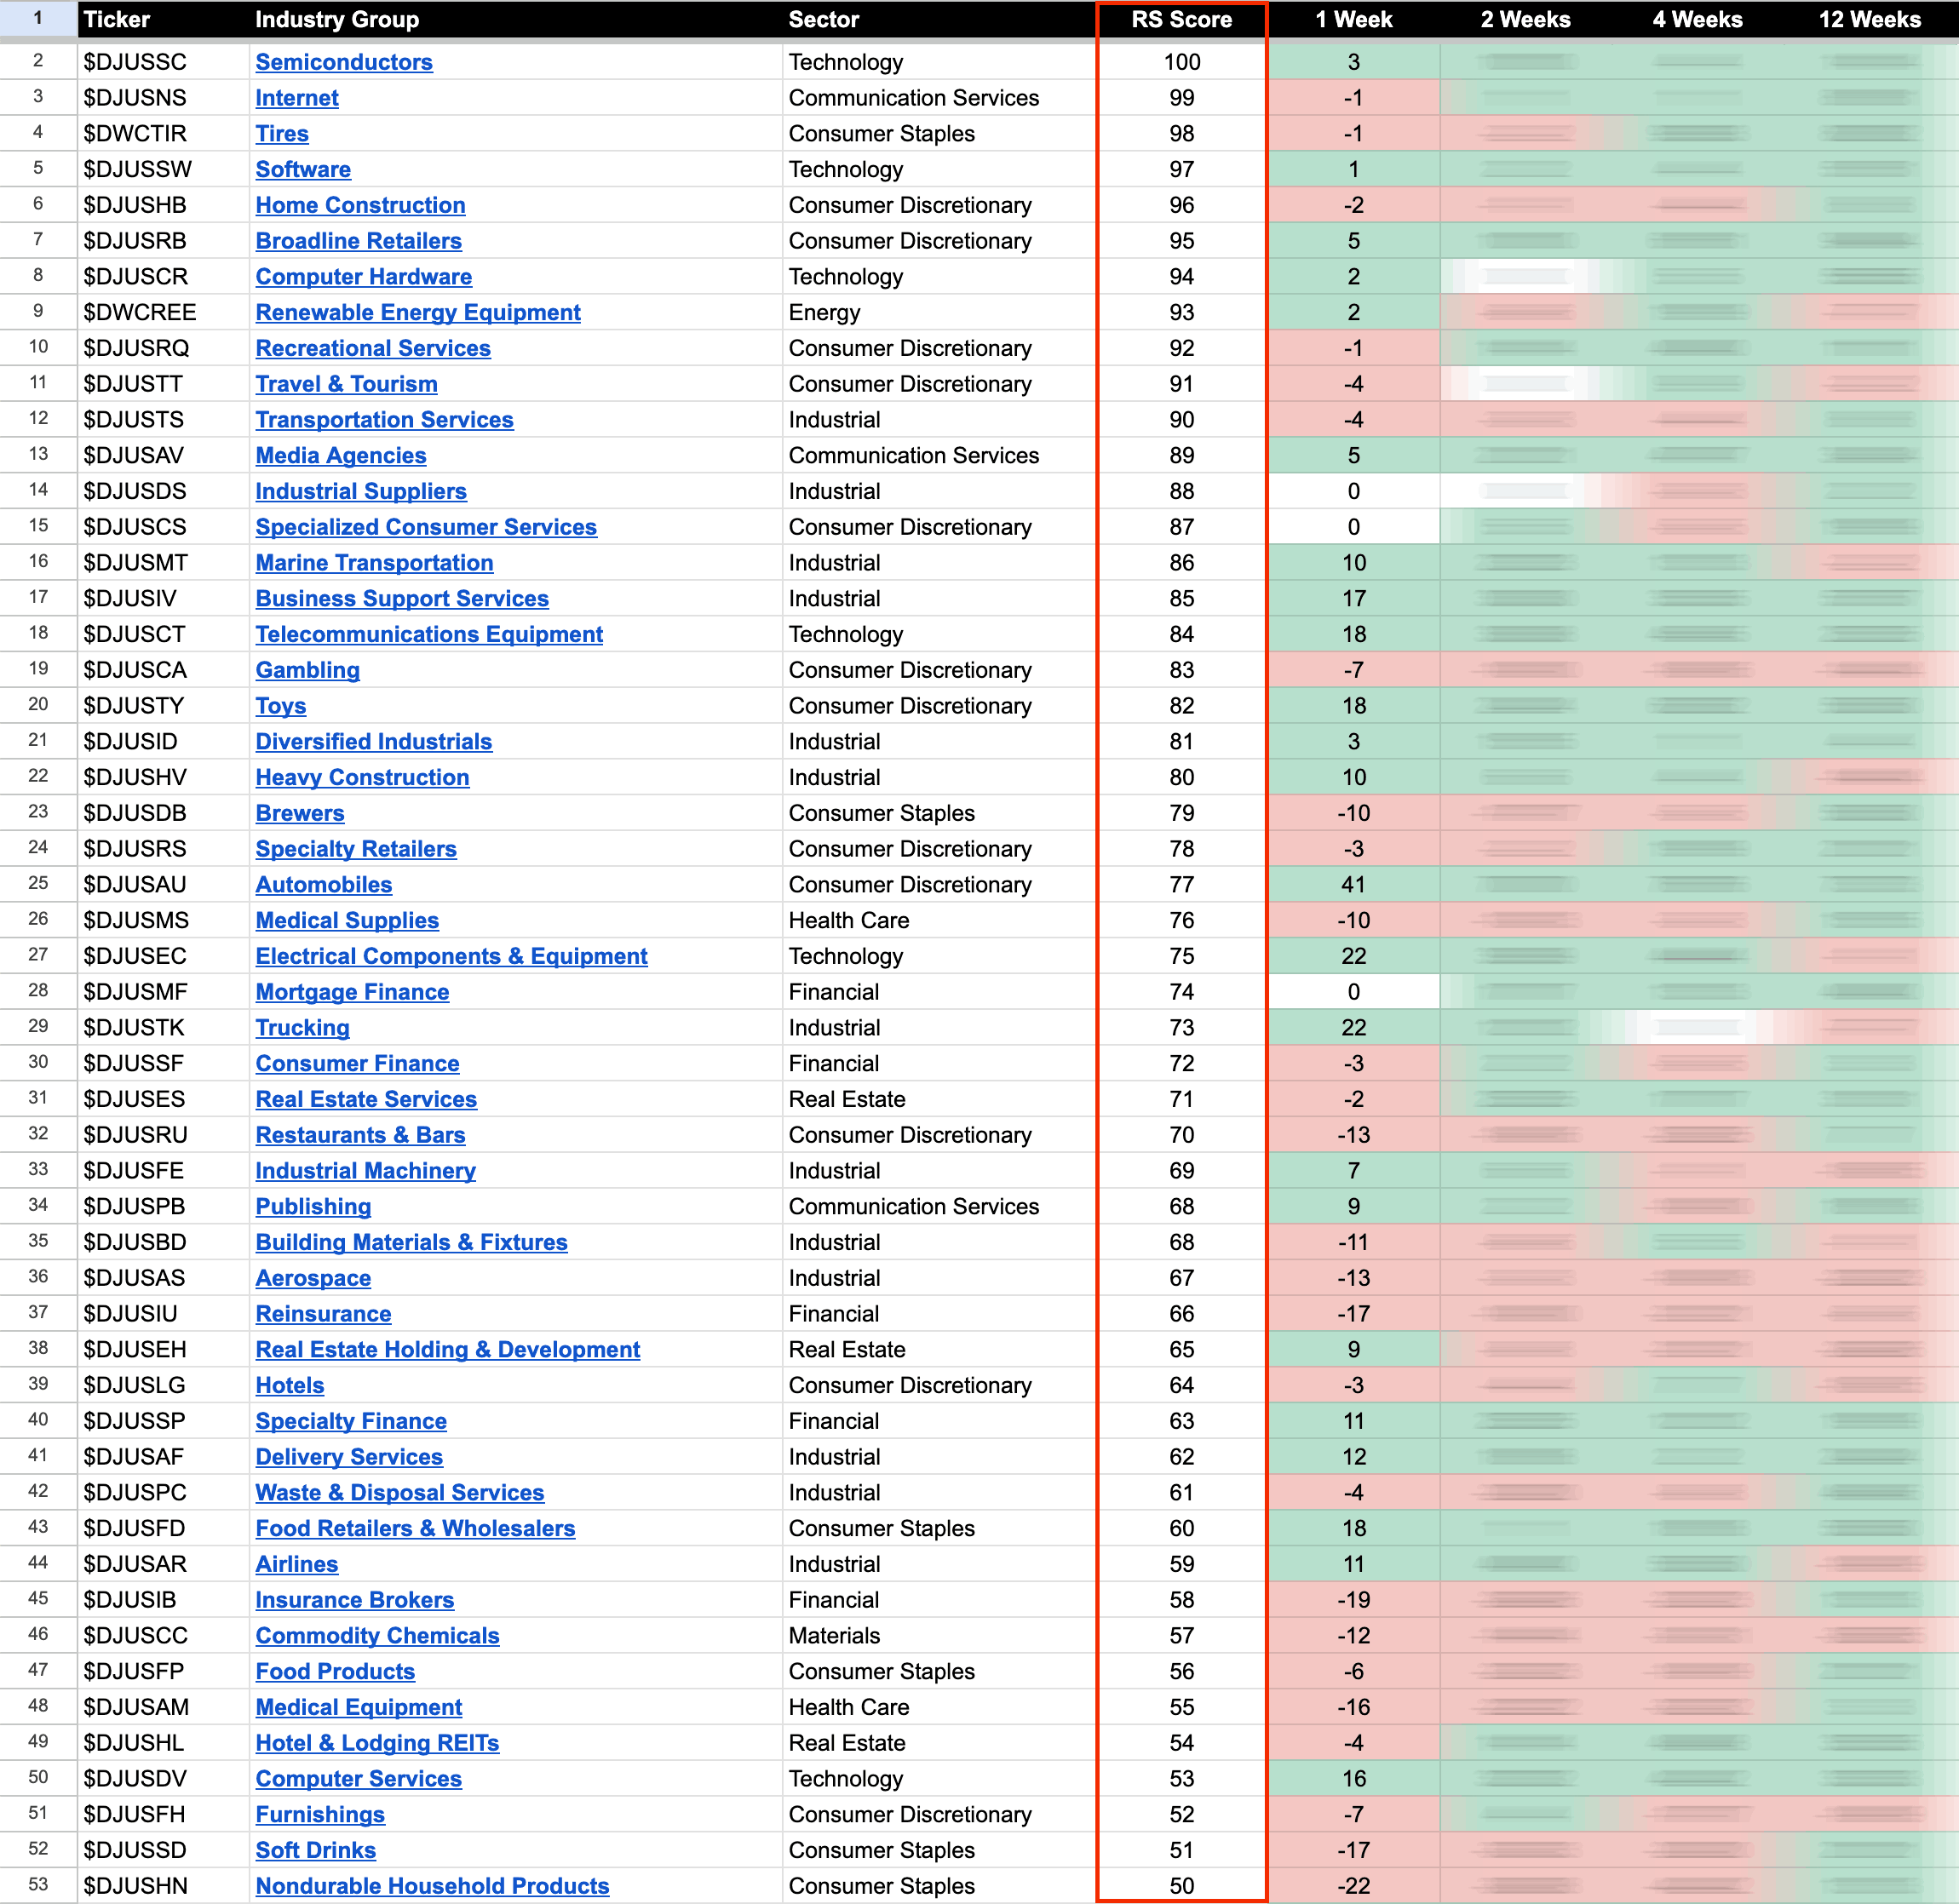
US Stocks Industry Groups Relative Strength Rankings
The purpose of the Relative Strength (RS) tables is to track the short, medium and long term RS changes of the individual groups to find the new leadership earlier than the crowd...
Read More
21 May, 2023
Stage Analysis Members Video – 21 May 2023 (1hr 14mins)
Stage Analysis weekend video discussing some of the weeks most significant Stage 2 Breakouts and Continuation attempts, plus the regular weekly member content of the Major Indexes Update, Futures SATA Charts, Industry Groups RS Rankings, IBD Industry Group Bell Curve, and Market Breadth Update to help to determine the weight of evidence...
Read More
20 May, 2023
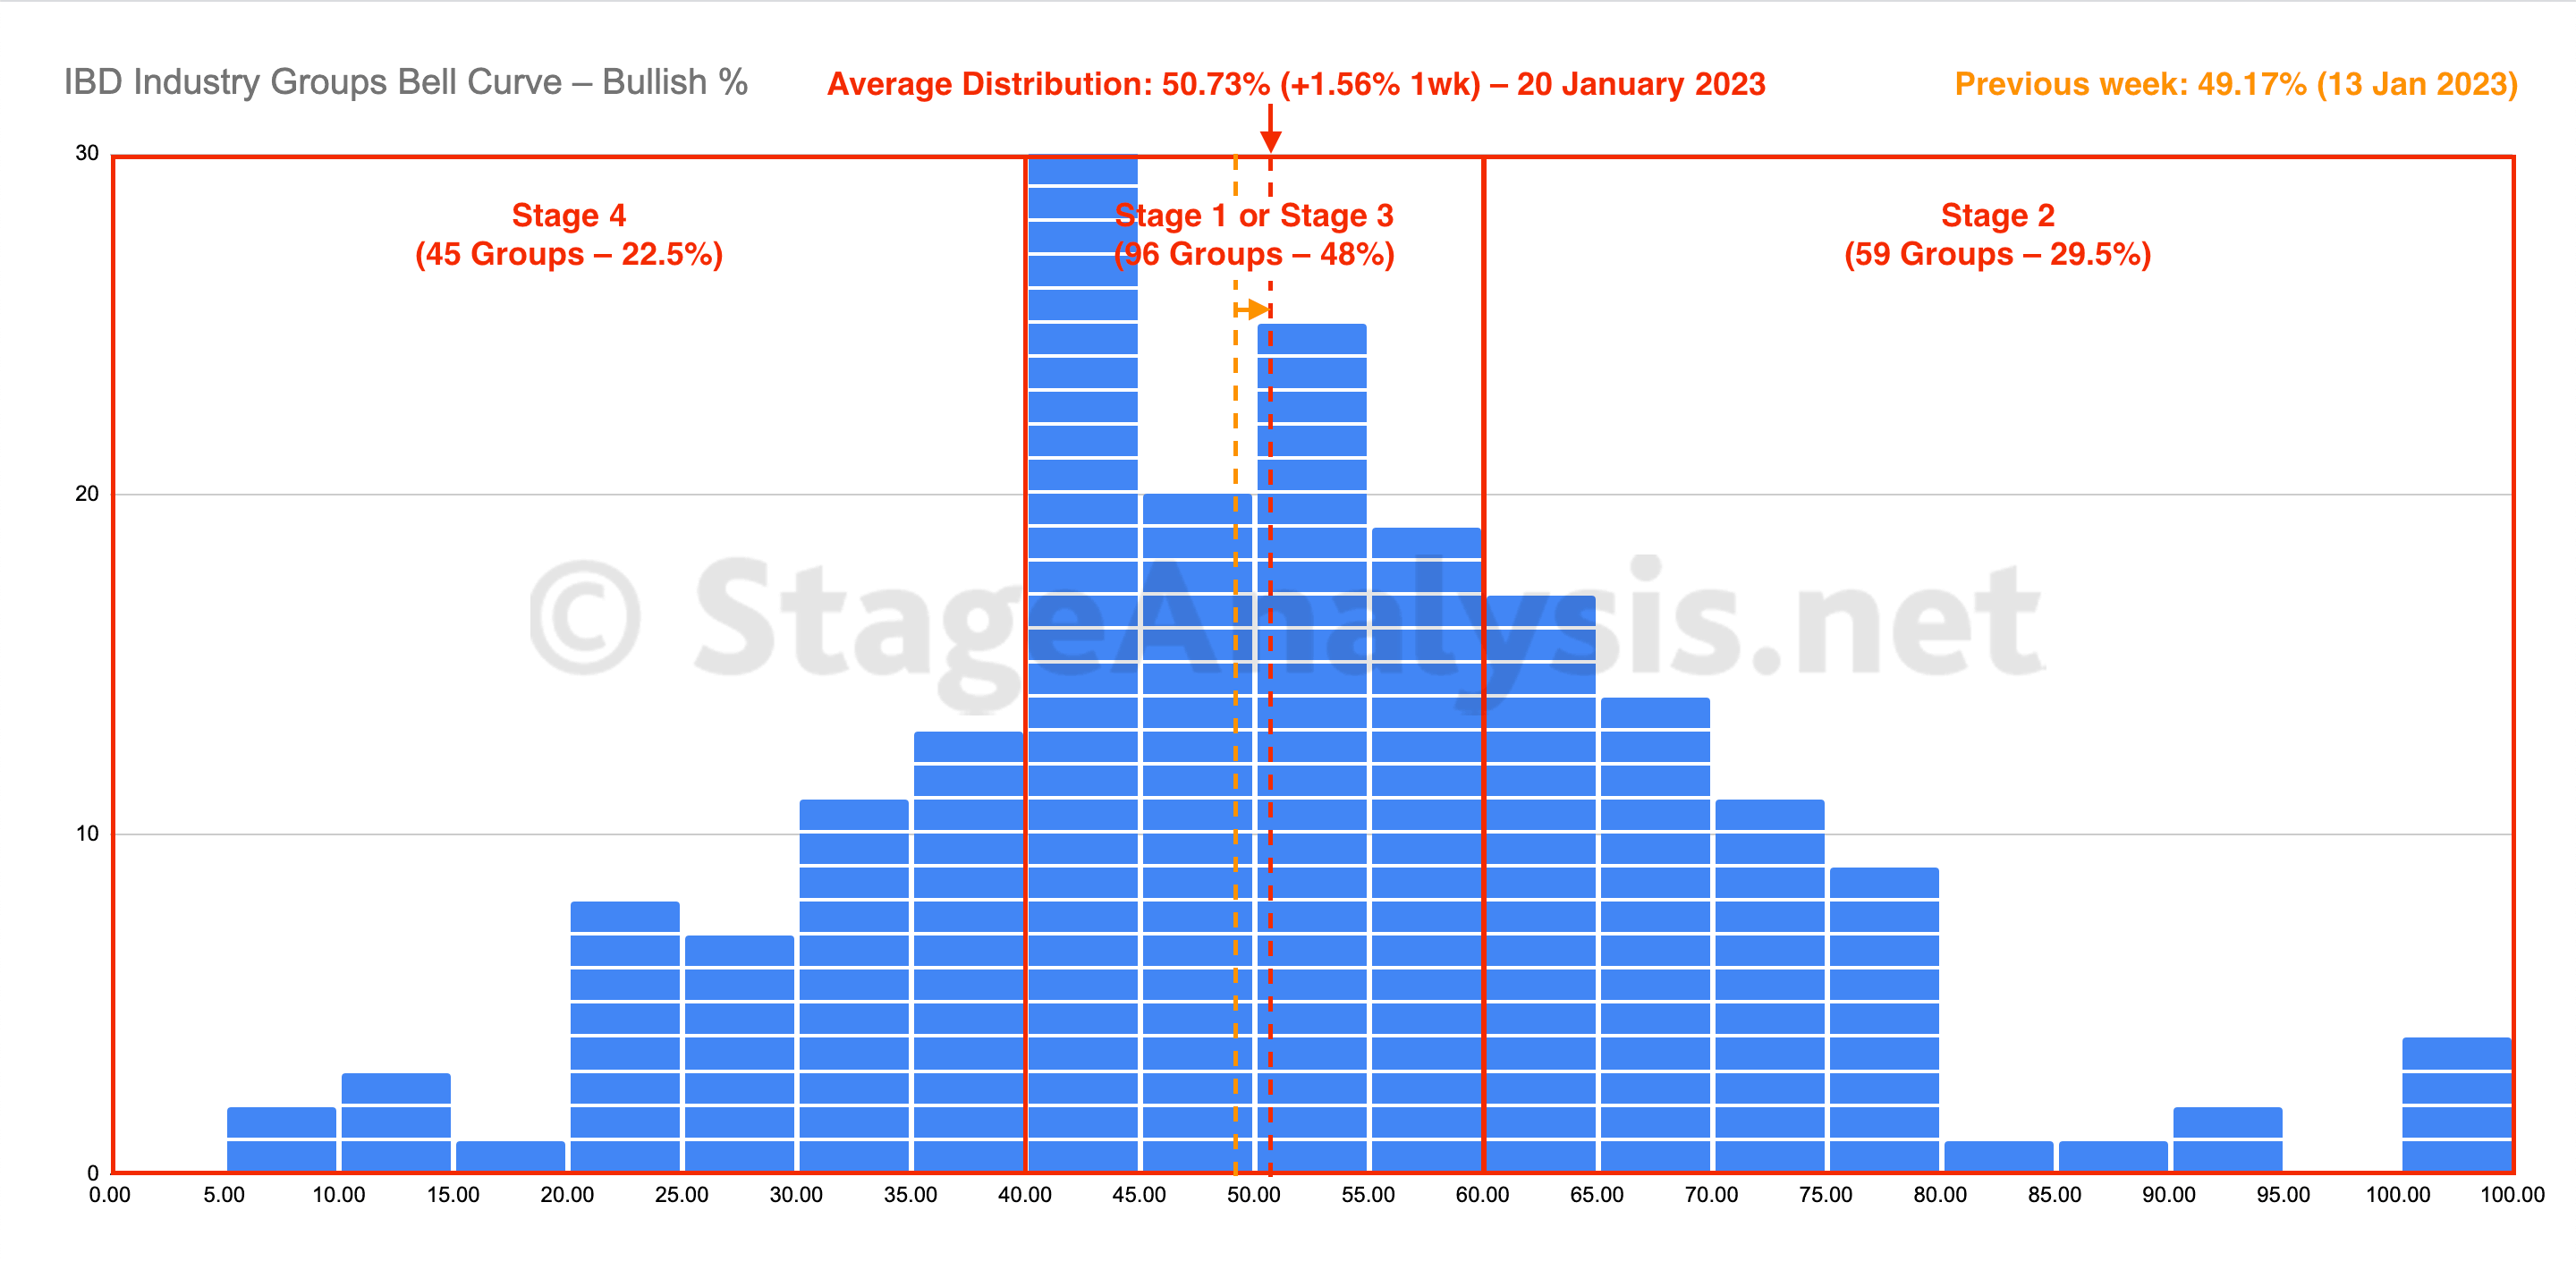
IBD Industry Groups Bell Curve – Bullish Percent
The IBD Industry Groups Bell Curve – Bullish Percent shows the few hundred industry groups plotted as a histogram chart and represents the percentage of stocks in each group that are on a point & figure (P&F) buy signal. This information provides a snapshot of the overall market health in a unique way, and is particularly useful for both market timing strategies and as a tool in aiding with the Stage Analysis methods "Forest to the Trees" approach, where we look for developing group themes...
Read More
20 May, 2023
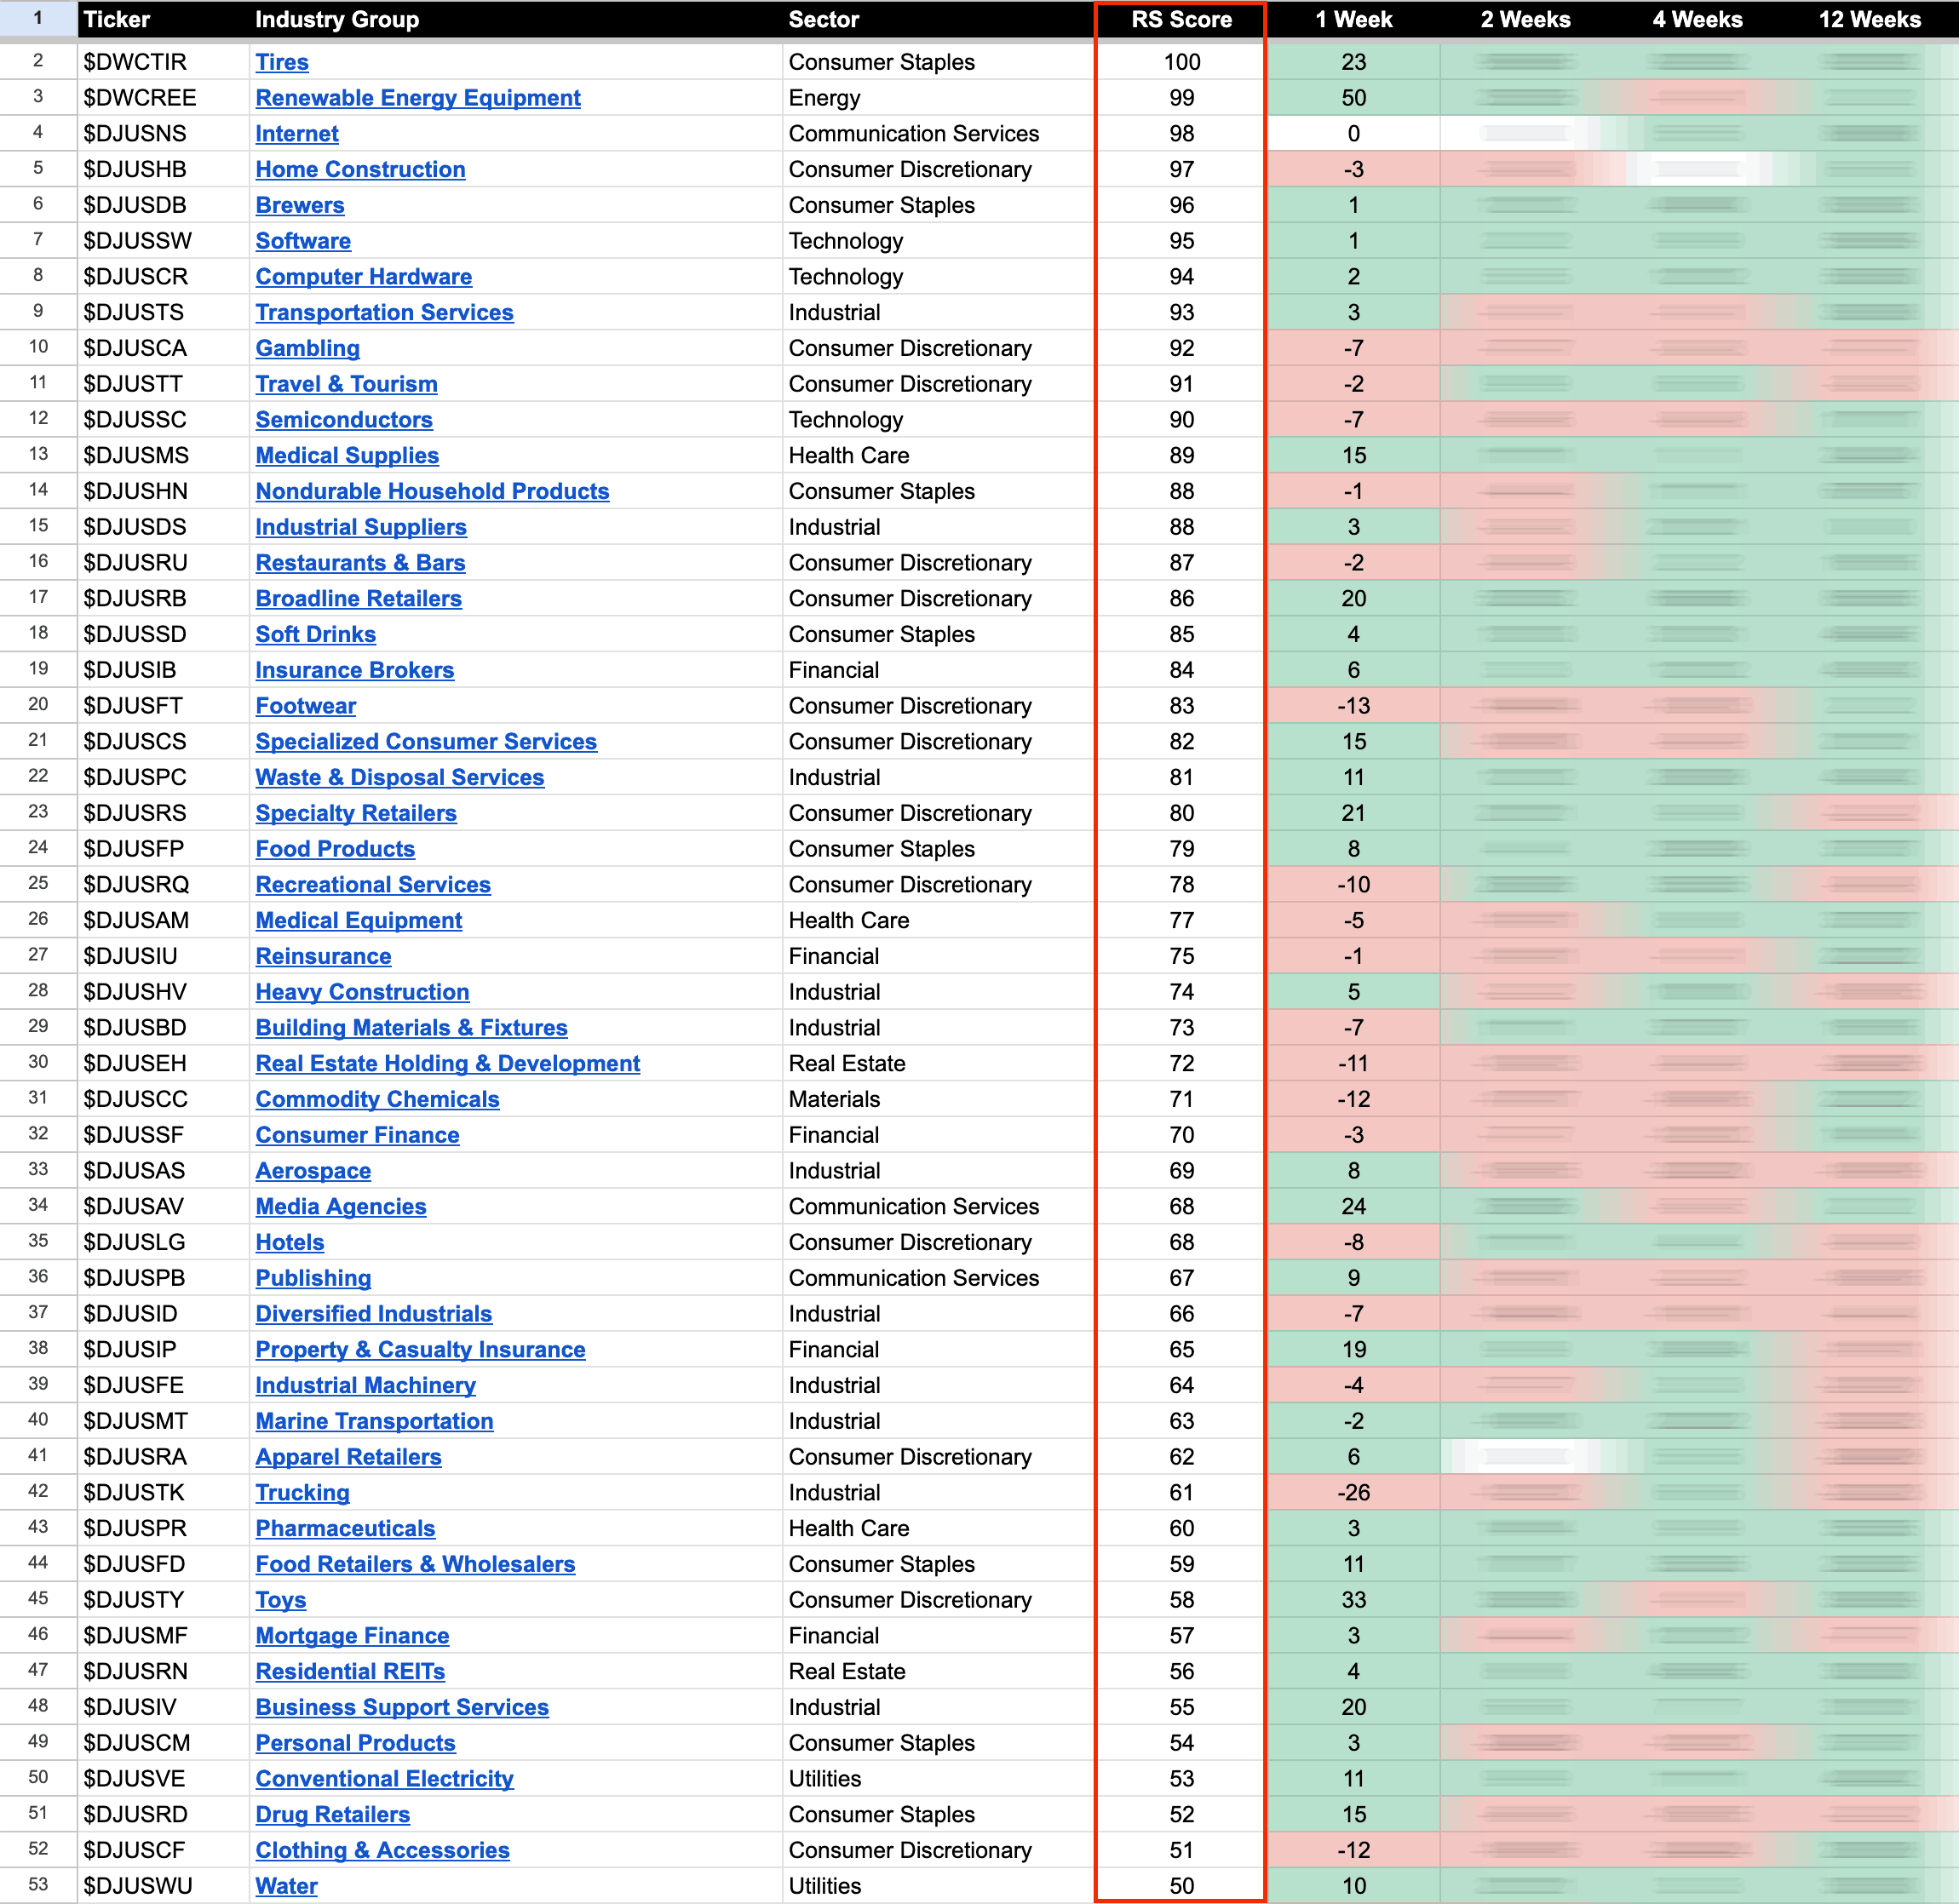
US Stocks Industry Groups Relative Strength Rankings
The purpose of the Relative Strength (RS) tables is to track the short, medium and long term RS changes of the individual groups to find the new leadership earlier than the crowd...
Read More
14 May, 2023
Stage Analysis Members Video – 14 May 2023 (1hr 28mins)
Stage Analysis weekend video featuring the weeks most significant Stage 2 Breakouts and Continuation attempts, plus the regular weekly member content of the Major Indexes Update, Futures SATA Charts, Industry Groups RS Rankings, IBD Industry Group Bell Curve, Market Breadth Update to help to determine the weight of evidence, and finishing by discussing the US Watchlist Stocks from the weekend scans in detail on multiple timeframes.
Read More
13 May, 2023
IBD Industry Groups Bell Curve – Bullish Percent
The IBD Industry Groups Bell Curve – Bullish Percent shows the few hundred industry groups plotted as a histogram chart and represents the percentage of stocks in each group that are on a point & figure (P&F) buy signal...
Read More
12 May, 2023
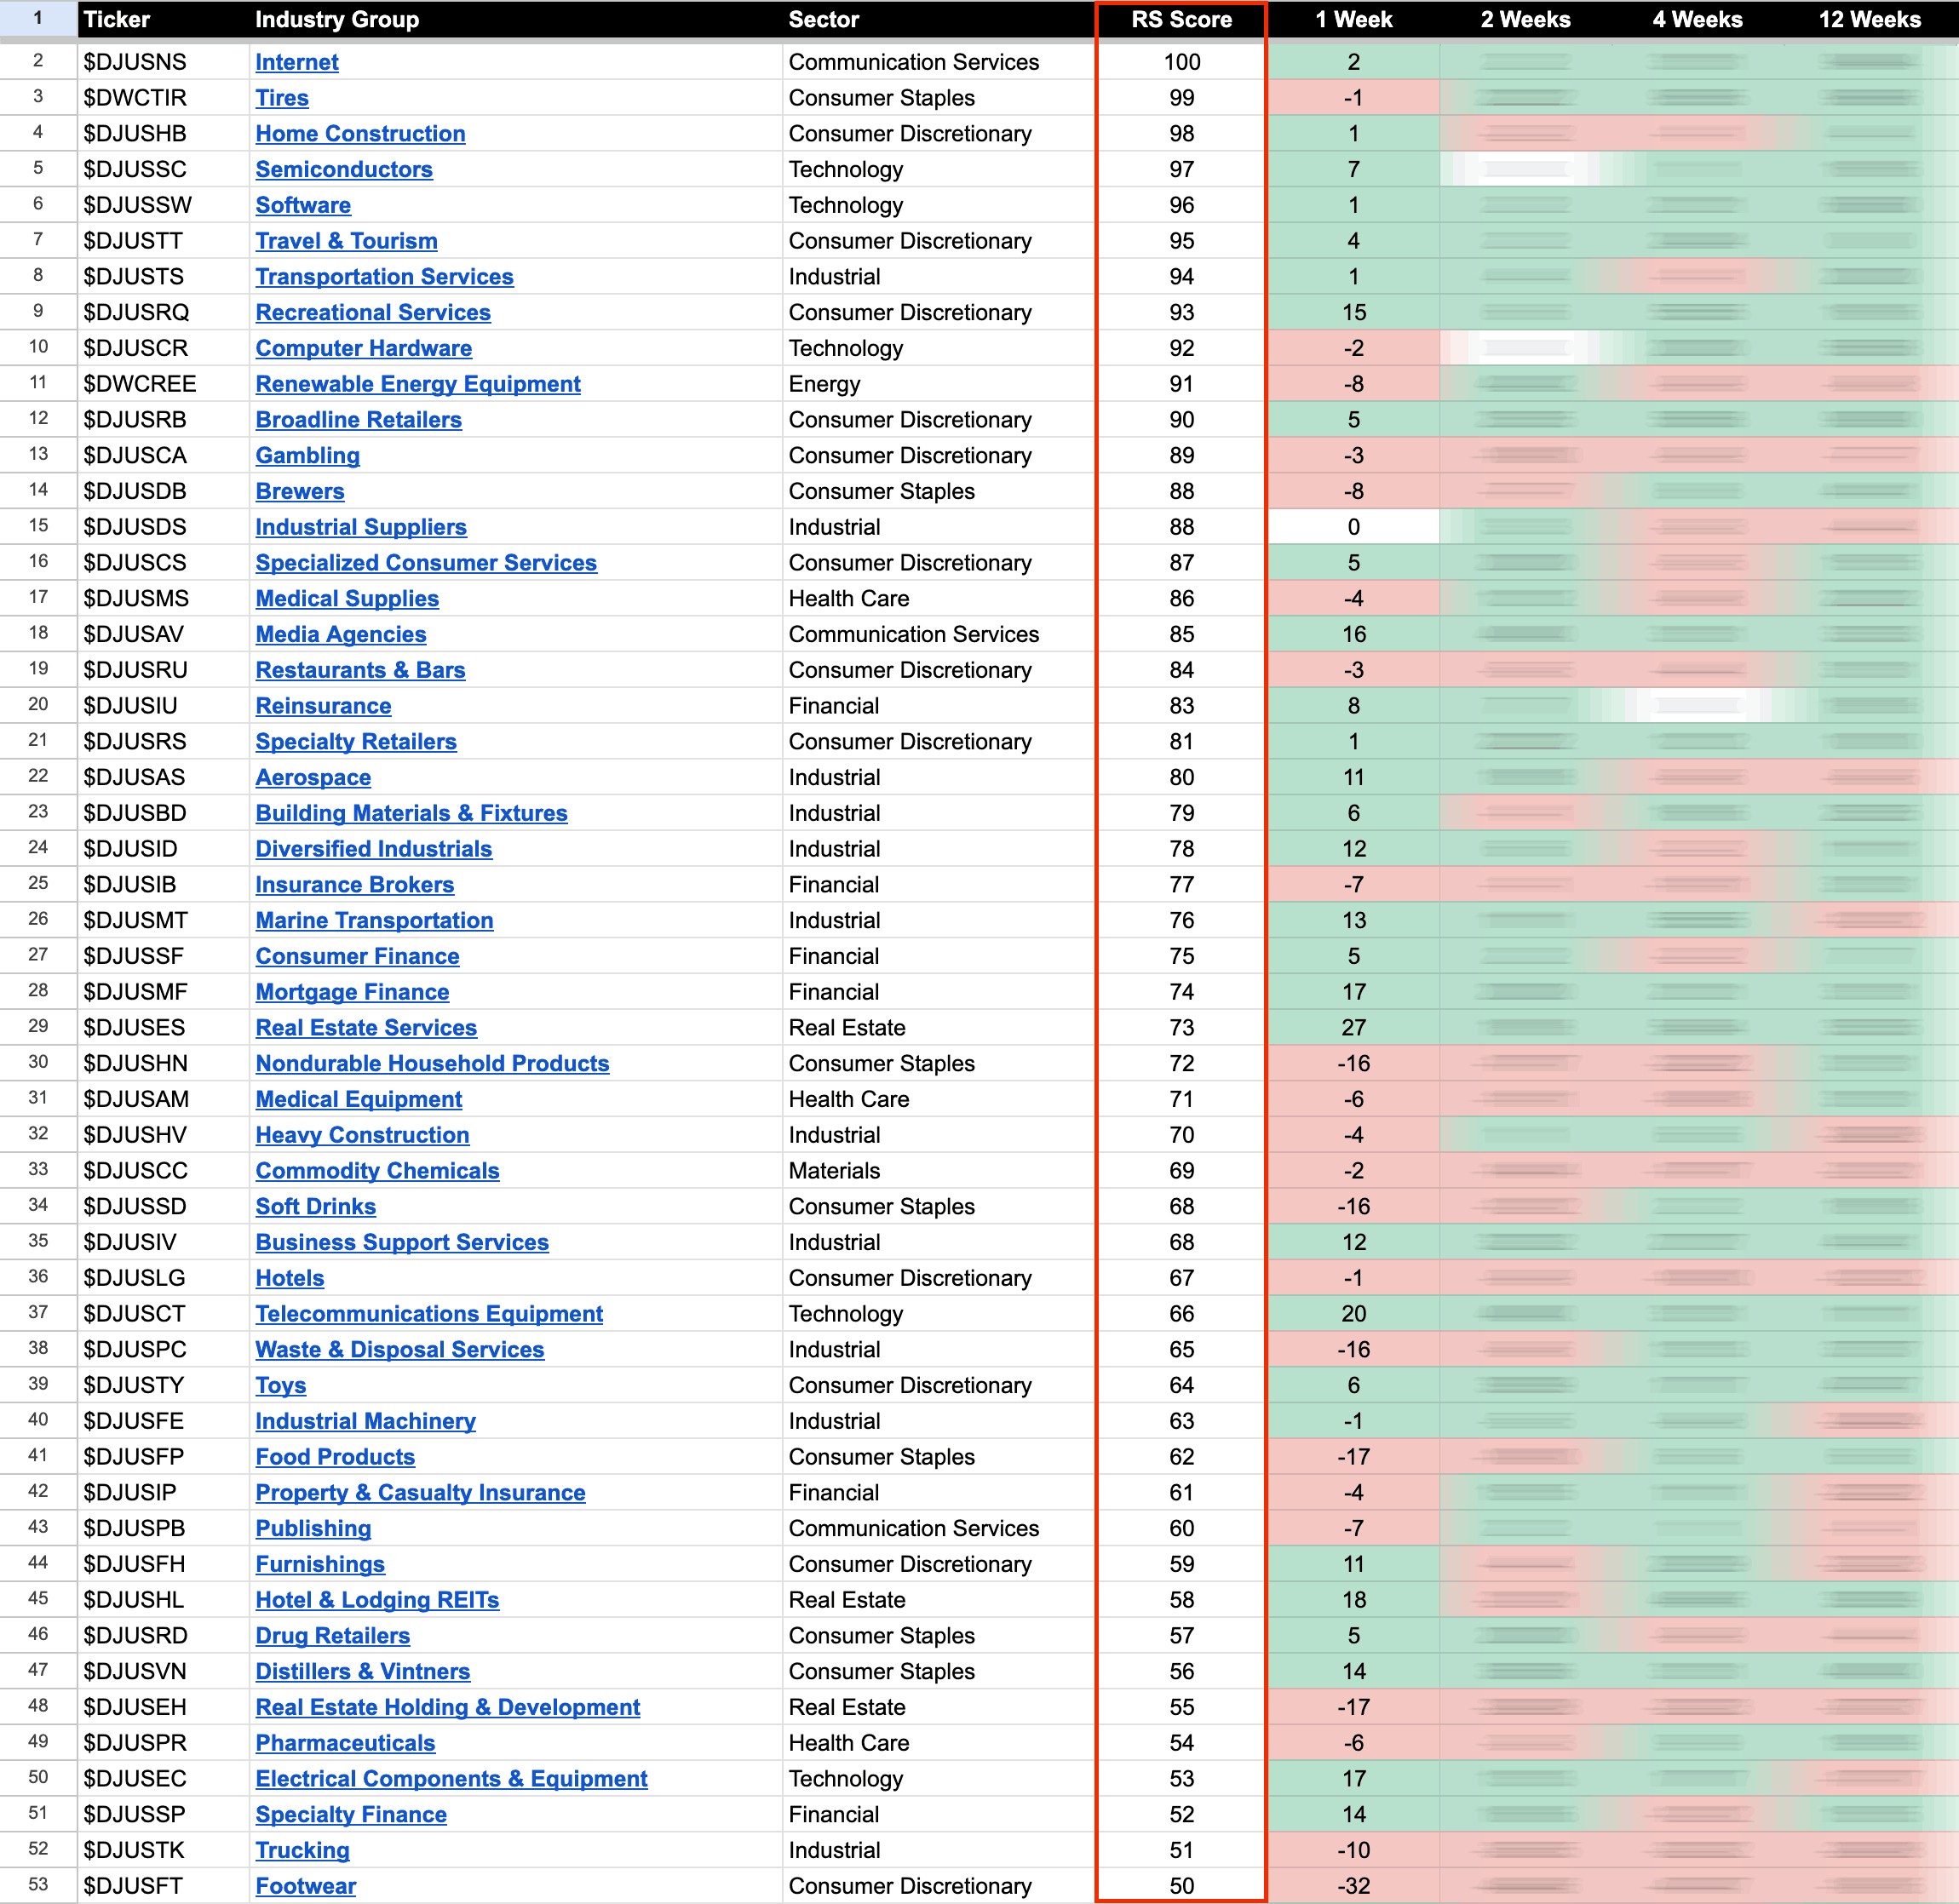
US Stocks Industry Groups Relative Strength Rankings
The purpose of the Relative Strength (RS) tables is to track the short, medium and long term RS changes of the individual groups to find the new leadership earlier than the crowd...
Read More
10 May, 2023
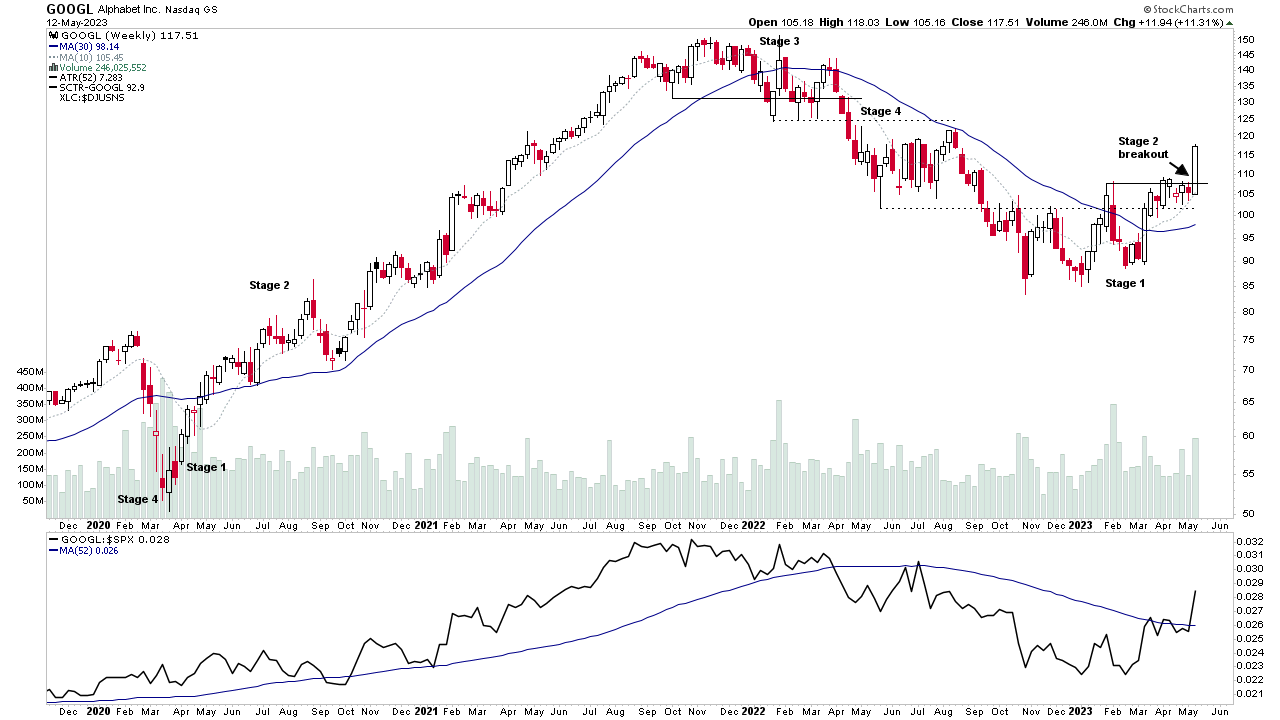
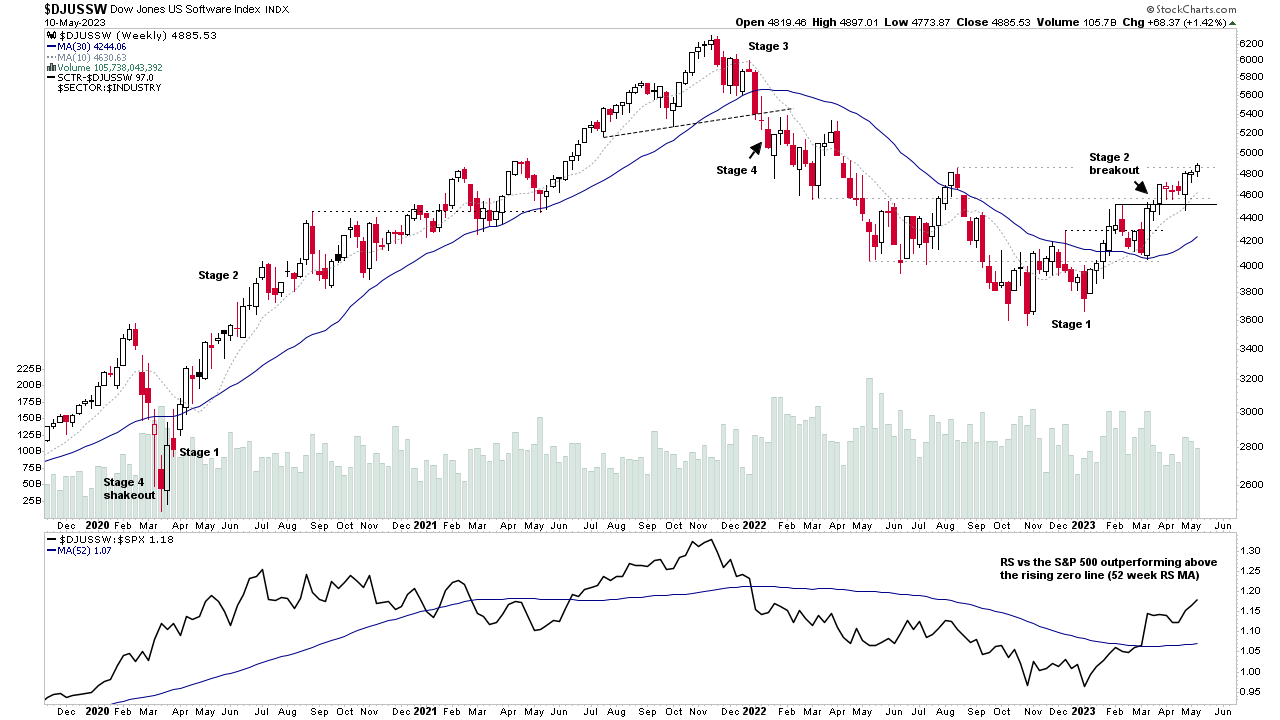
Software Group Focus Video – 10 May 2023 (57mins)
The Stage Analysis members midweek video this weeks returns to analyse the Software group once more, which has risen to 4th place in the RS rankings this week and continues to be a major theme in the regular Stage Analysis watchlist posts...
Read More
07 May, 2023
Stage Analysis Members Video – 7 May 2023 (1hr 21mins)
Stage Analysis weekend video begins this week with a detailed discussion of the charts of some of the weeks Stage 2 breakouts and continuation attempts...
Read More