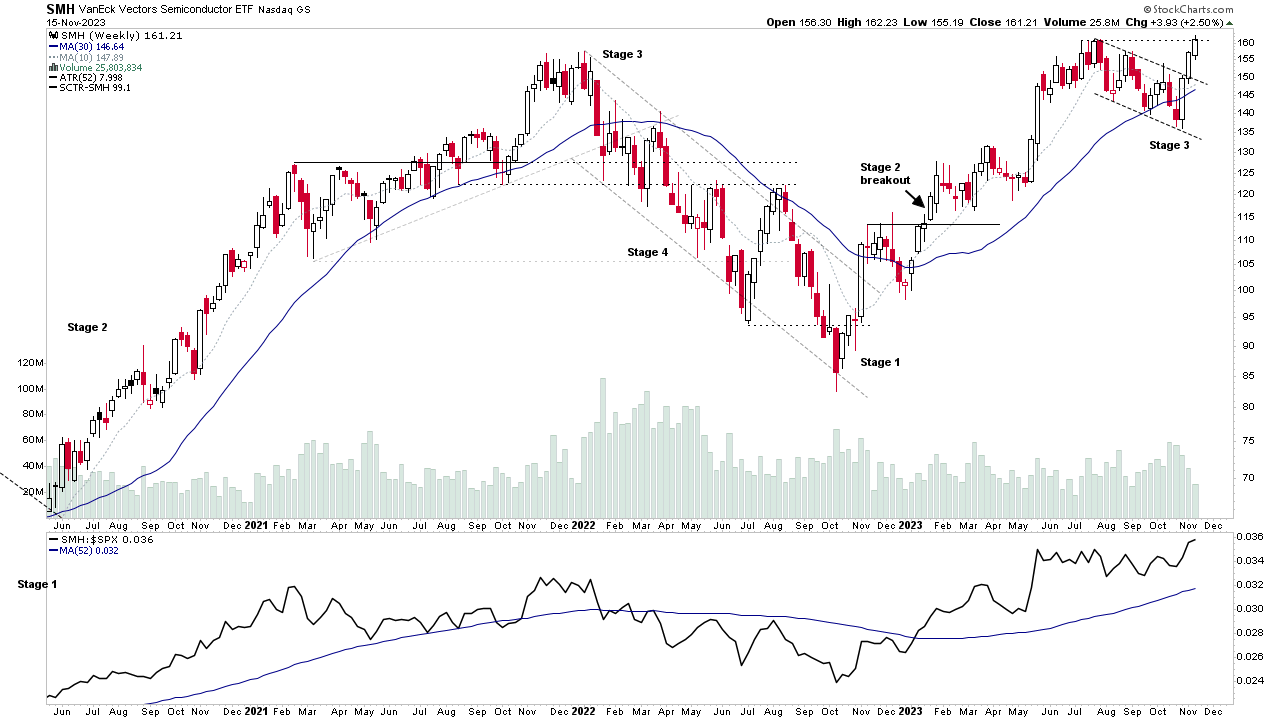
A special group focus on the Semiconductors group, which has risen back to the top of the industry group relative strength (RS) rankings in the last few weeks, as the group chart attempts to breakout out to new 52 week highs from the recent Stage 3 structure...
Read More

Blog
15 November, 2023
Group Focus Video: Semiconductors – 15 November 2023 (49mins)
13 November, 2023
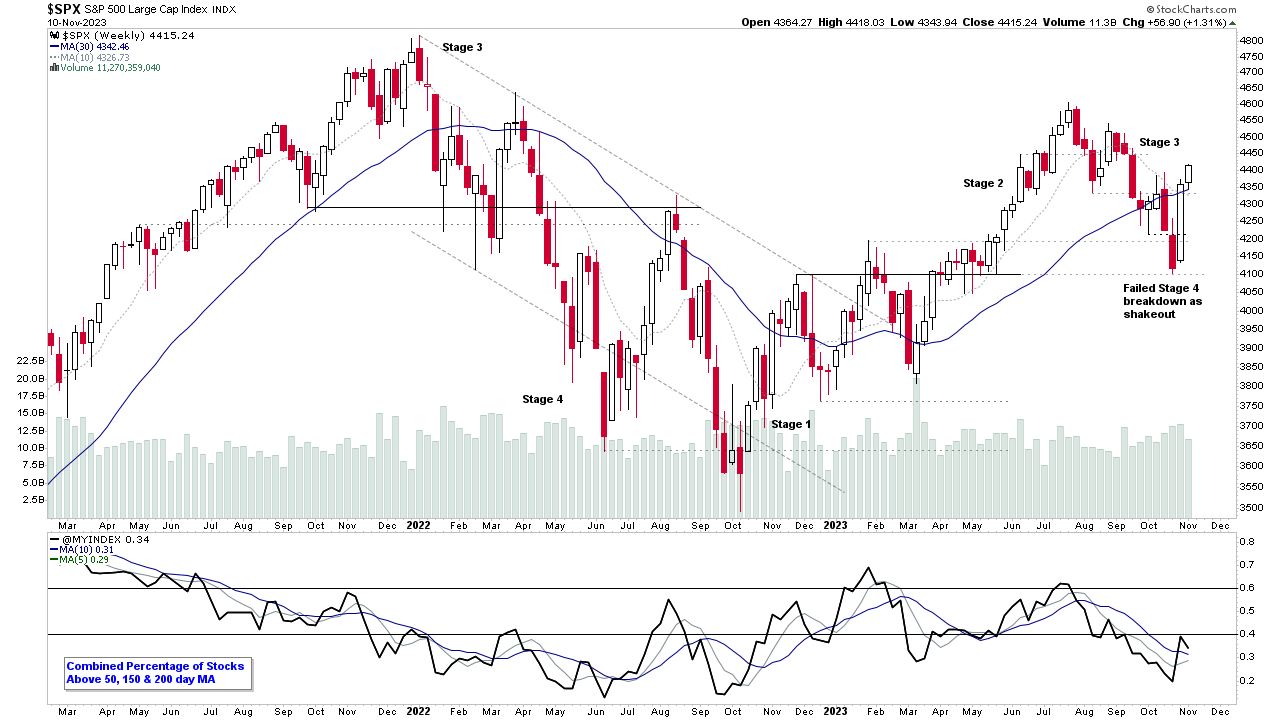
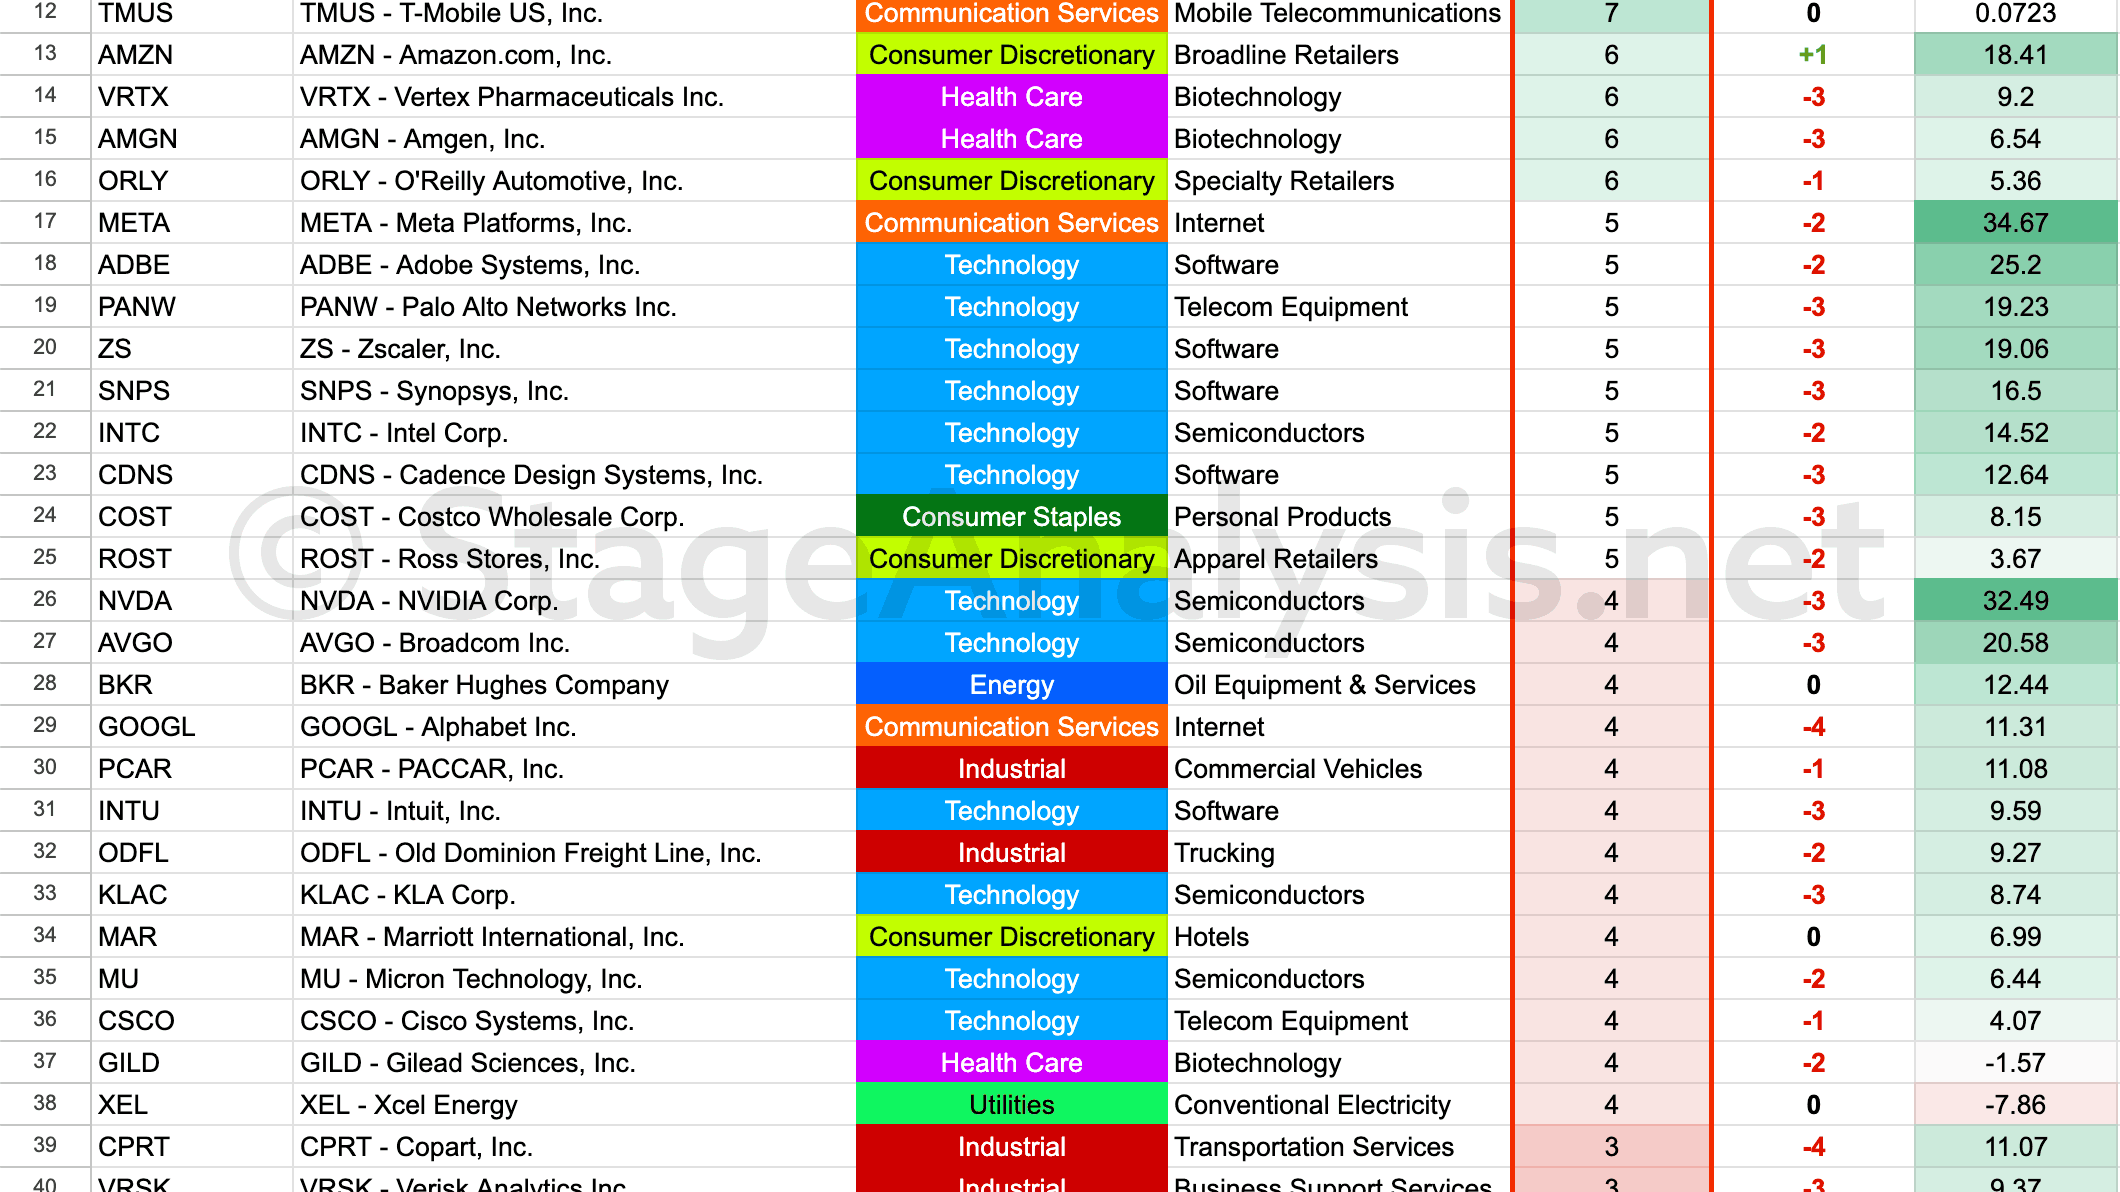
Stage Analysis Technical Attributes Scores – Nasdaq 100
The Stage Analysis Technical Attributes (SATA) score is our proprietary indicator that helps to identify the four stages from Stan Weinstein's Stage Analysis method, using a scoring system from 0 to 10 that rates ten of the key technical characteristics that we look for when analysing the weekly charts.
Read More
12 November, 2023
Stage Analysis Members Video – 12 November 2023 (1hr 11mins)
Stage Analysis members weekend video covering the Major US Indexes, Futures Charts, Industry Groups Relative Strength (RS) Rankings, IBD Industry Group Bell Curve – Bullish Percent, Significant Weekly Bars, Crypto Coins update and the US watchlist stocks in detail on multiple timeframes.
Read More
12 November, 2023
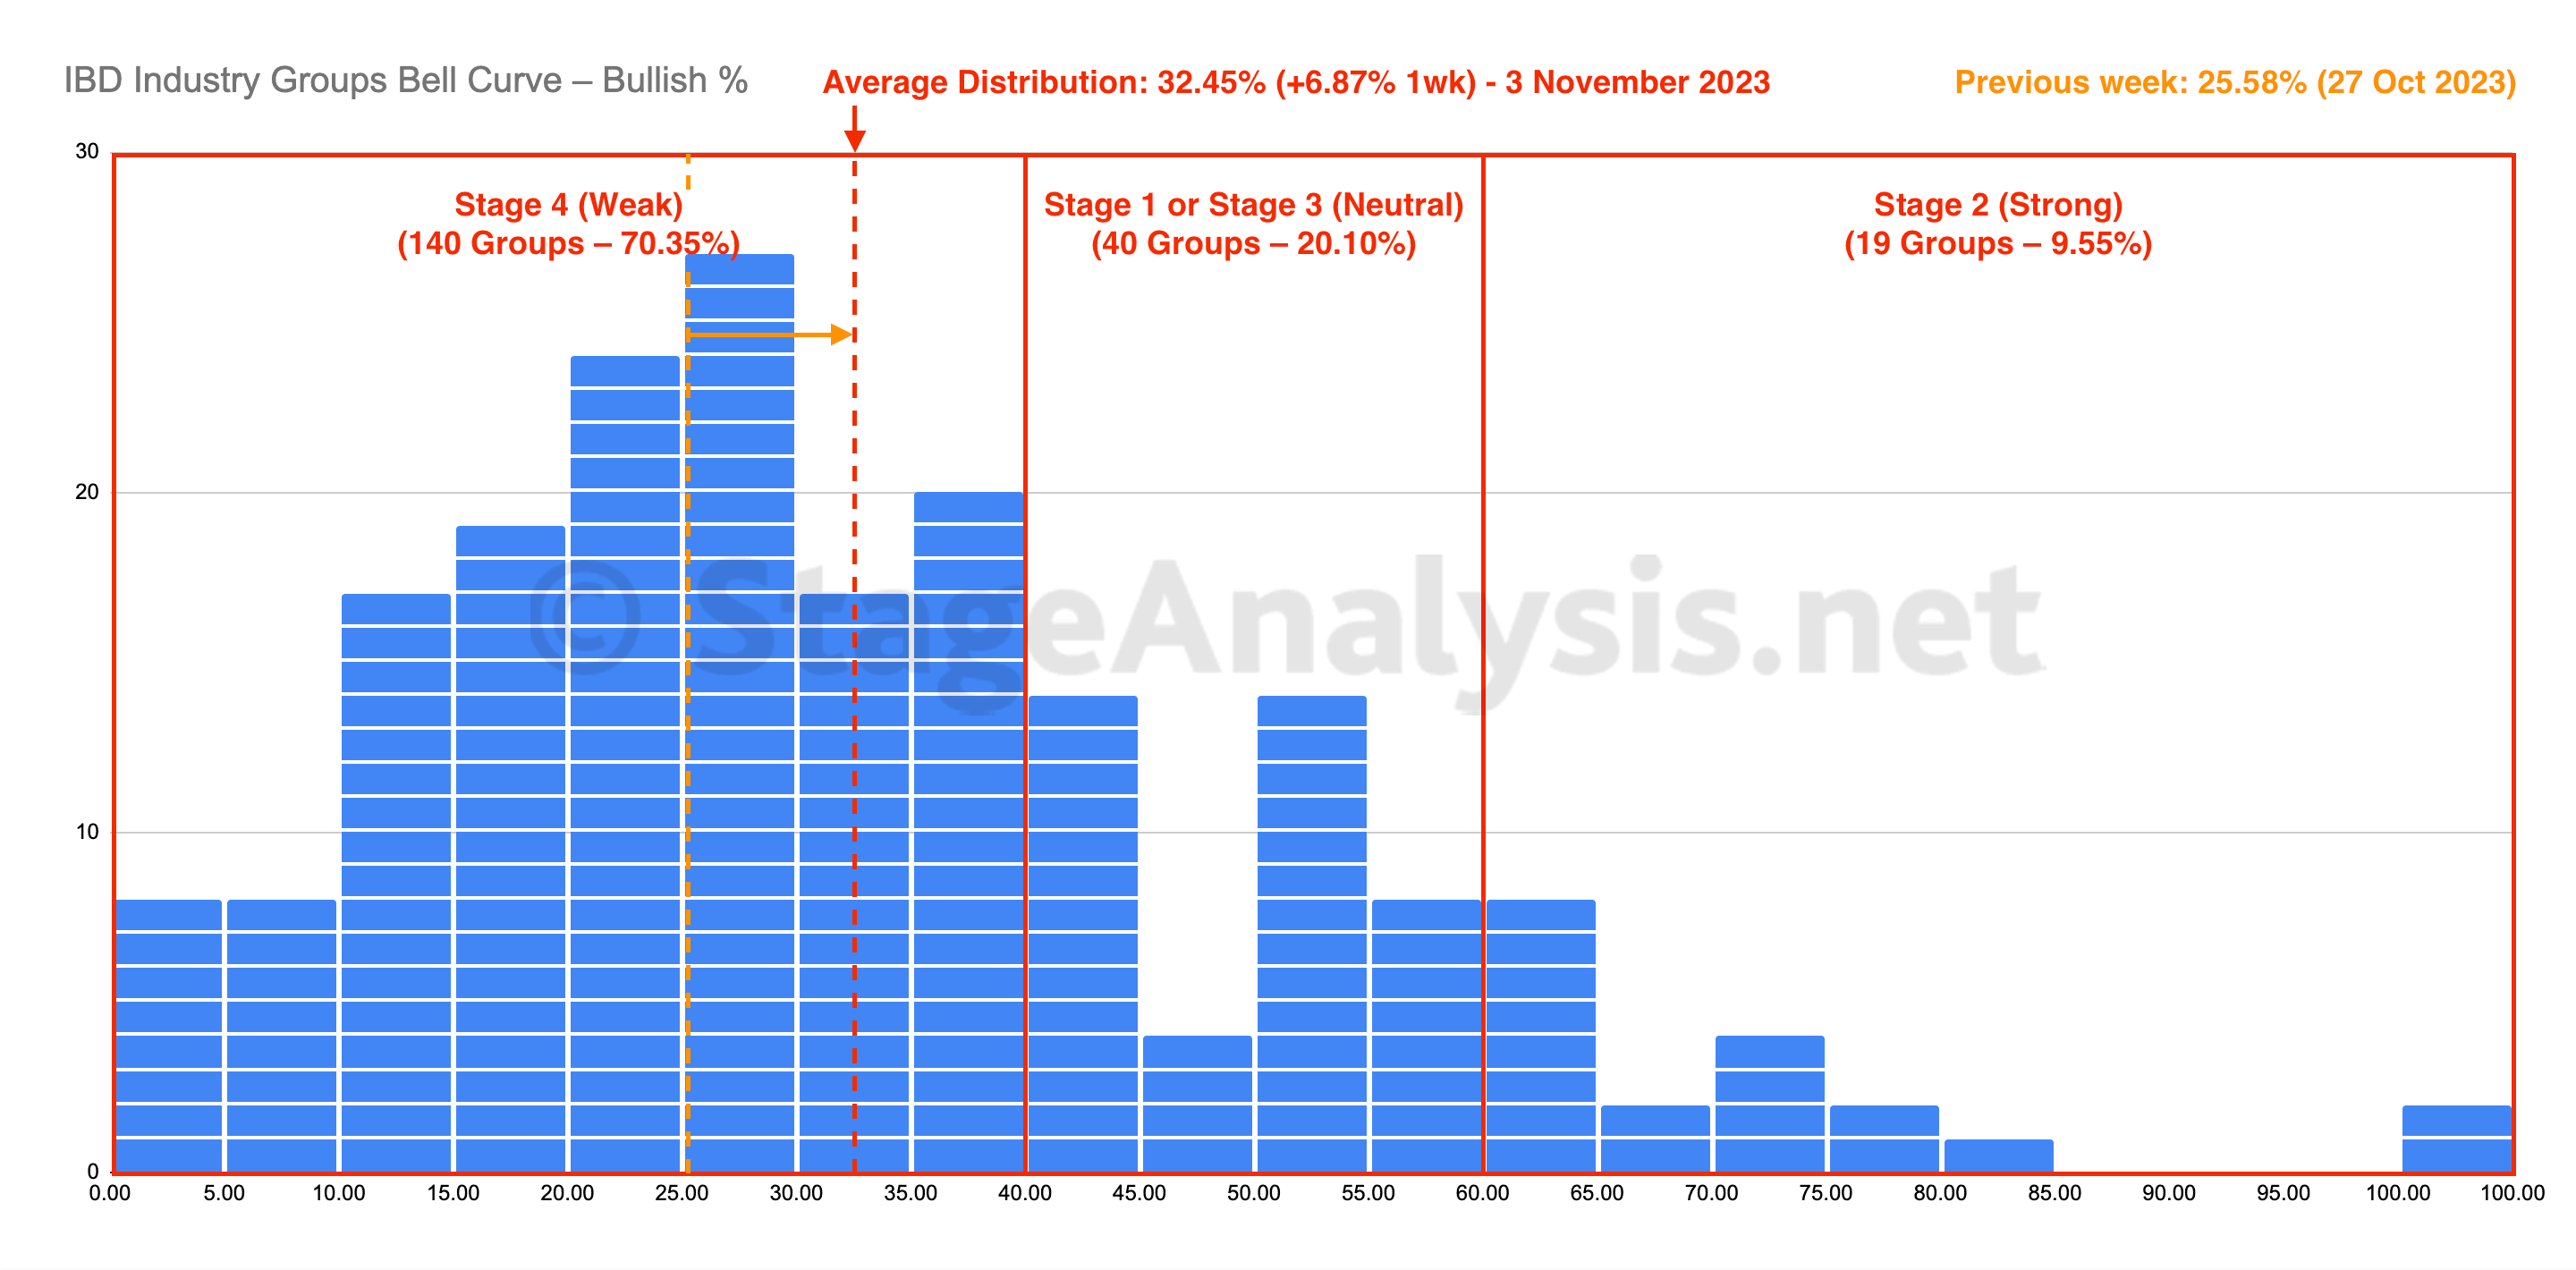
IBD Industry Groups Bell Curve – Bullish Percent
The IBD Industry Groups Bell Curve – Bullish Percent shows the few hundred industry groups plotted as a histogram chart and represents the percentage of stocks in each group that are on a point & figure (P&F) buy signal...
Read More
10 November, 2023
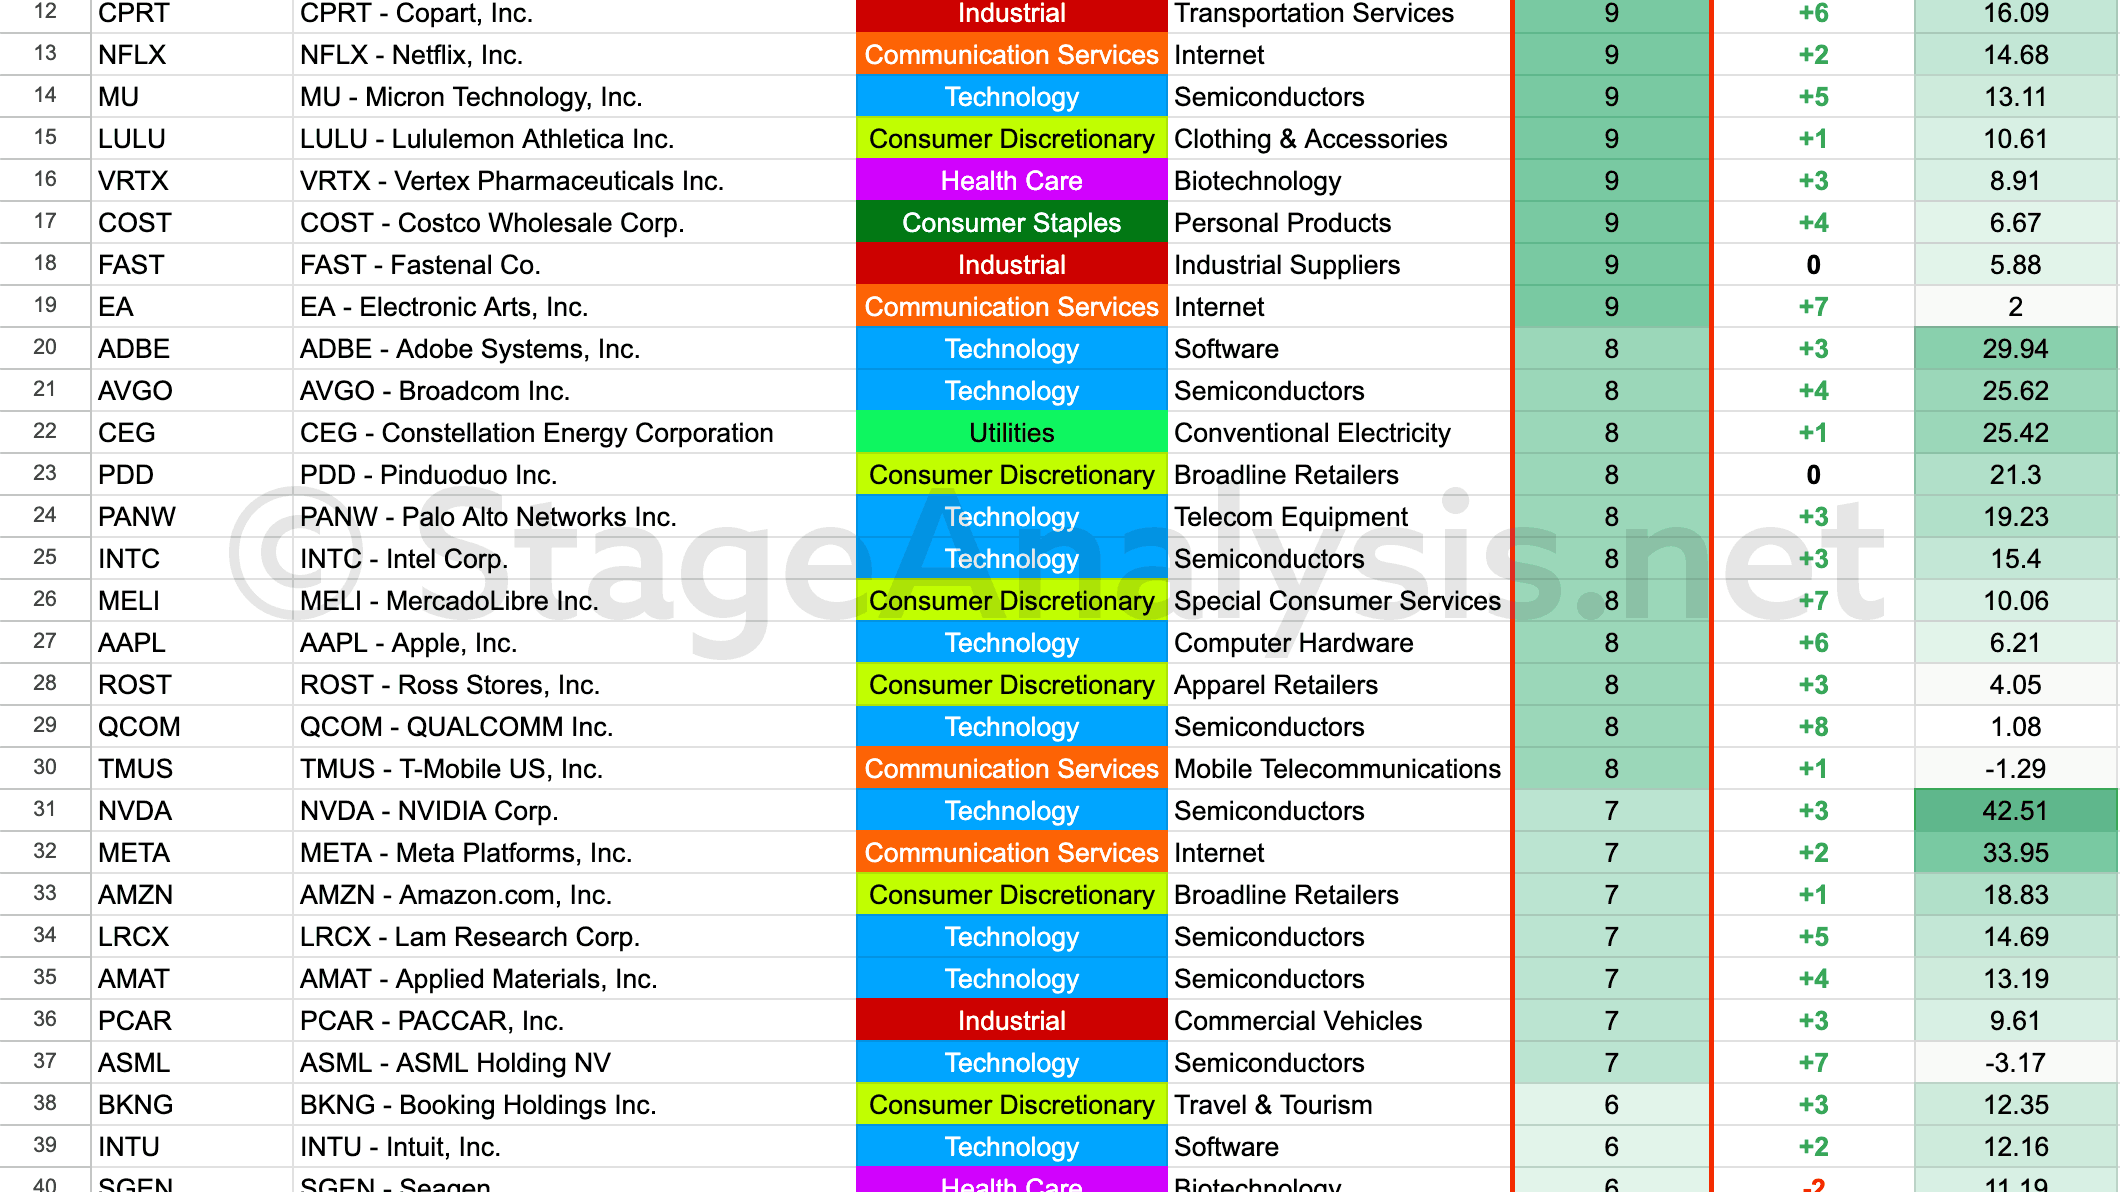
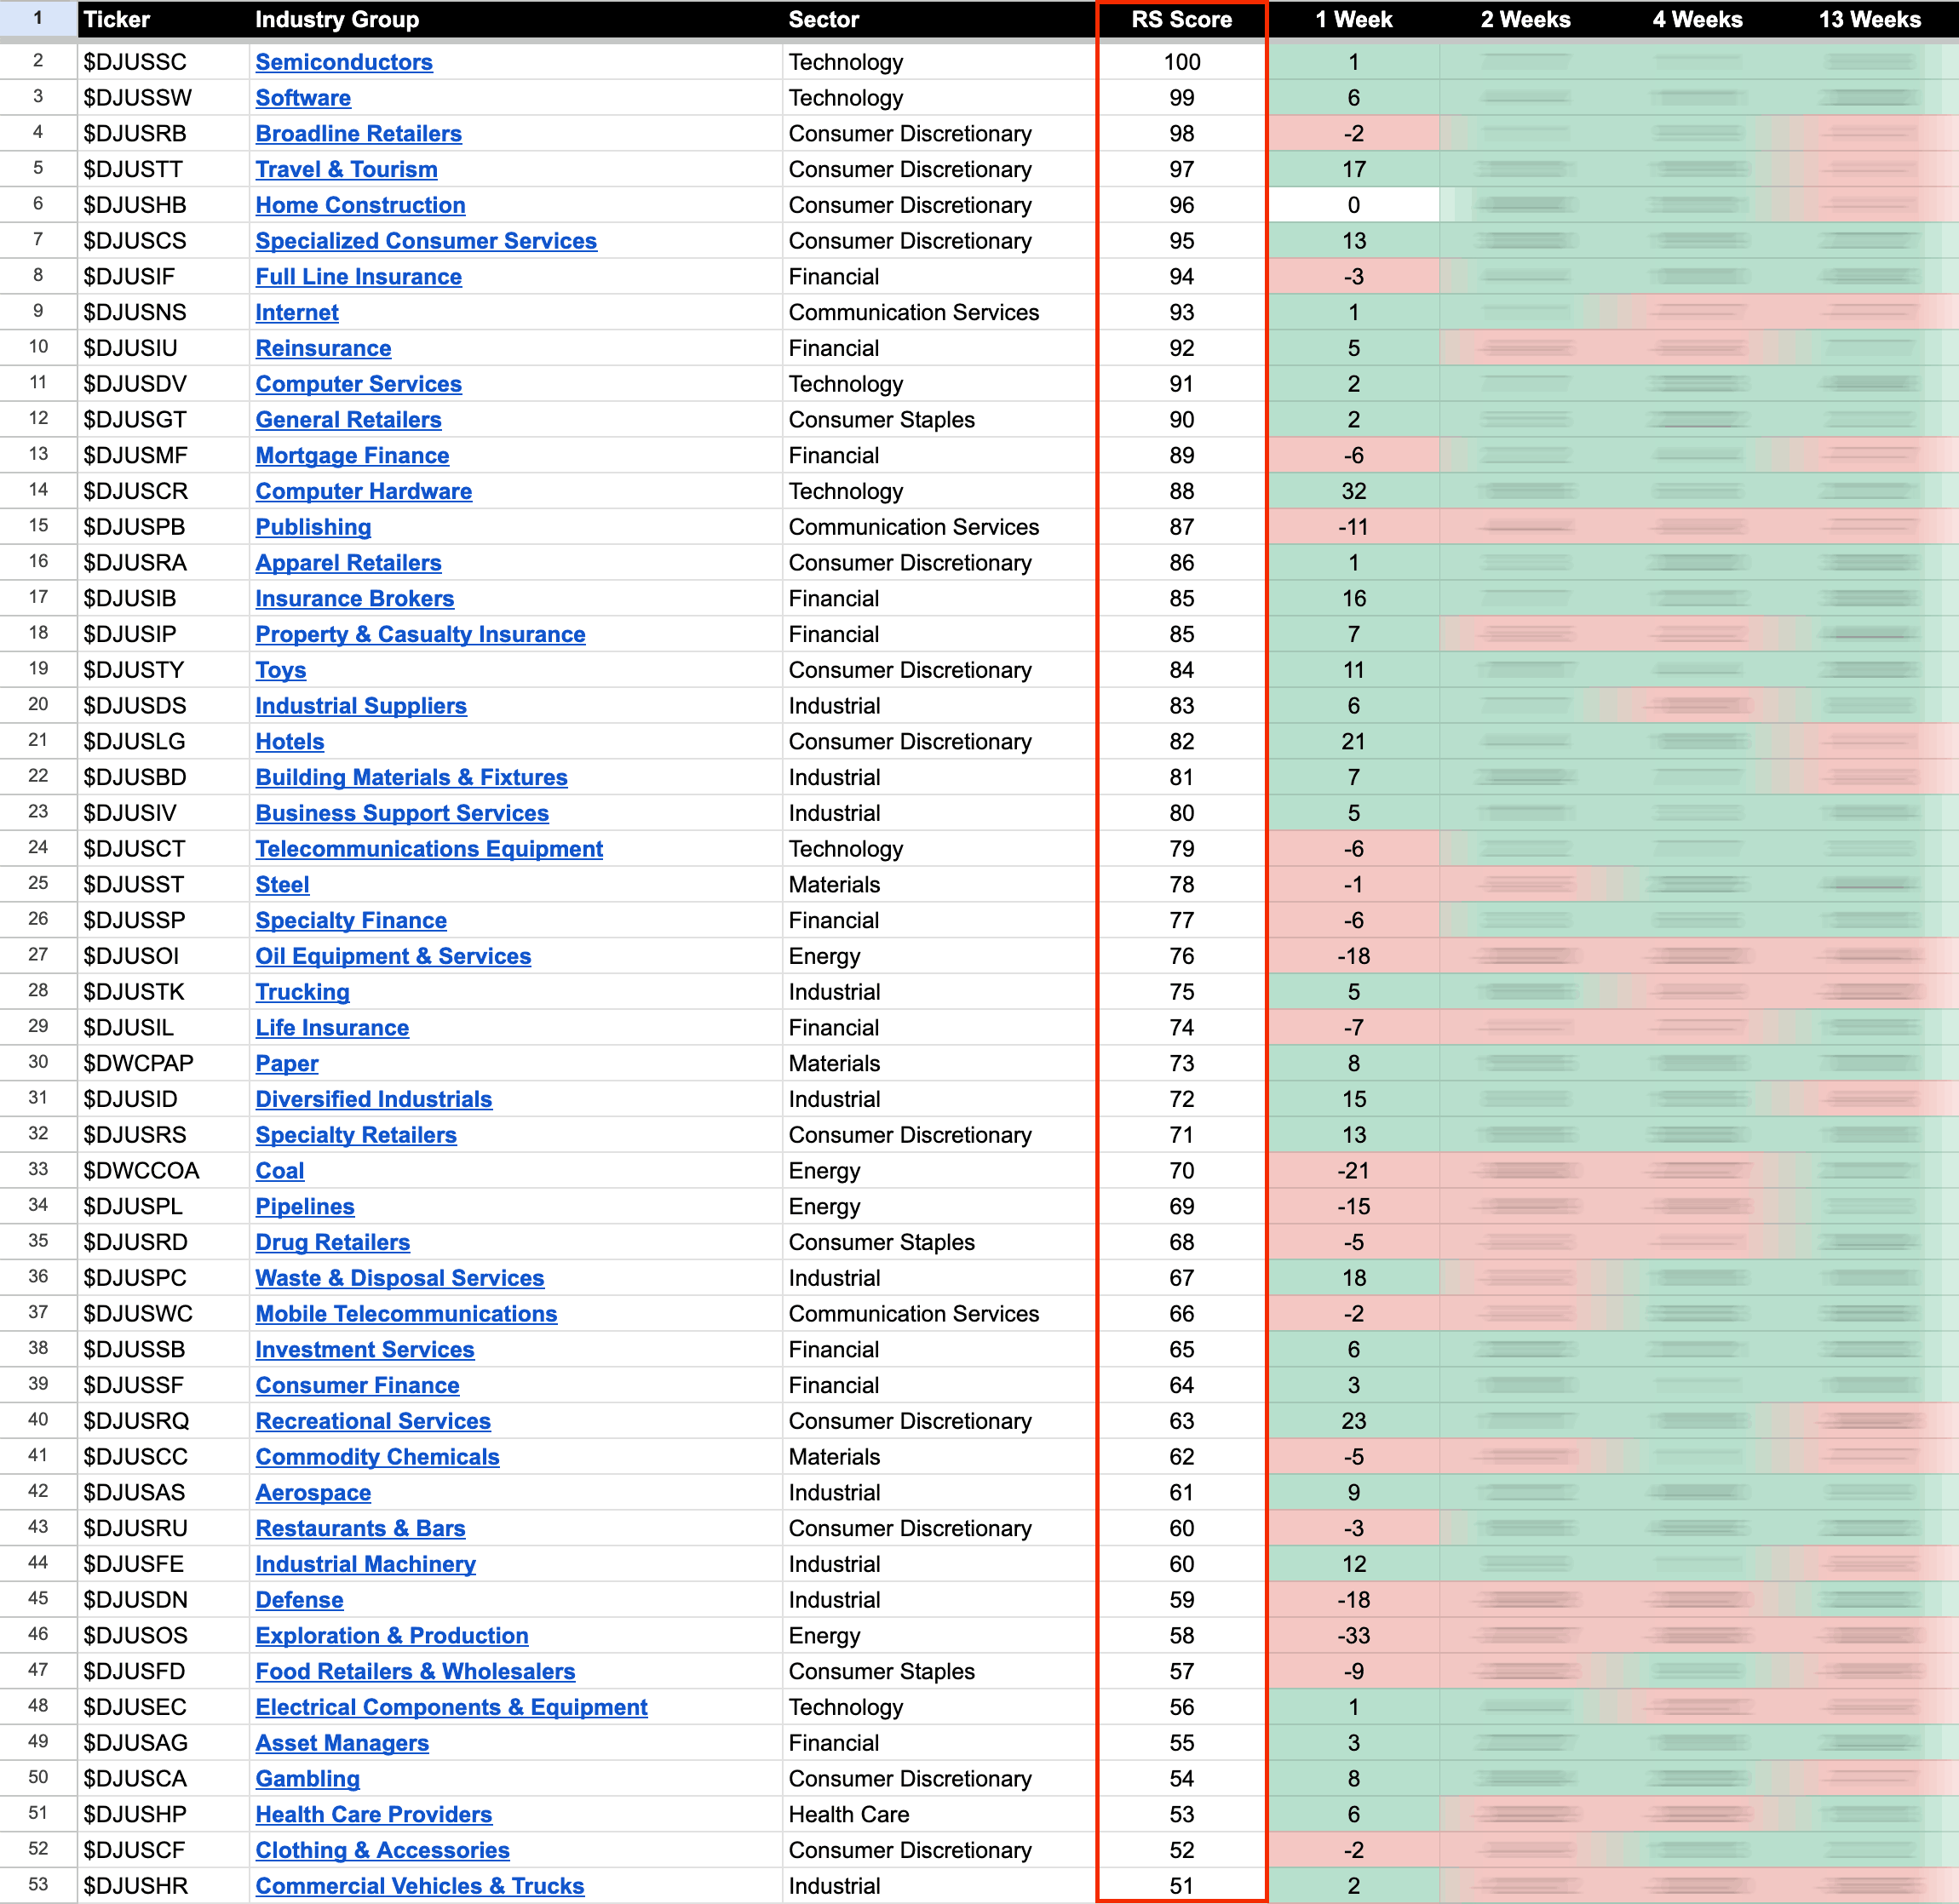
US Stocks Industry Groups Relative Strength Rankings
The purpose of the Relative Strength (RS) tables is to track the short, medium and long term RS changes of the individual groups to find the new leadership earlier than the crowd...
Read More
05 November, 2023
Stage Analysis Members Video – 5 November 2023 (1hr 33mins)
The Stage Analysis members weekend video begins with a look at some of the weeks significant bars in individual stocks, after a huge change of behaviour in the broad market. Followed by the regular weekend content of the Major US Indexes, the Futures Charts, Industry Groups Relative Strength (RS) Rankings, IBD Industry Group Bell Curve – Bullish Percent, and US watchlist stocks in detail on multiple timeframes.
Read More
04 November, 2023
IBD Industry Groups Bell Curve – Bullish Percent
The IBD Industry Groups Bell Curve increased by +6.87% this week to finish at 32.45% overall. The amount of groups in Stage 4 (Weak) decreased by 23 (-11.6%), and the amount of groups in Stage 2 (Strong) increased by 3 (+1.5%), while the amount groups in Stage 1 or Stage 3 (Neutral) increased by 20 (+10%)...
Read More
03 November, 2023
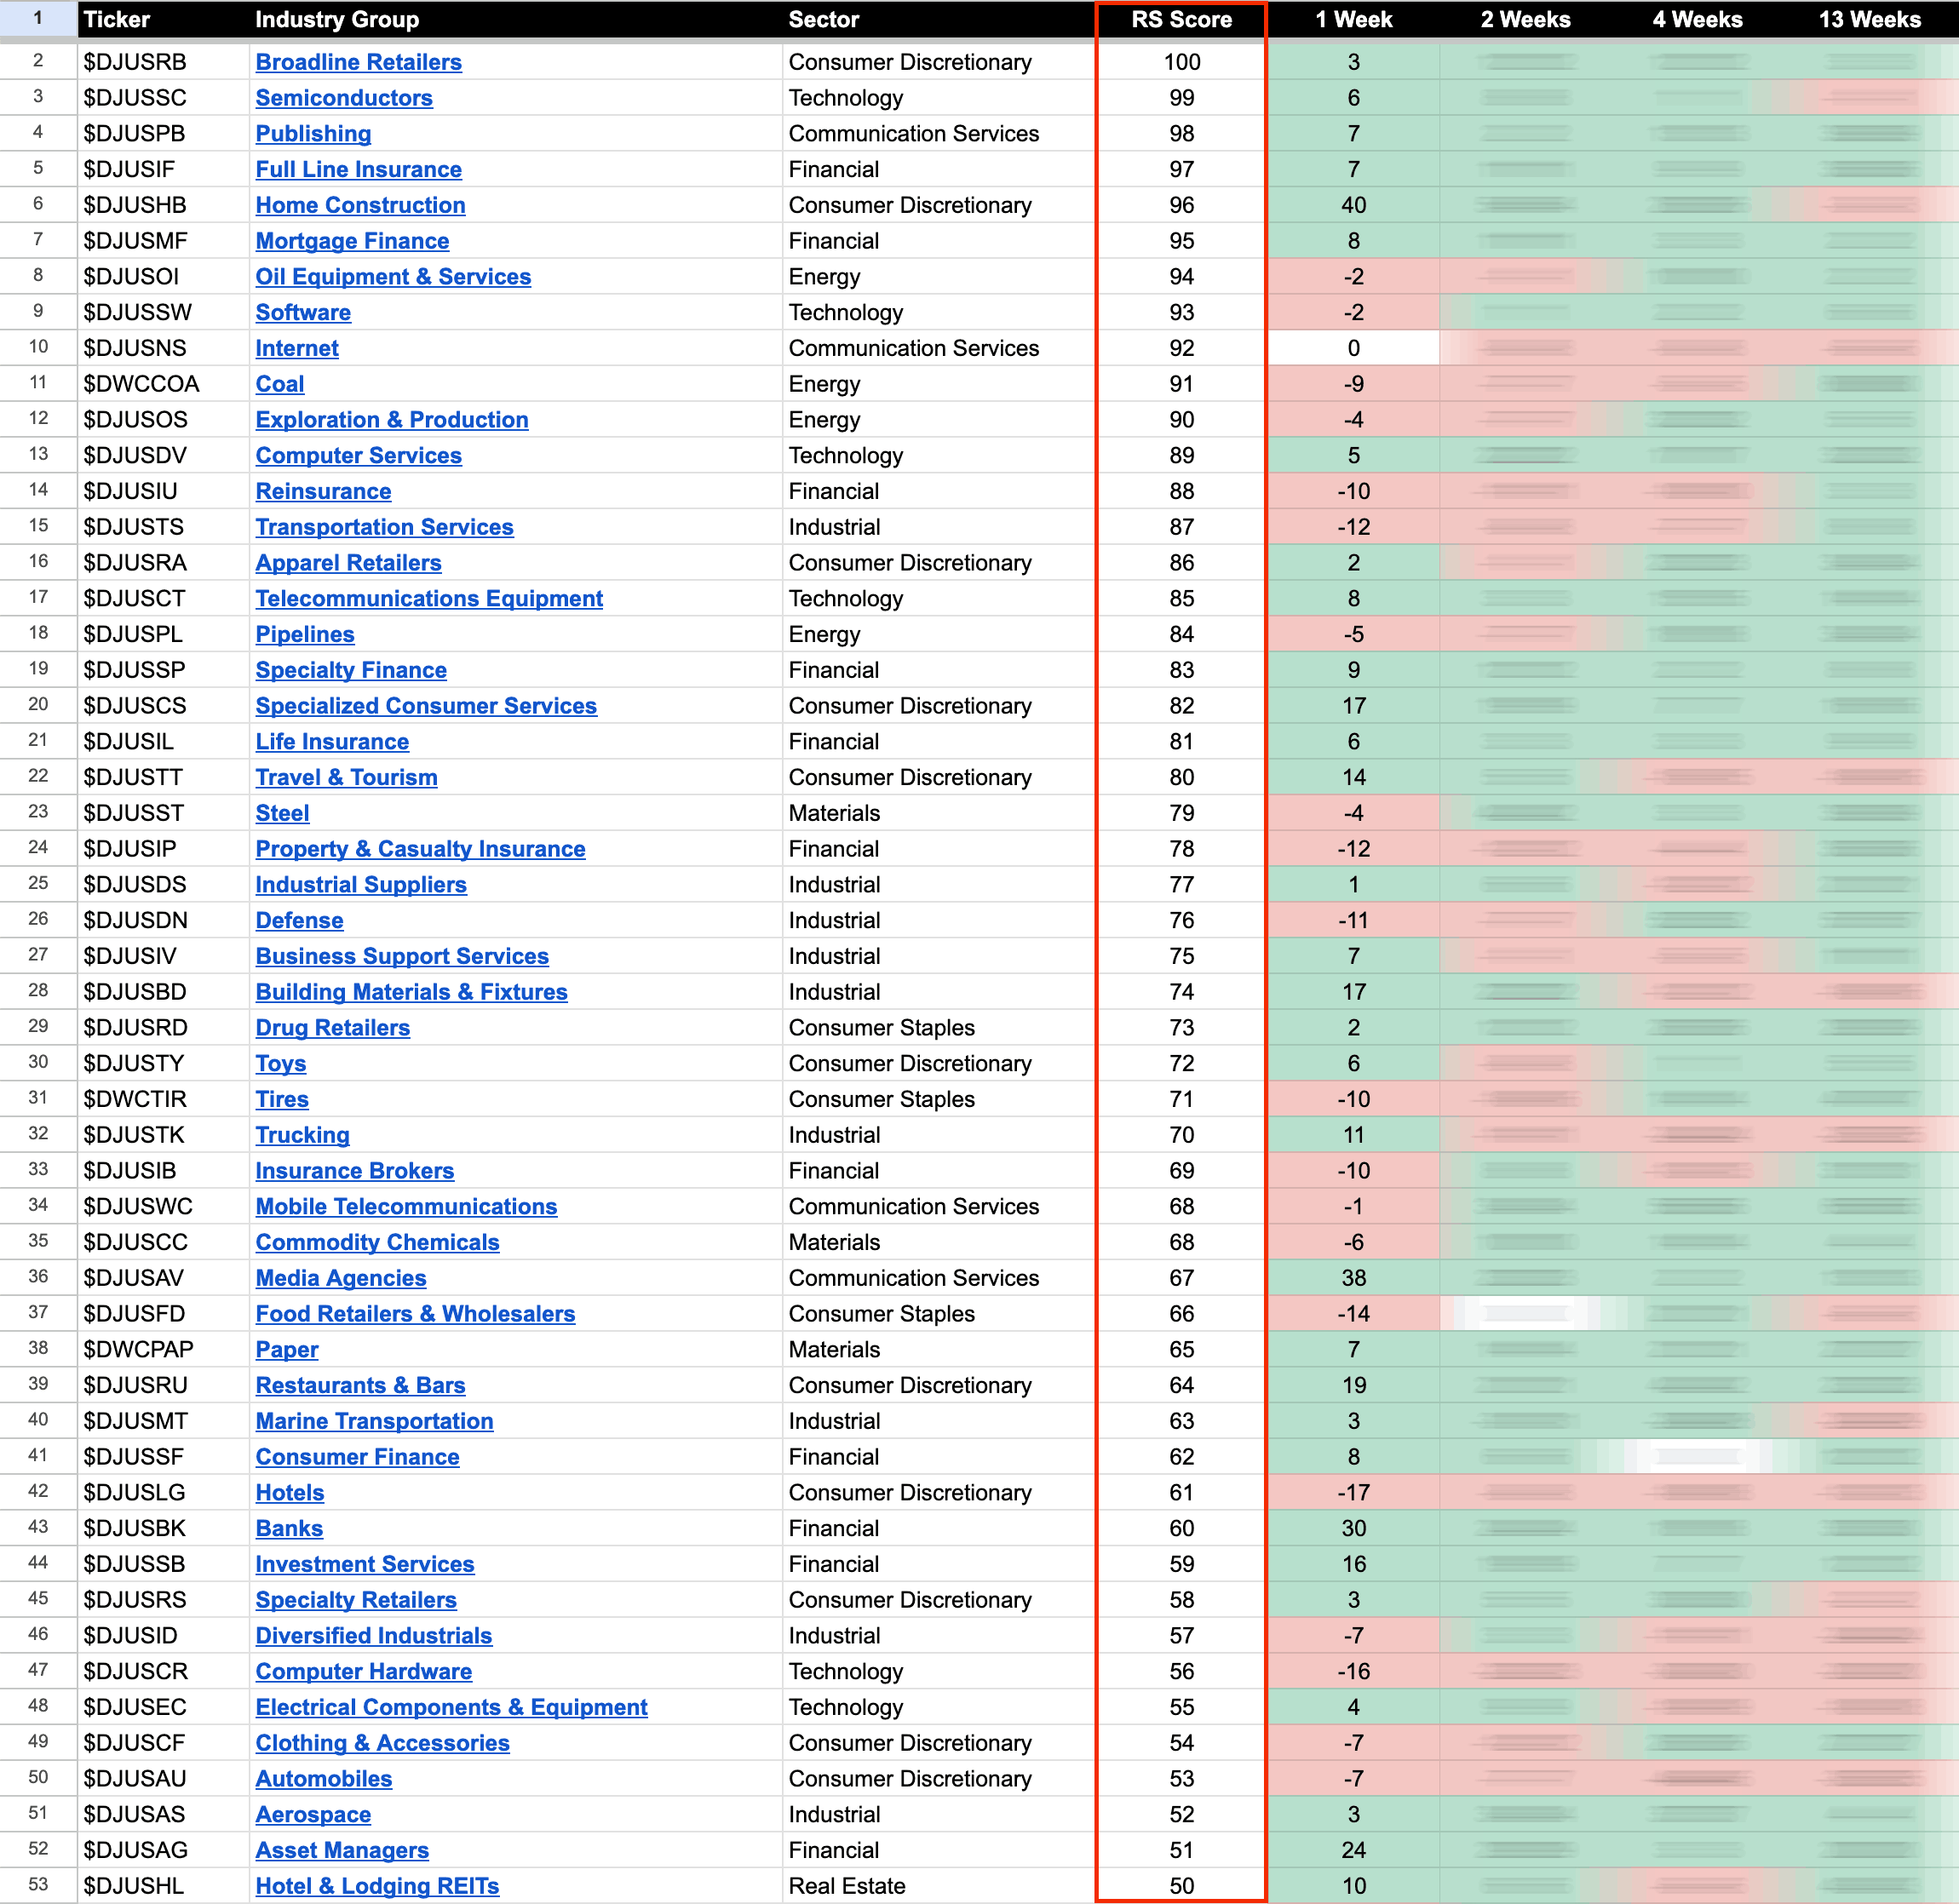
US Stocks Industry Groups Relative Strength Rankings
The purpose of the Relative Strength (RS) tables is to track the short, medium and long term RS changes of the individual groups to find the new leadership earlier than the crowd...
Read More
30 October, 2023
Stage Analysis Technical Attributes Scores – Nasdaq 100
The Stage Analysis Technical Attributes (SATA) score is our proprietary indicator that helps to identify the four stages from Stan Weinstein's Stage Analysis method, using a scoring system from 0 to 10 that rates ten of the key technical characteristics that we look for when analysing the weekly charts.
Read More
29 October, 2023
Stage Analysis Members Video – 29 October 2023 (1hr 3mins)
The Stage Analysis members weekend video begins this week with a detailed look at the market breadth data to help to determine the current weight of evidence, as it's a crucial spect of the Stage Analysis method. Followed by the regular weekend members content including the Major US Indexes, the Futures Charts, Industry Groups Relative Strength (RS) Rankings, IBD Industry Group Bell Curve – Bullish Percent, and US watchlist stocks in detail on multiple timeframes. Plus an update on Bitcoin and Ethereum.
Read More