Brief video highlighting some of the new features added this week to the Stage Analysis website for the members to use...
Read More

Blog
07 April, 2024
Stage Analysis Members Video – 7 April 2024 (59mins)
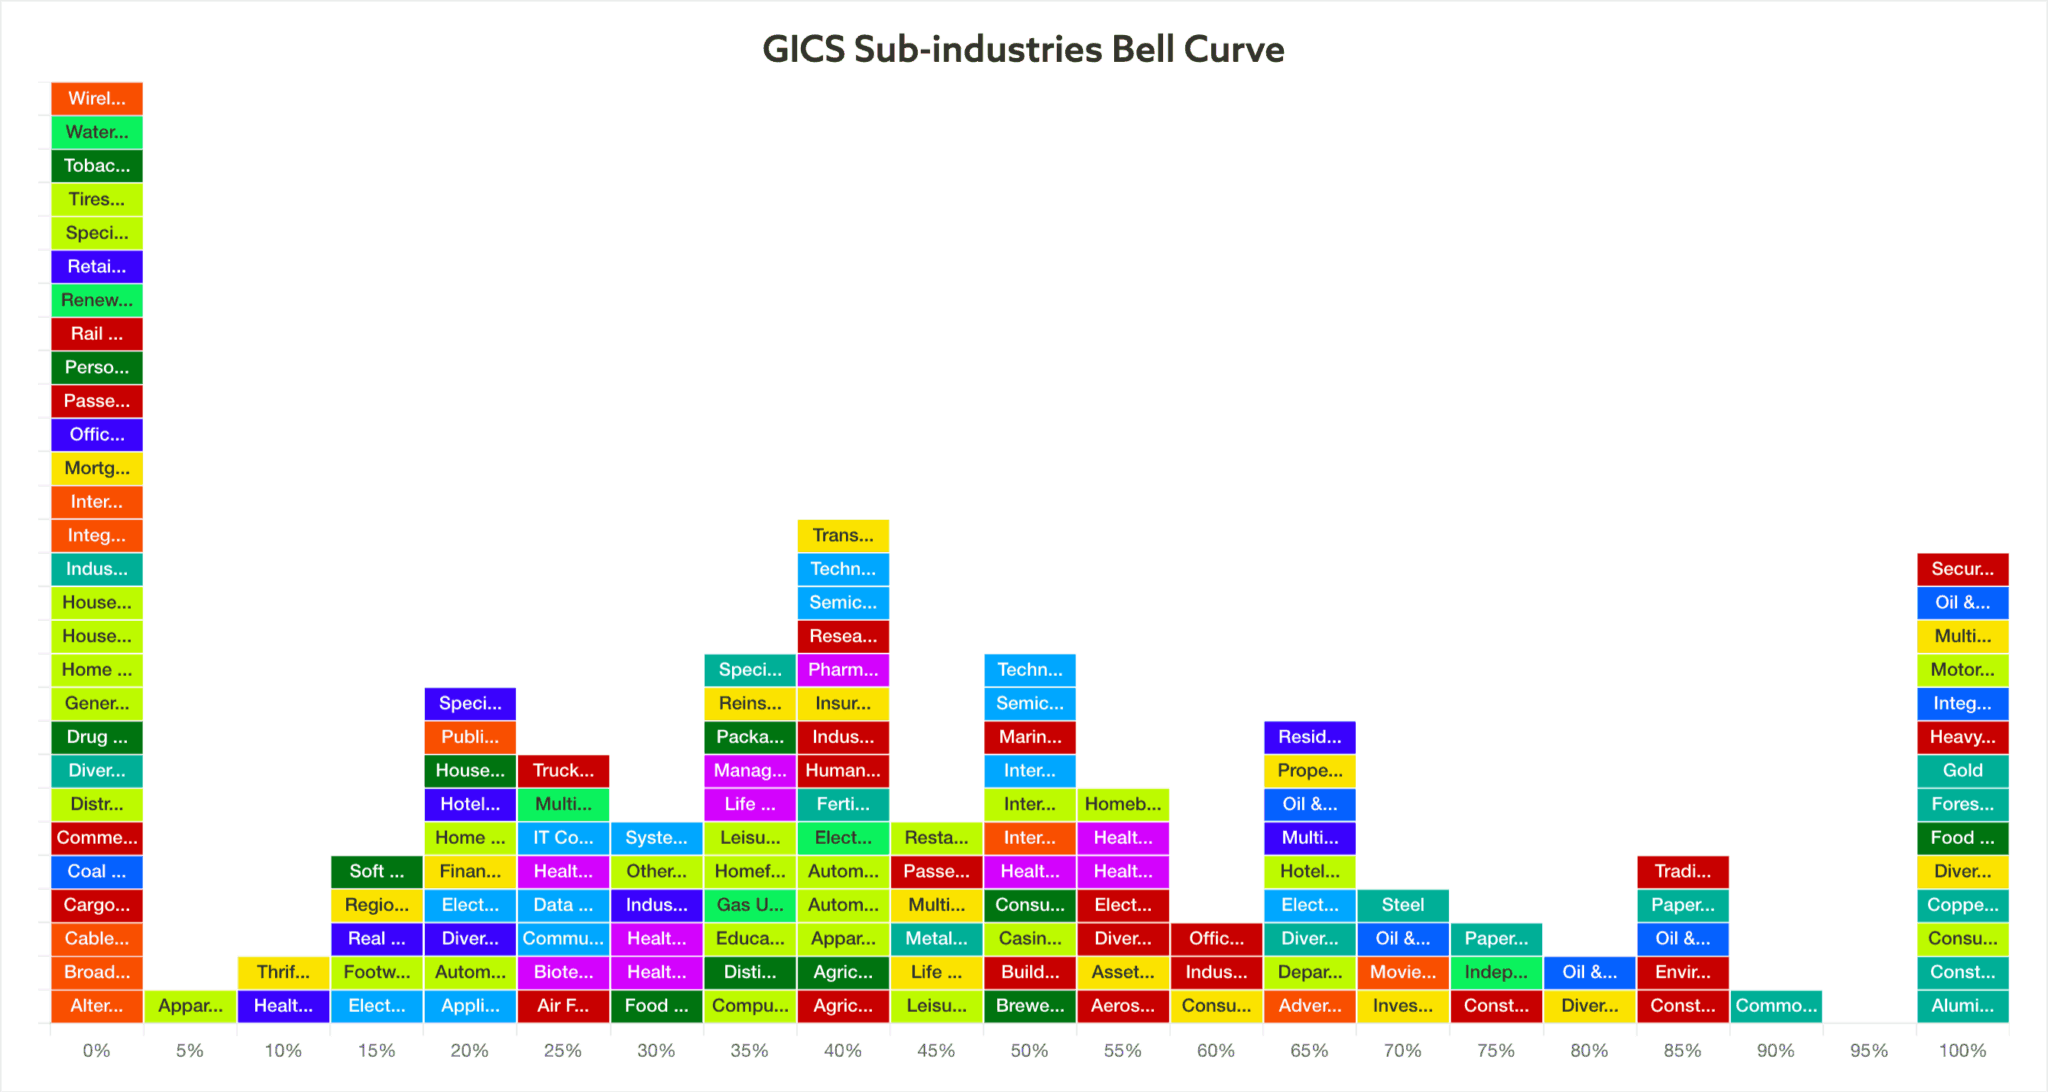
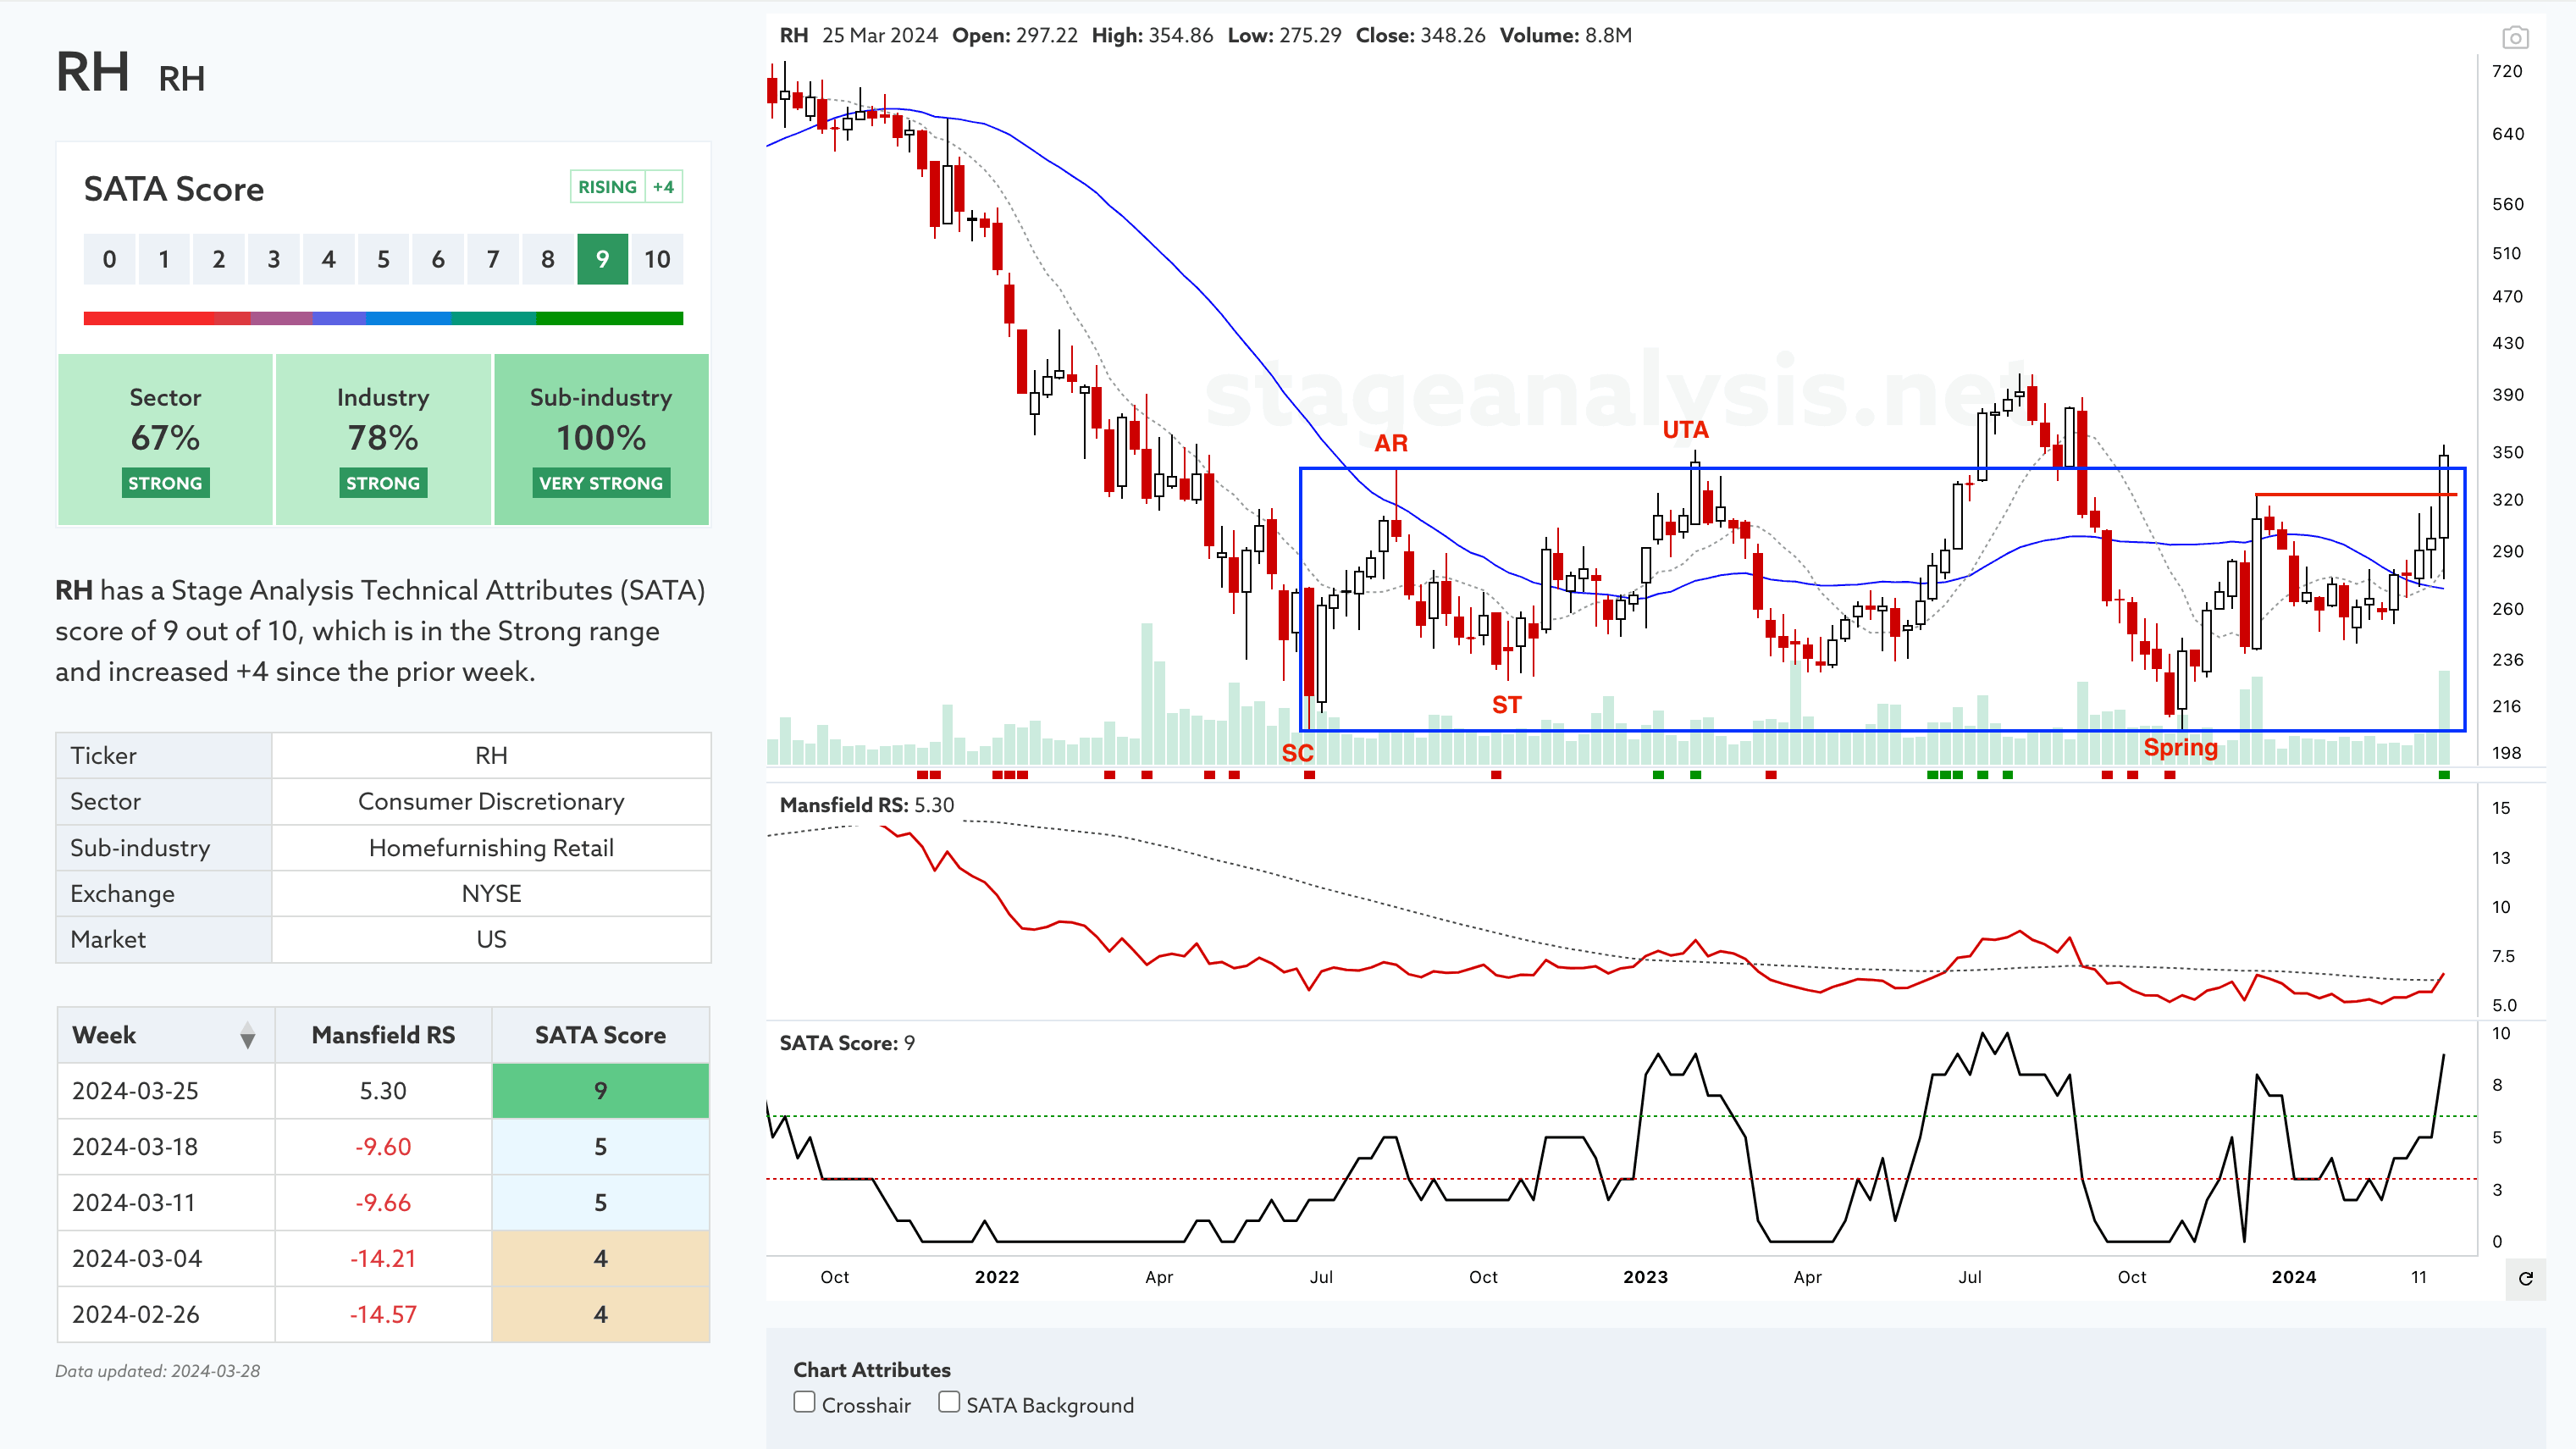
Stage Analysis members weekend video discussing the US watchlist stocks in detail on multiple timeframes, the Industry Groups Relative Strength (RS) Rankings, IBD Industry Group Bell Curve – Bullish Percent and transitioning to the new GICS Sub-industries Bell Curve data, the key Market Breadth Charts to determine the Weight of Evidence, this weeks Significant Weekly Bars moving on volume, and the Major US Stock Market Indexes, and then finishing by discussing the new features added to the Stage Analysis Technical Attributes (SATA) Tool this week, including the ETF Summary.
Read More
07 April, 2024
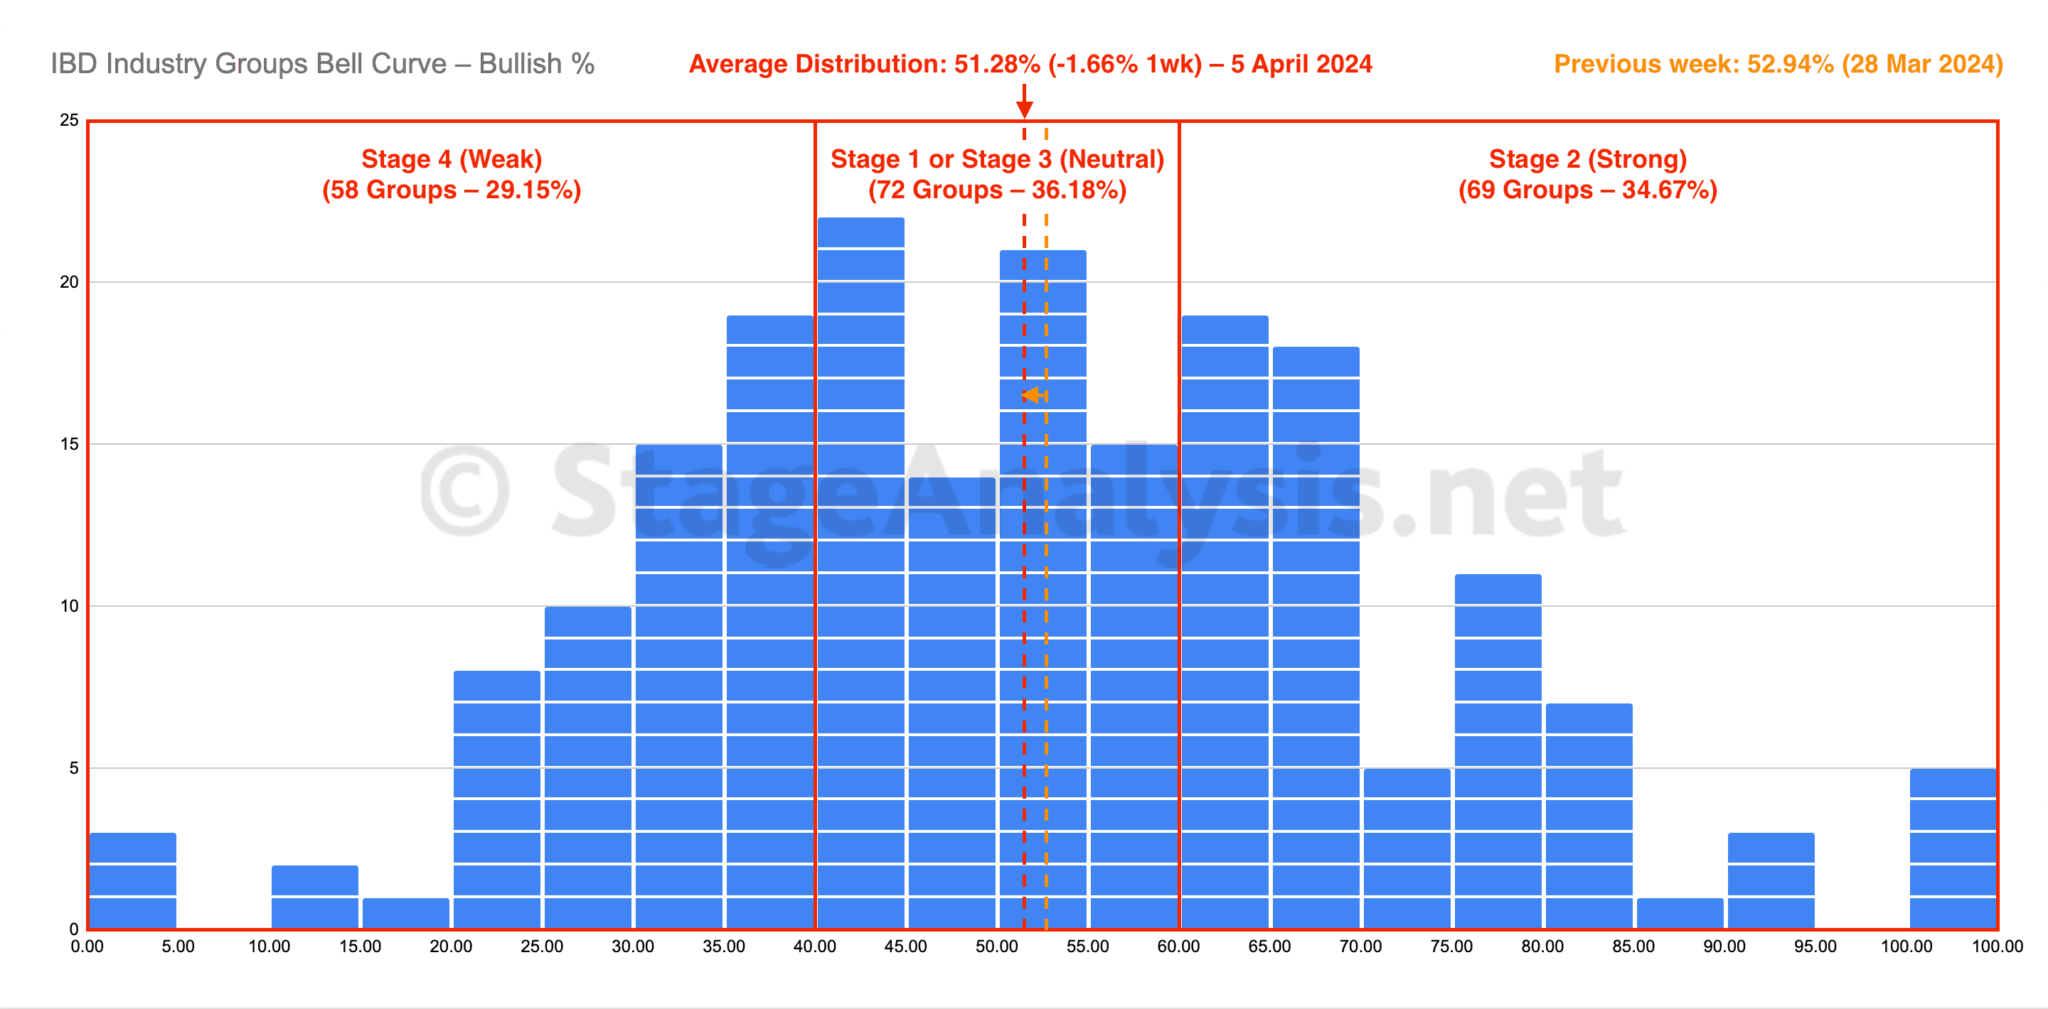
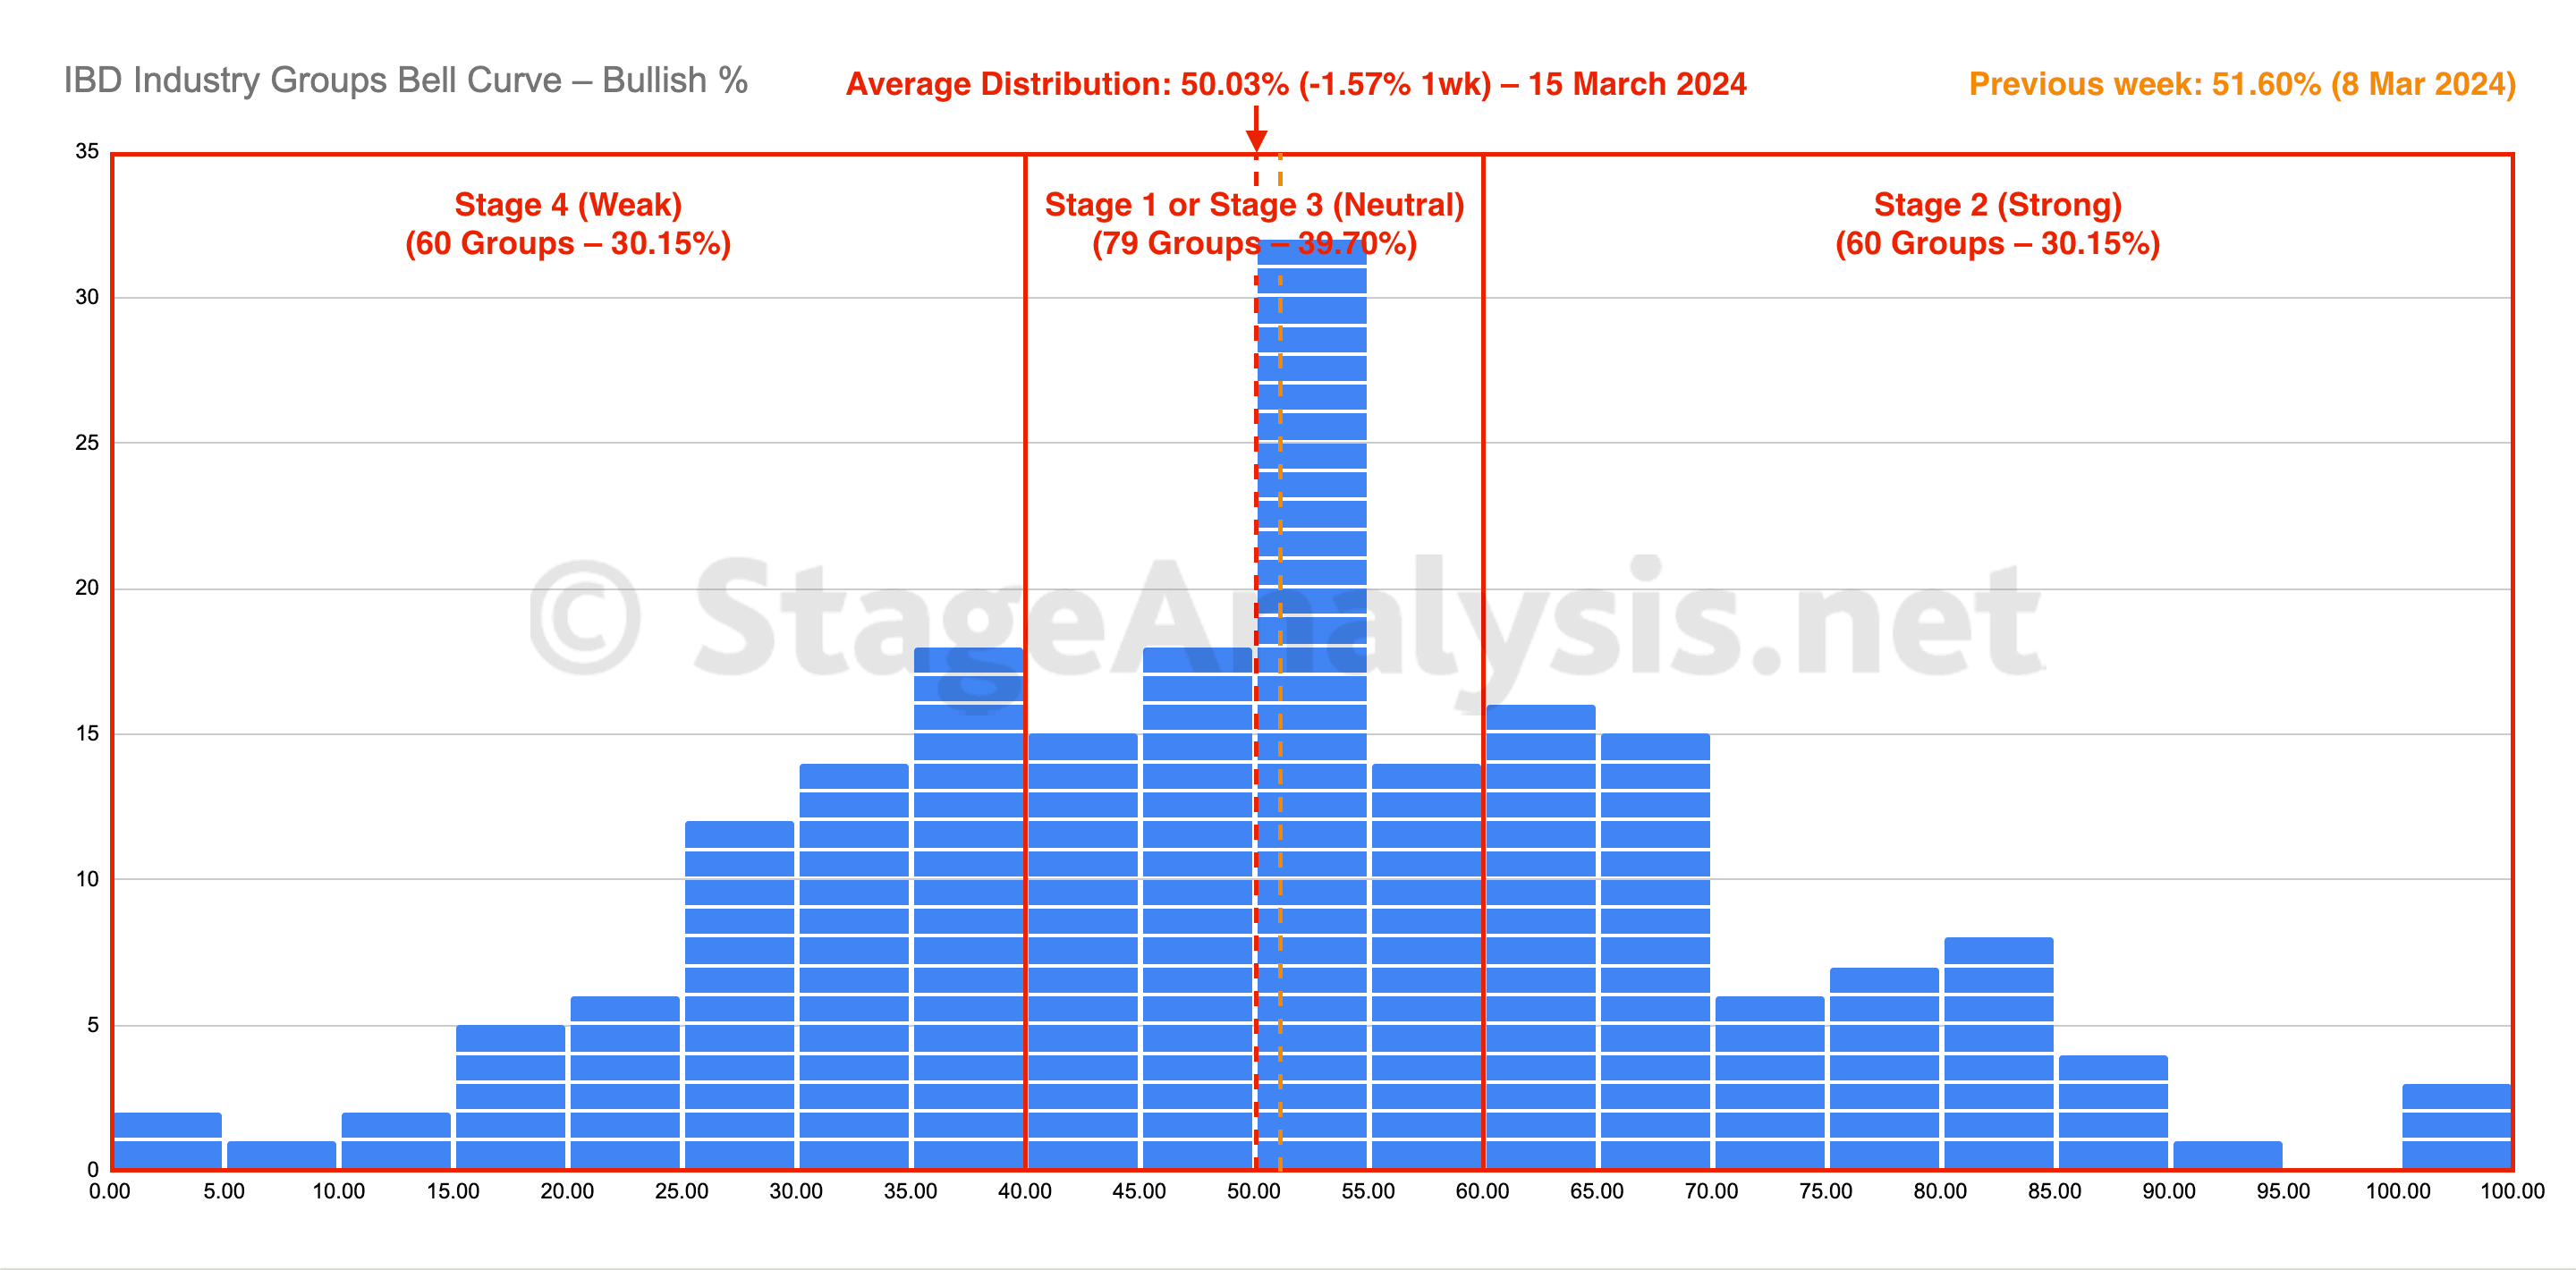
IBD Industry Groups Bell Curve – Bullish Percent
The IBD Industry Groups Bell Curve decreased by -1.66% this week to finish at 51.28% overall. The amount of groups in Stage 4 (Weak) increased by 3 (+1.5%), and the amount of groups in Stage 2 (Strong) decreased by 5 (-2.5%), while the amount groups in Stage 1 or Stage 3 (Neutral) increased by 2 (+1%).
Read More
05 April, 2024
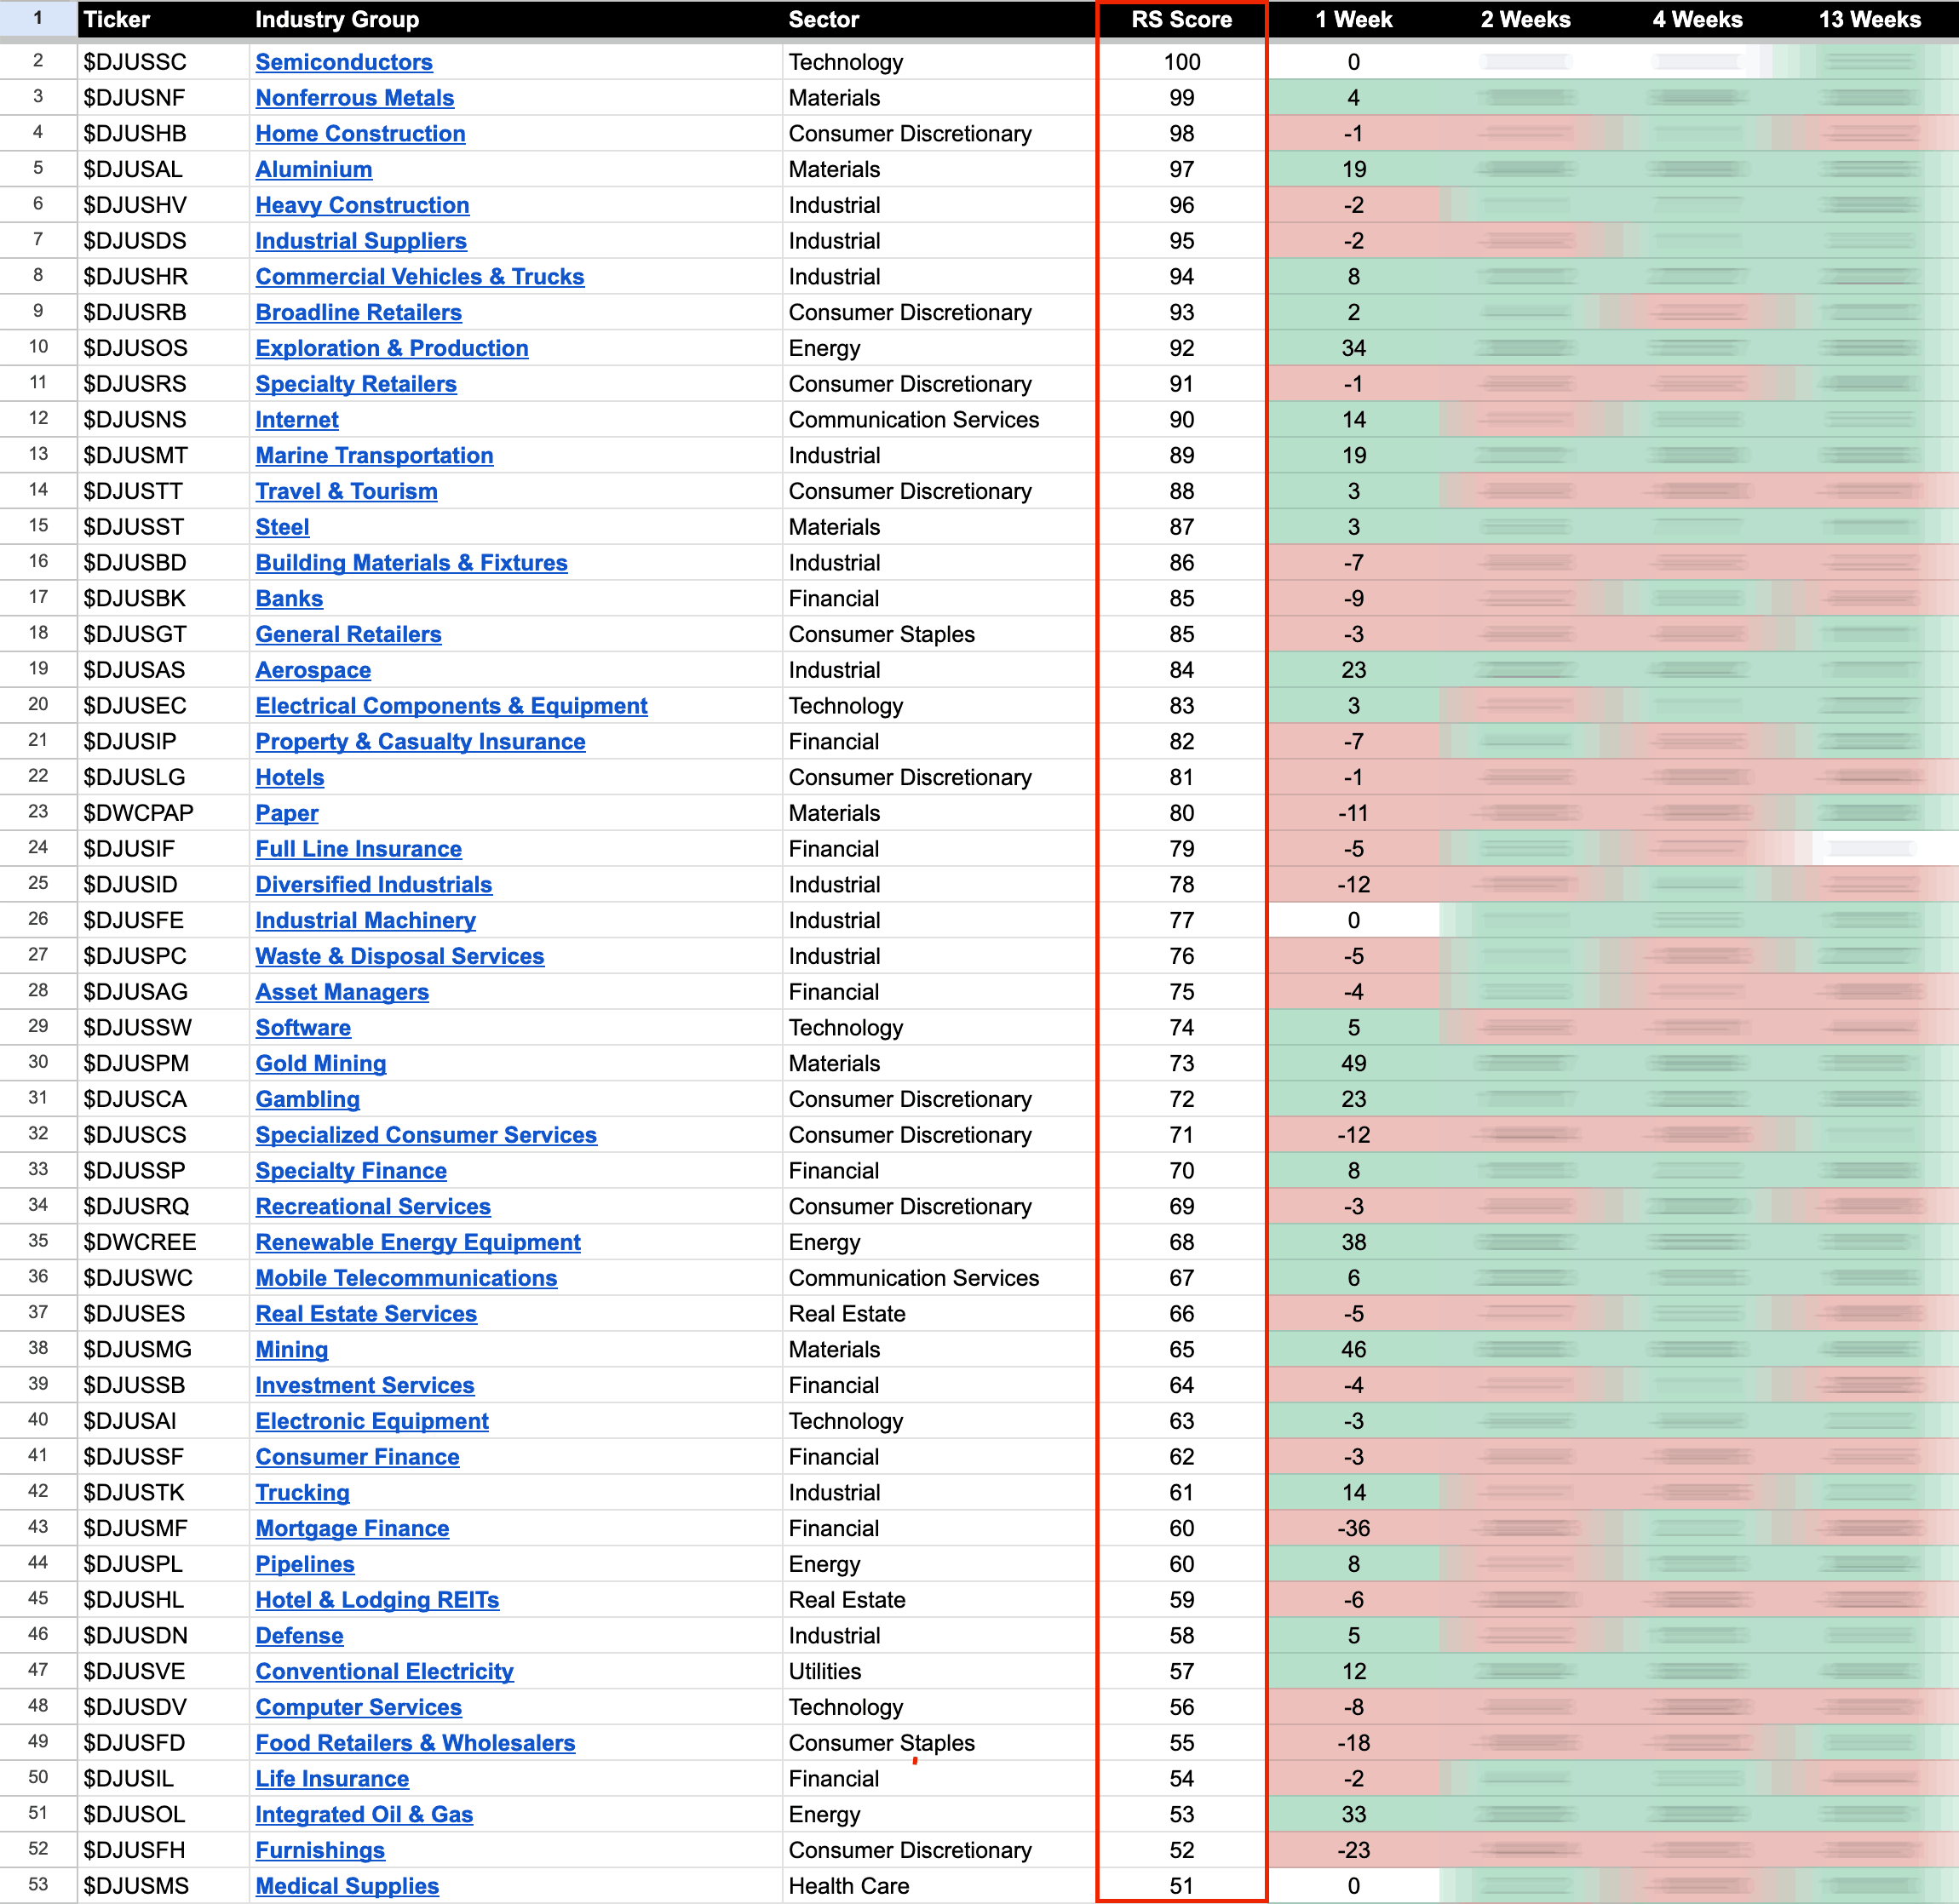
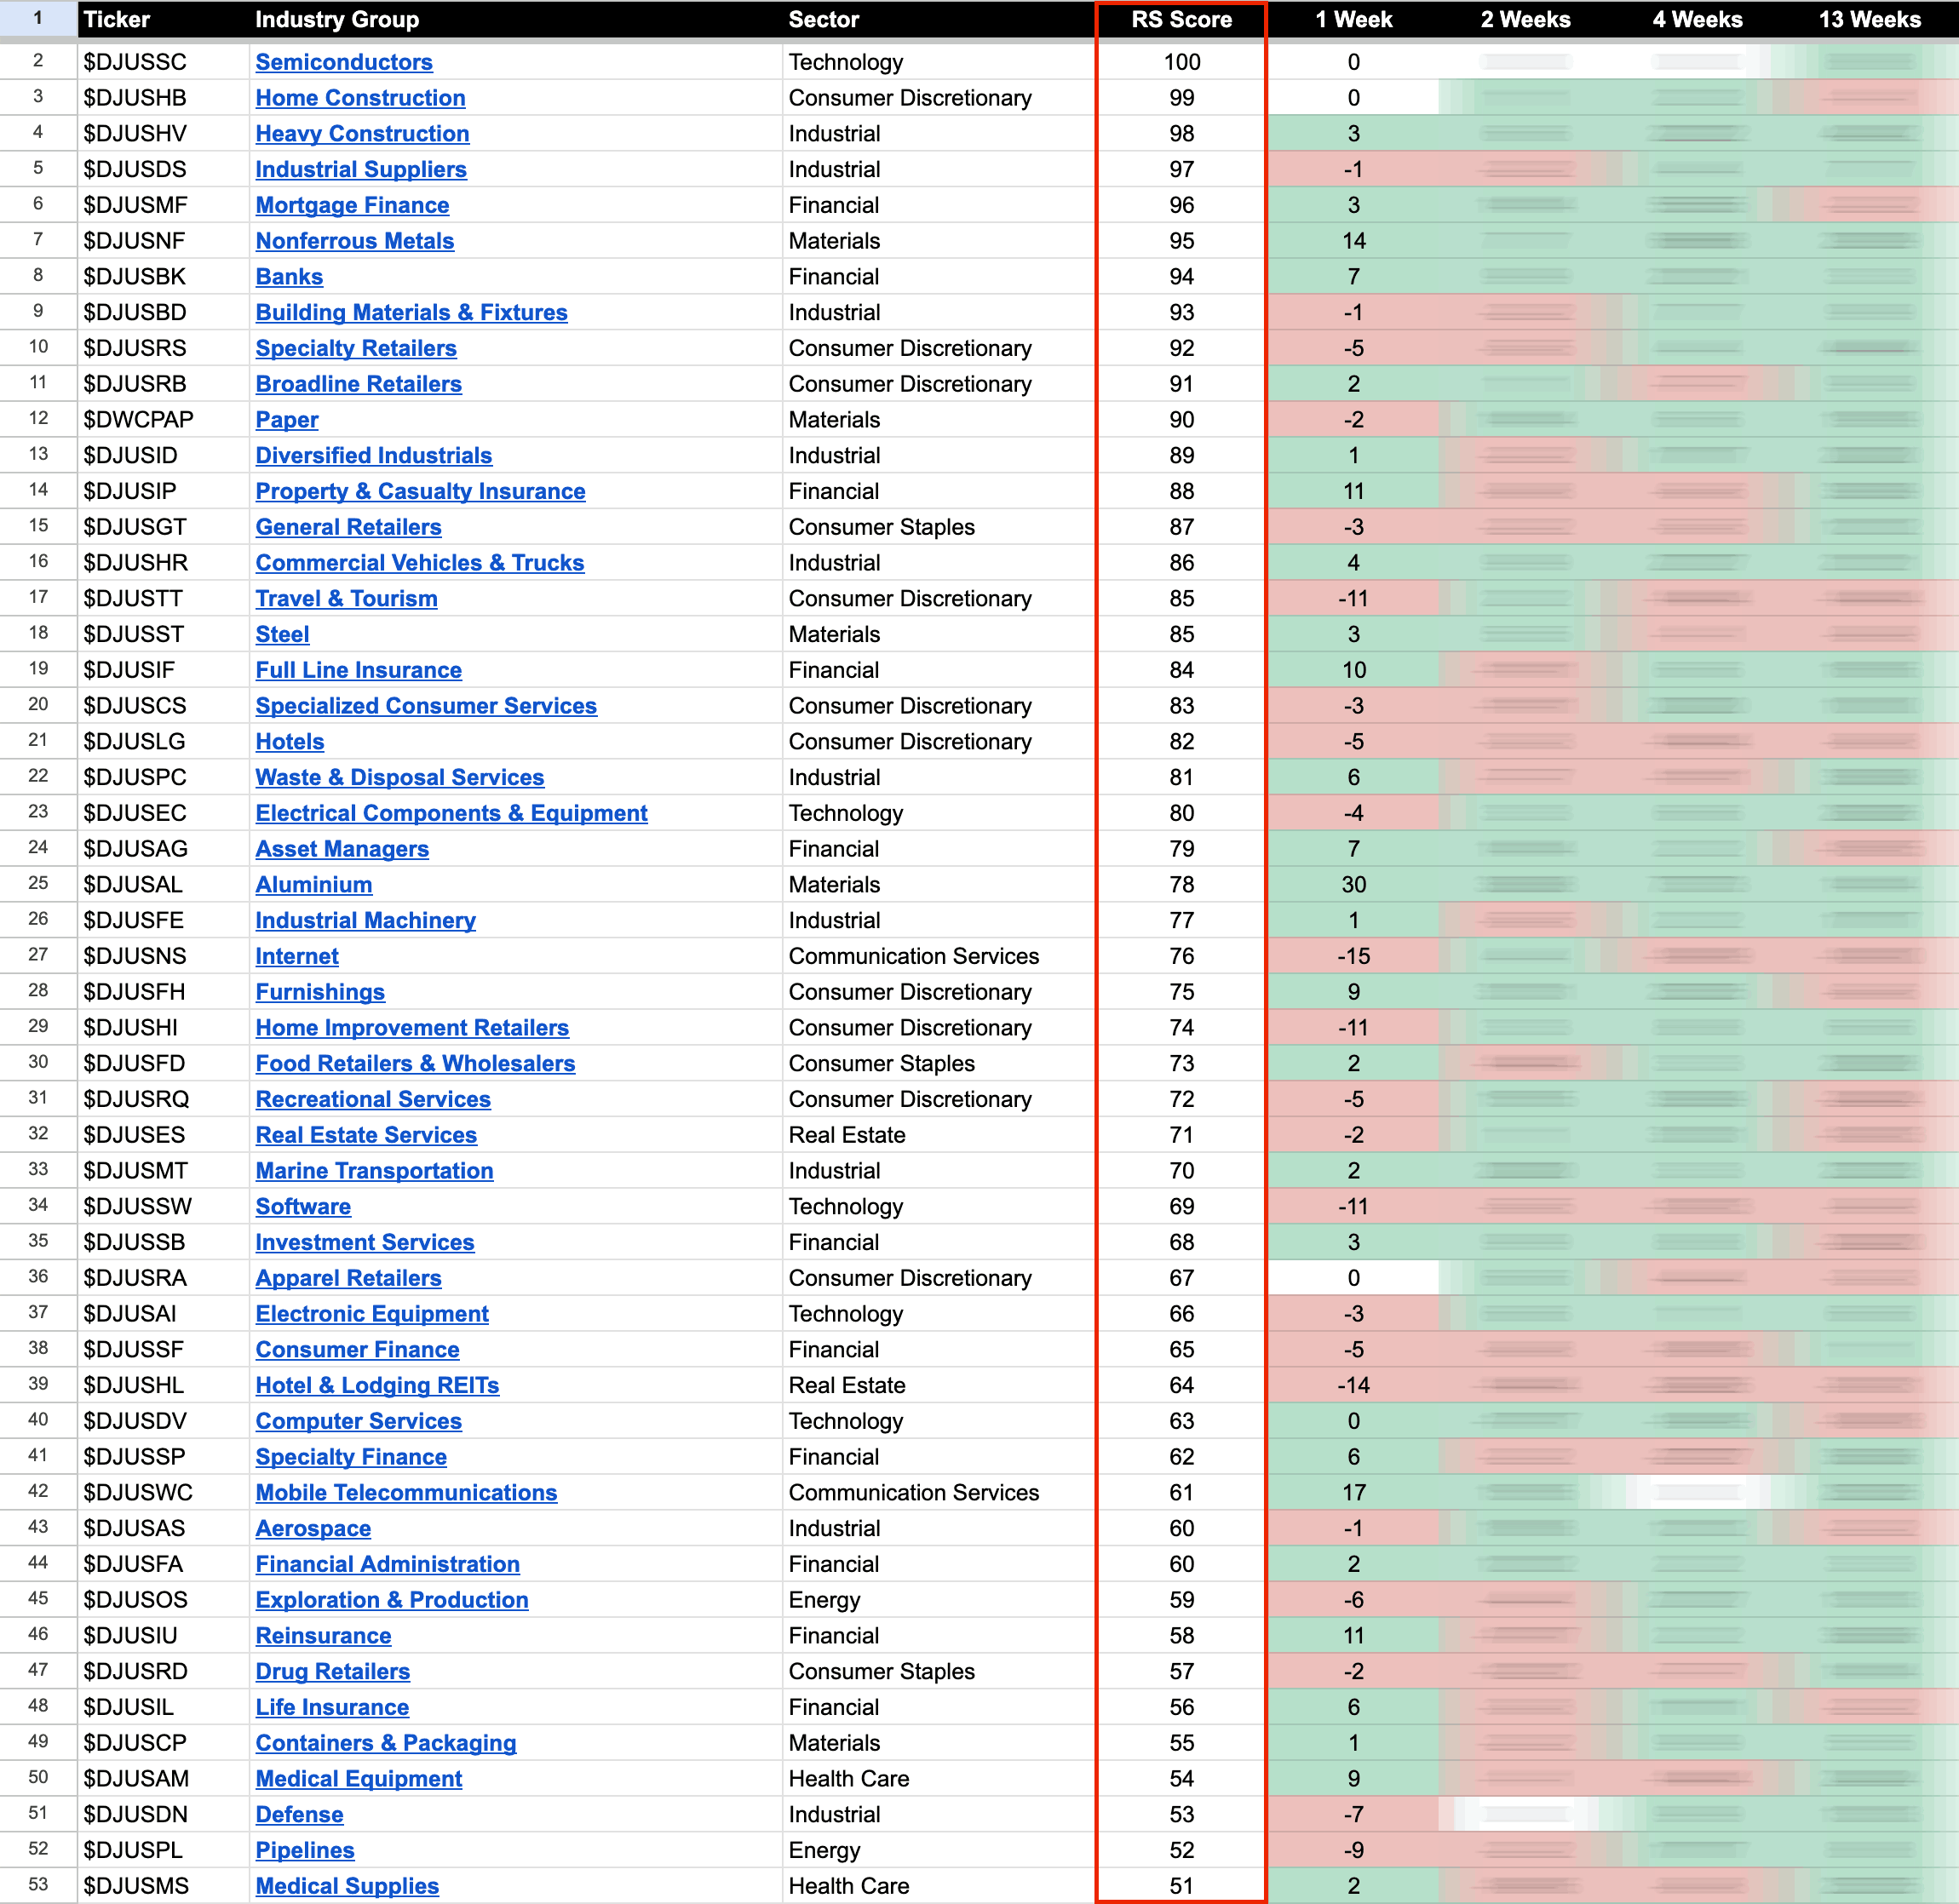
US Stocks Industry Groups Relative Strength Rankings
The purpose of the Relative Strength (RS) tables is to track the short, medium and long term RS changes of the individual groups to find the new leadership earlier than the crowd...
Read More
31 March, 2024
Stage Analysis Members Video – 31 March 2024 (1hr 6mins)
Stage Analysis members weekend video starting with this weeks Significant Weekly Bars moving on volume, then a further look at new Stage Analysis Technical Attributes (SATA) tool, new features and how to use it, followed by the US watchlist stocks in detail on multiple timeframes, the Industry Groups Relative Strength (RS) Rankings, IBD Industry Group Bell Curve – Bullish Percent, the key Market Breadth Charts to determine the Weight of Evidence and the Major US Stock Market Indexes.
Read More
30 March, 2024
IBD Industry Groups Bell Curve – Bullish Percent
The IBD Industry Groups Bell Curve – Bullish Percent shows the few hundred industry groups plotted as a histogram chart and represents the percentage of stocks in each group that are on a point & figure (P&F) buy signal...
Read More
29 March, 2024
US Stocks Industry Groups Relative Strength Rankings
The purpose of the Relative Strength (RS) tables is to track the short, medium and long term RS changes of the individual groups to find the new leadership earlier than the crowd...
Read More
27 March, 2024
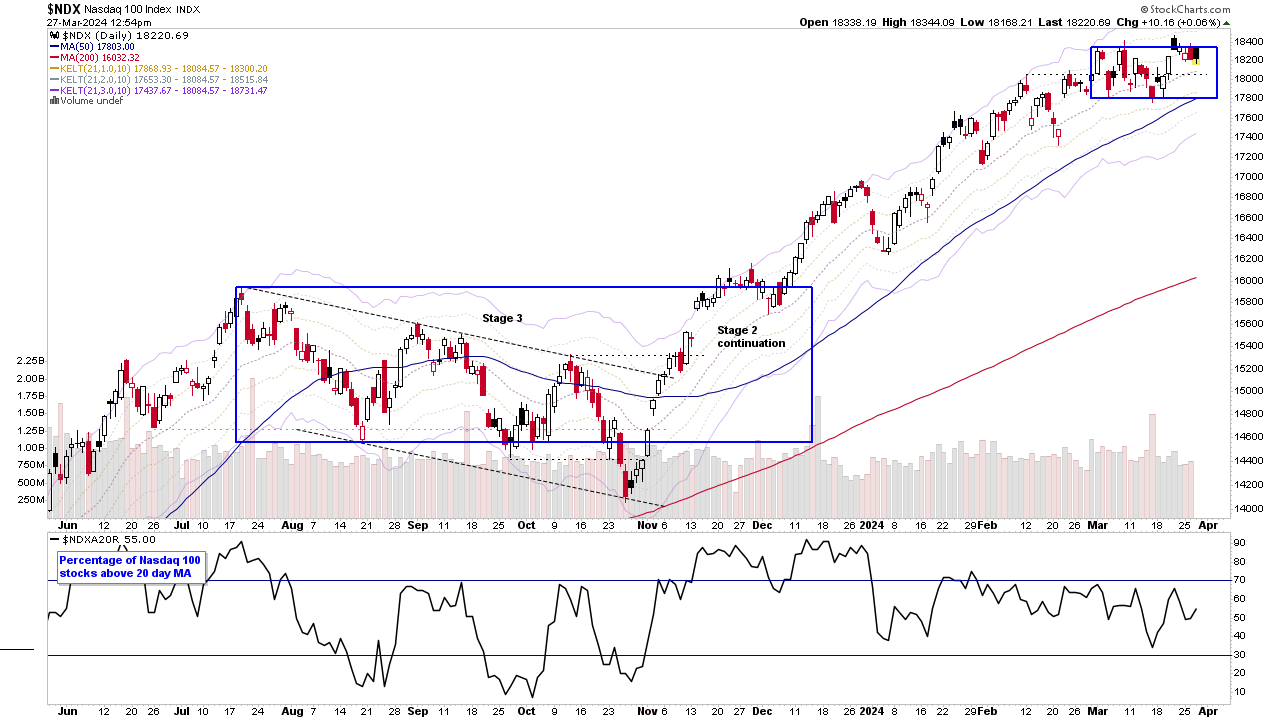
Video: New Features - Automated Industry Groups Bell Curve and Sector Breadth Charts - 27 March 2024
Brief video discussing more of the new features in development as well as a quick run through of the current market indexes and short-term breadth charts.
Read More
24 March, 2024
Stage Analysis Members Video – 24 March 2024 (56 mins)
Stage Analysis members weekend video starting with discussion of the US watchlist stocks in detail on multiple timeframes, then some of the weeks Significant Weekly Bars moving on volume, and a continued look at new Stage Analysis Technical Attributes (SATA) tool and how to use it, the Industry Groups Relative Strength (RS) Rankings, IBD Industry Group Bell Curve – Bullish Percent, the key Market Breadth Charts to determine the Weight of Evidence and the Major US Stock Market Indexes, and then finishing this week with analysis of the Bitcoin and Ethereum charts.
Read More
23 March, 2024
IBD Industry Groups Bell Curve – Bullish Percent
The IBD Industry Groups Bell Curve – Bullish Percent shows the few hundred industry groups plotted as a histogram chart and represents the percentage of stocks in each group that are on a point & figure (P&F) buy signal...
Read More