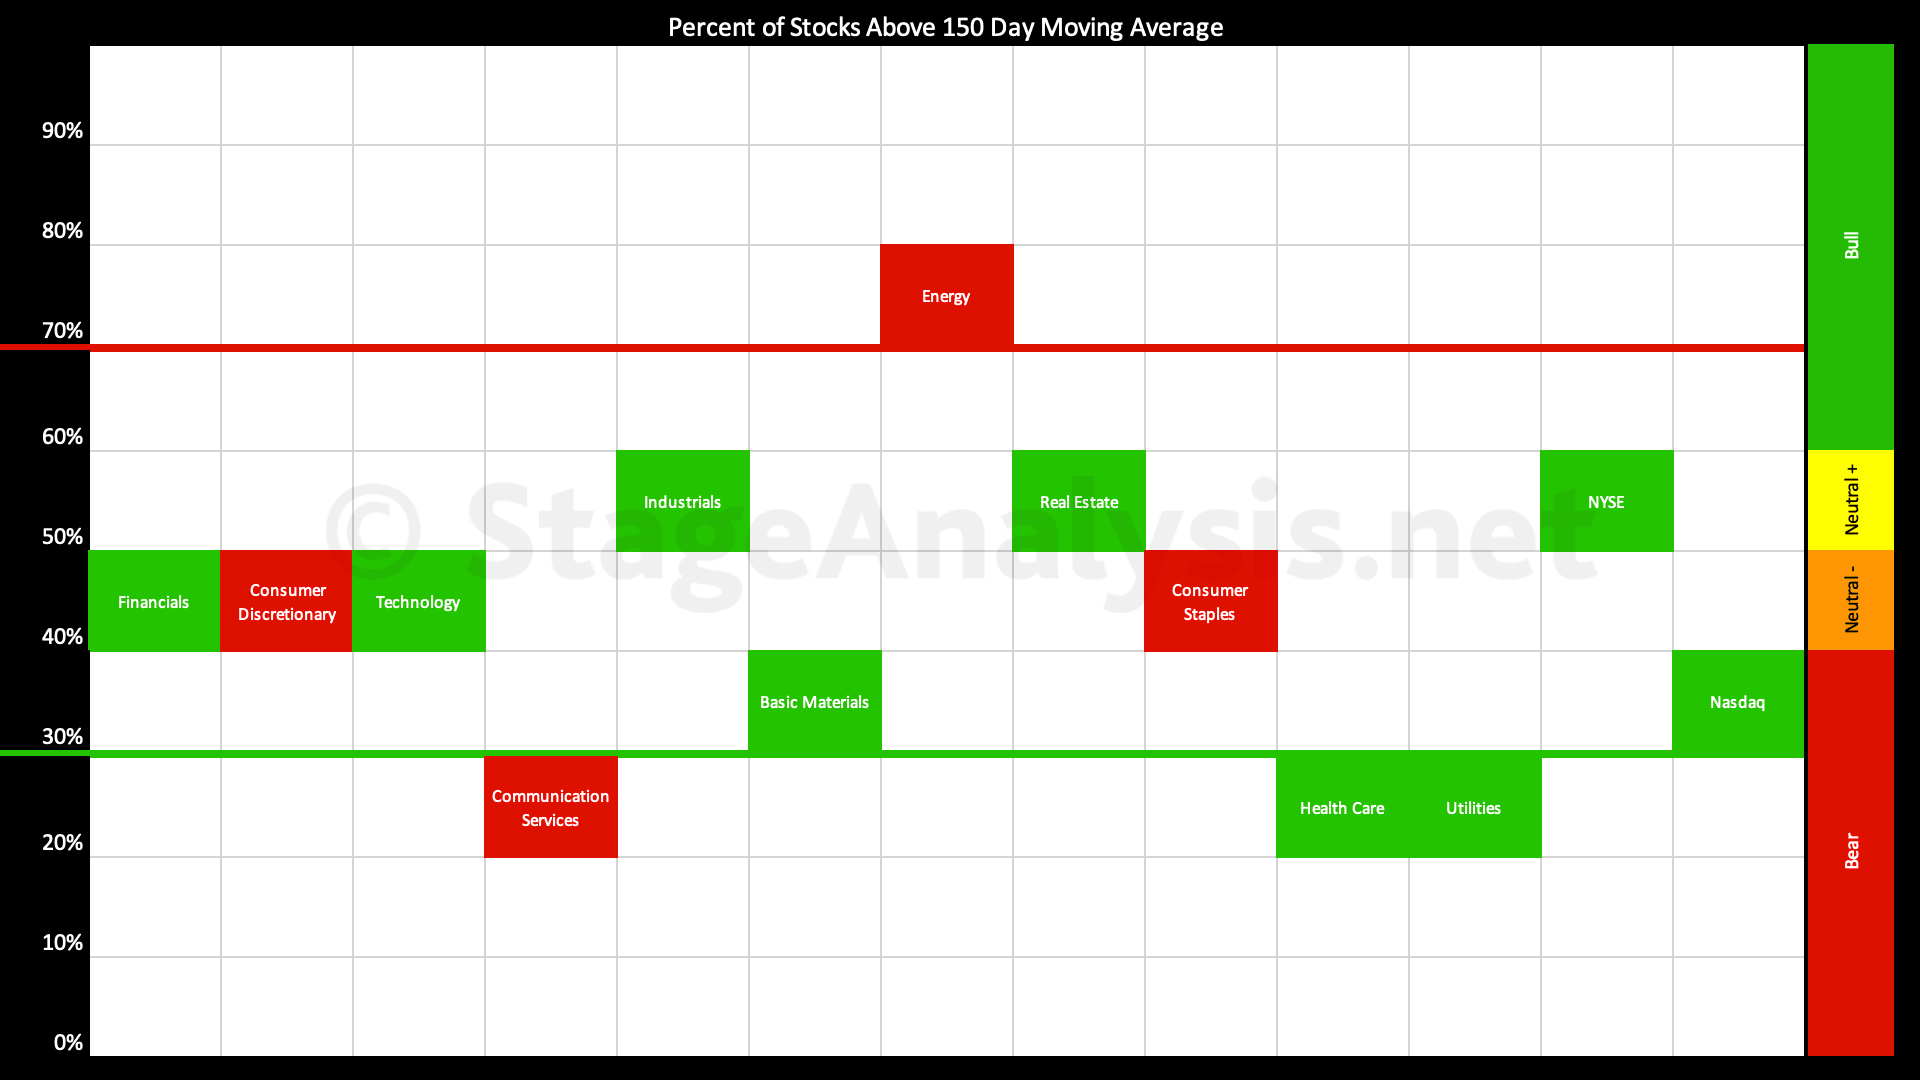
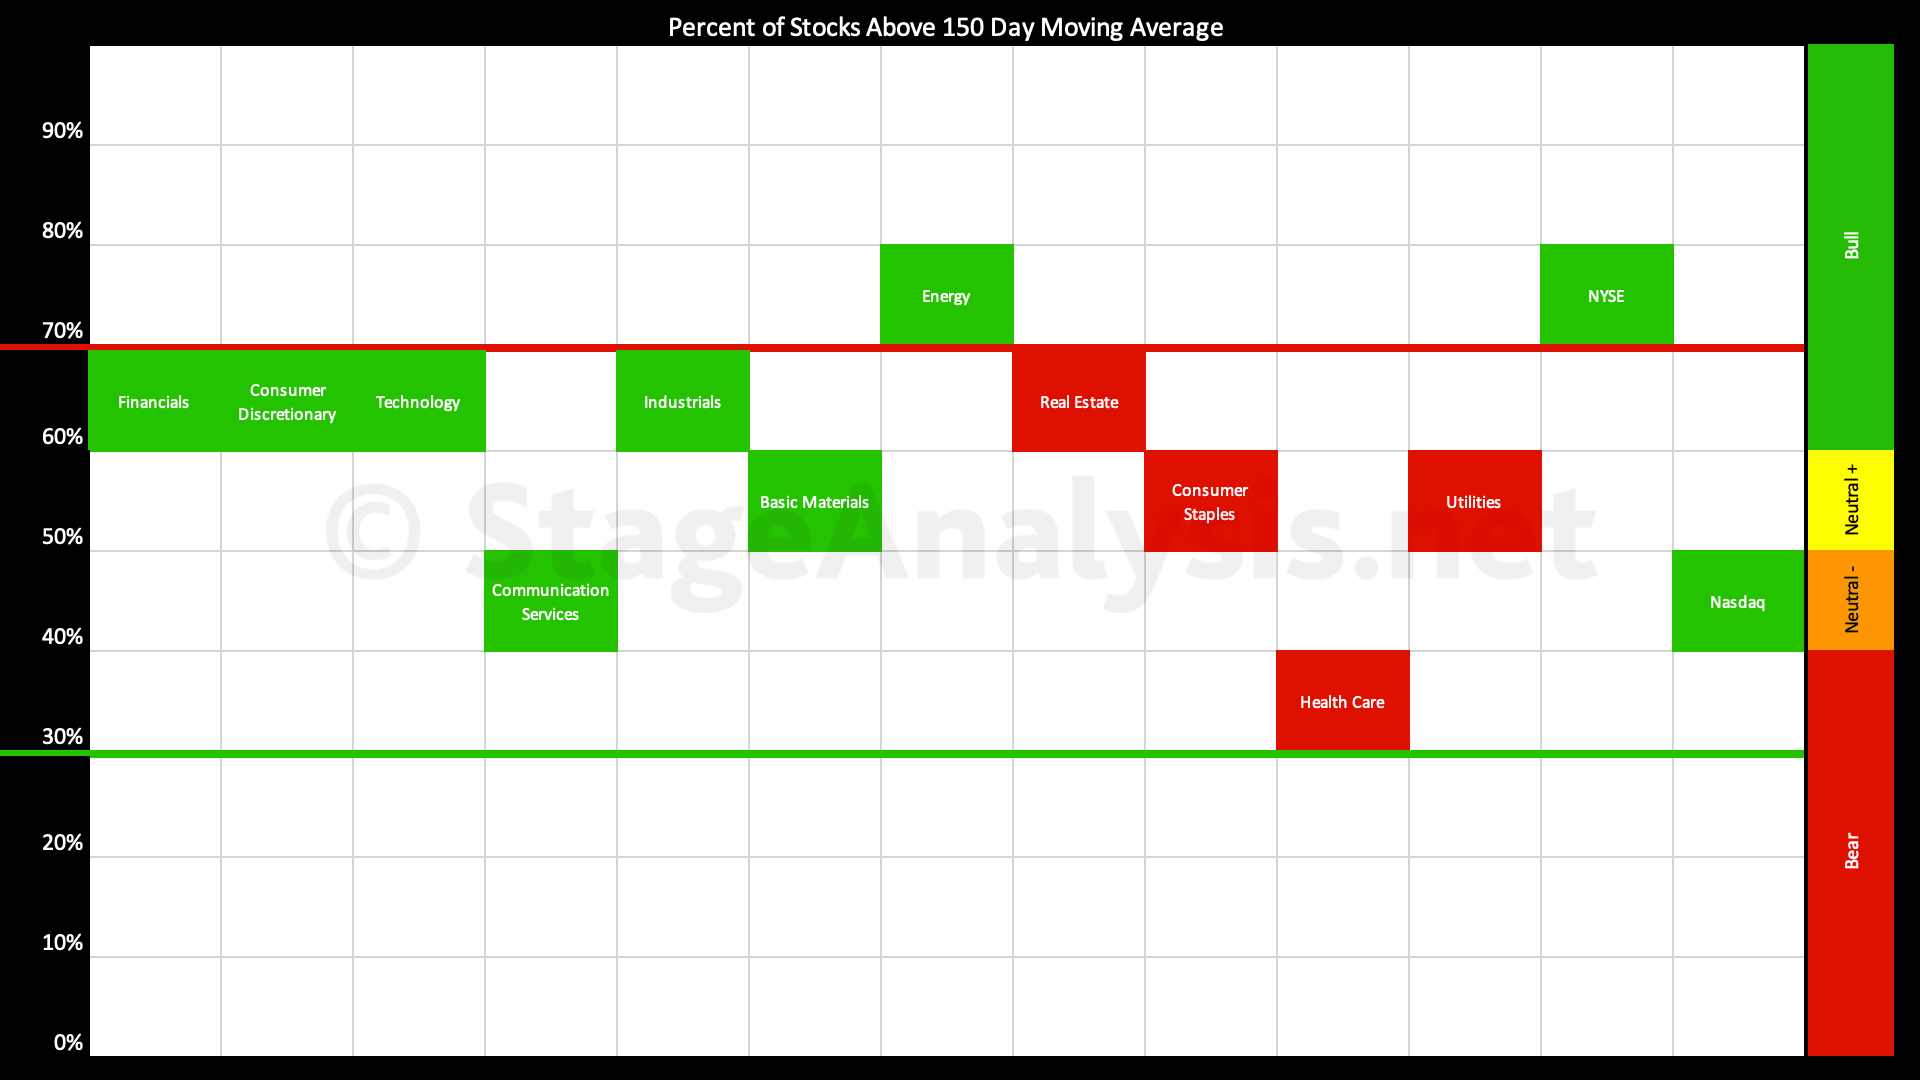
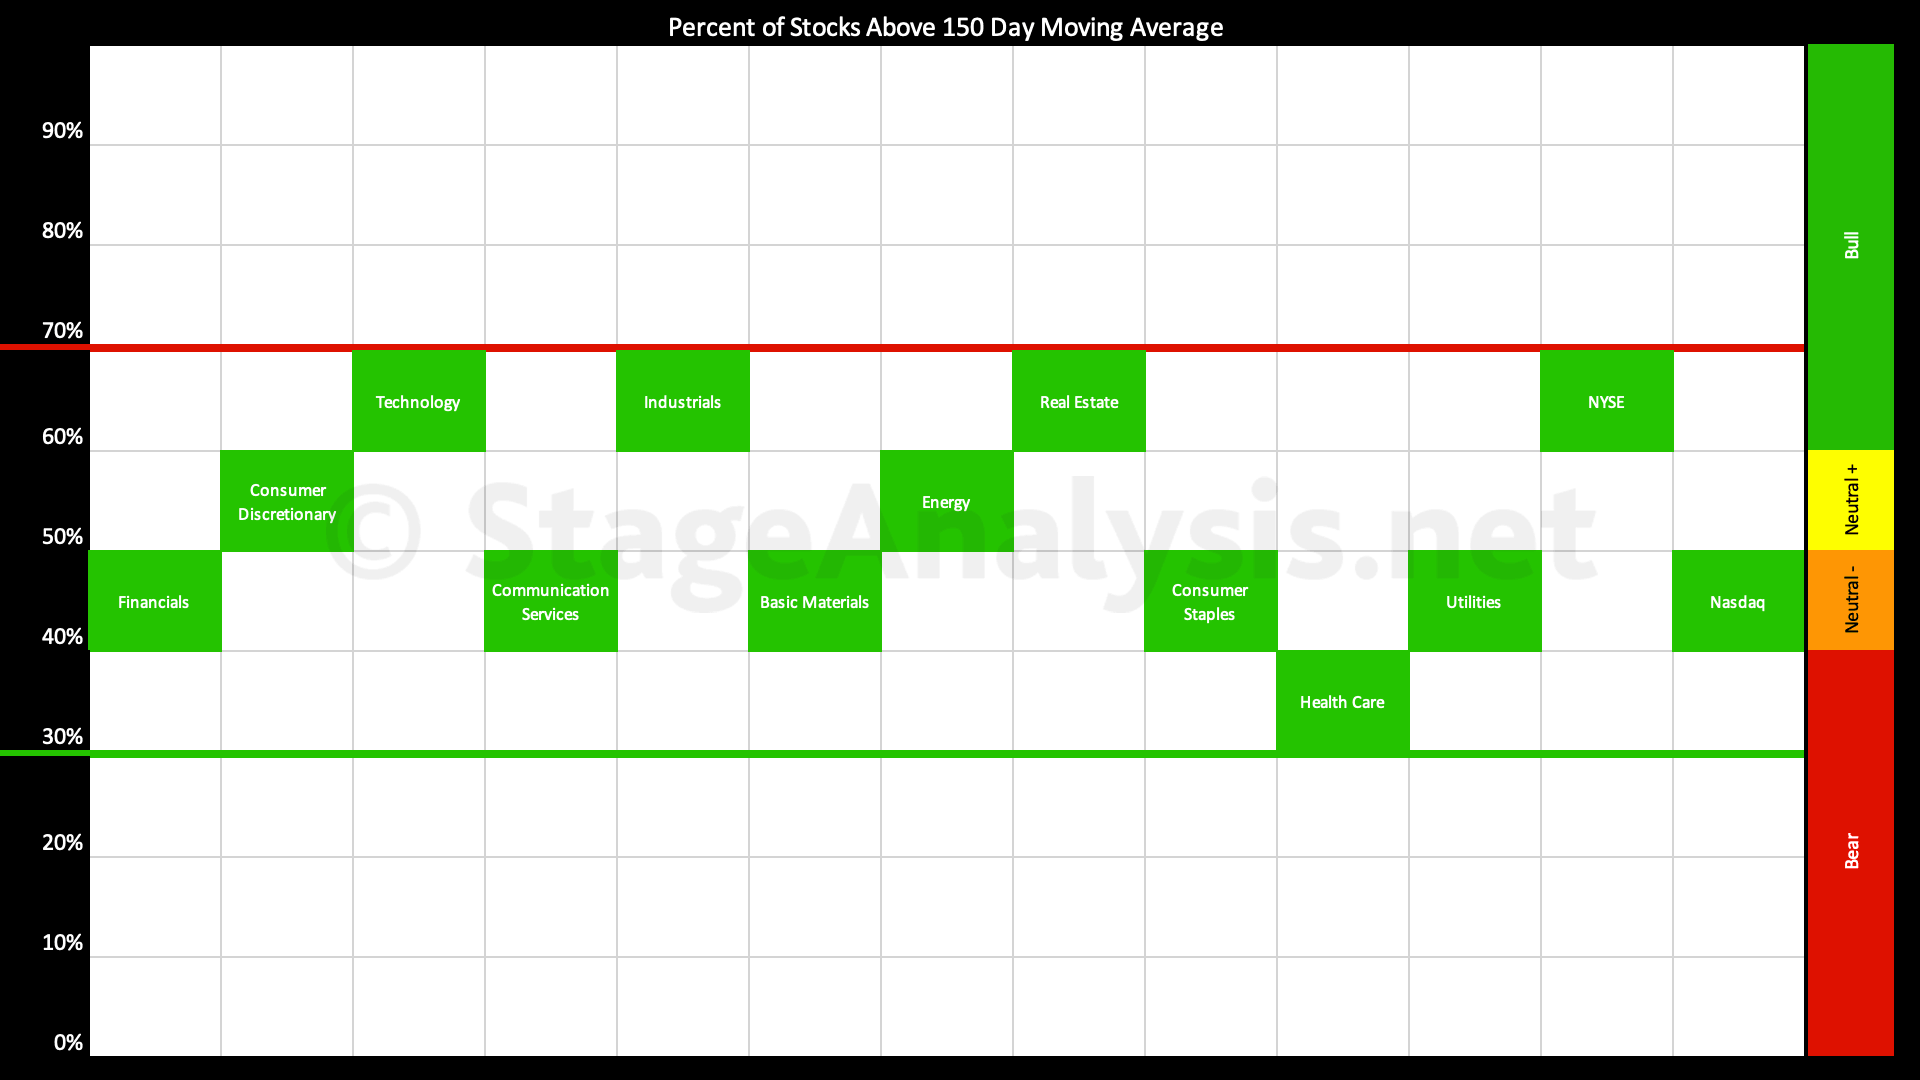
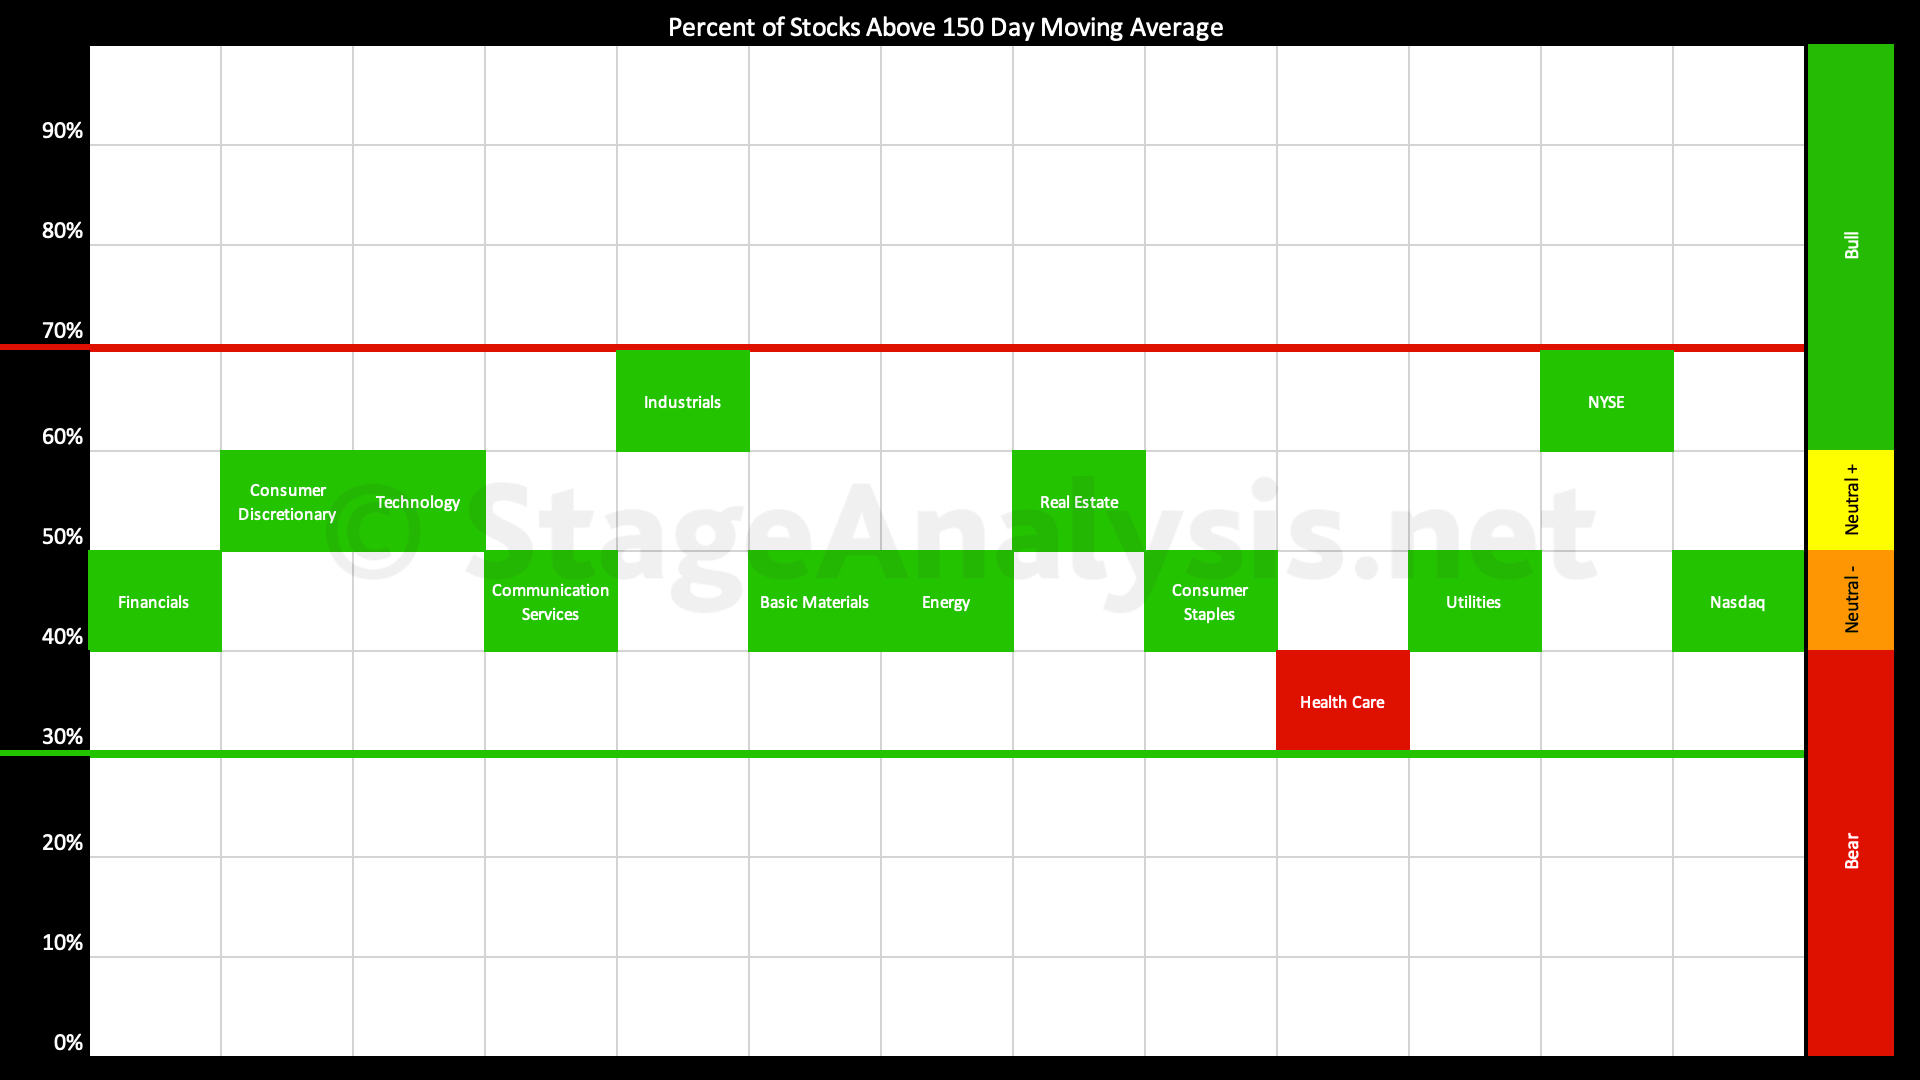
The Percentage of US Stocks Above Their 150 day Moving Averages in the 11 major sectors continued lower by -4.31% over the last few weeks since the previous post on the 14th August 2023, moving the overall average down to 43.11%, which is still the Neutral- zone in the lower middle of the field...
Read More
Blog
22 August, 2023
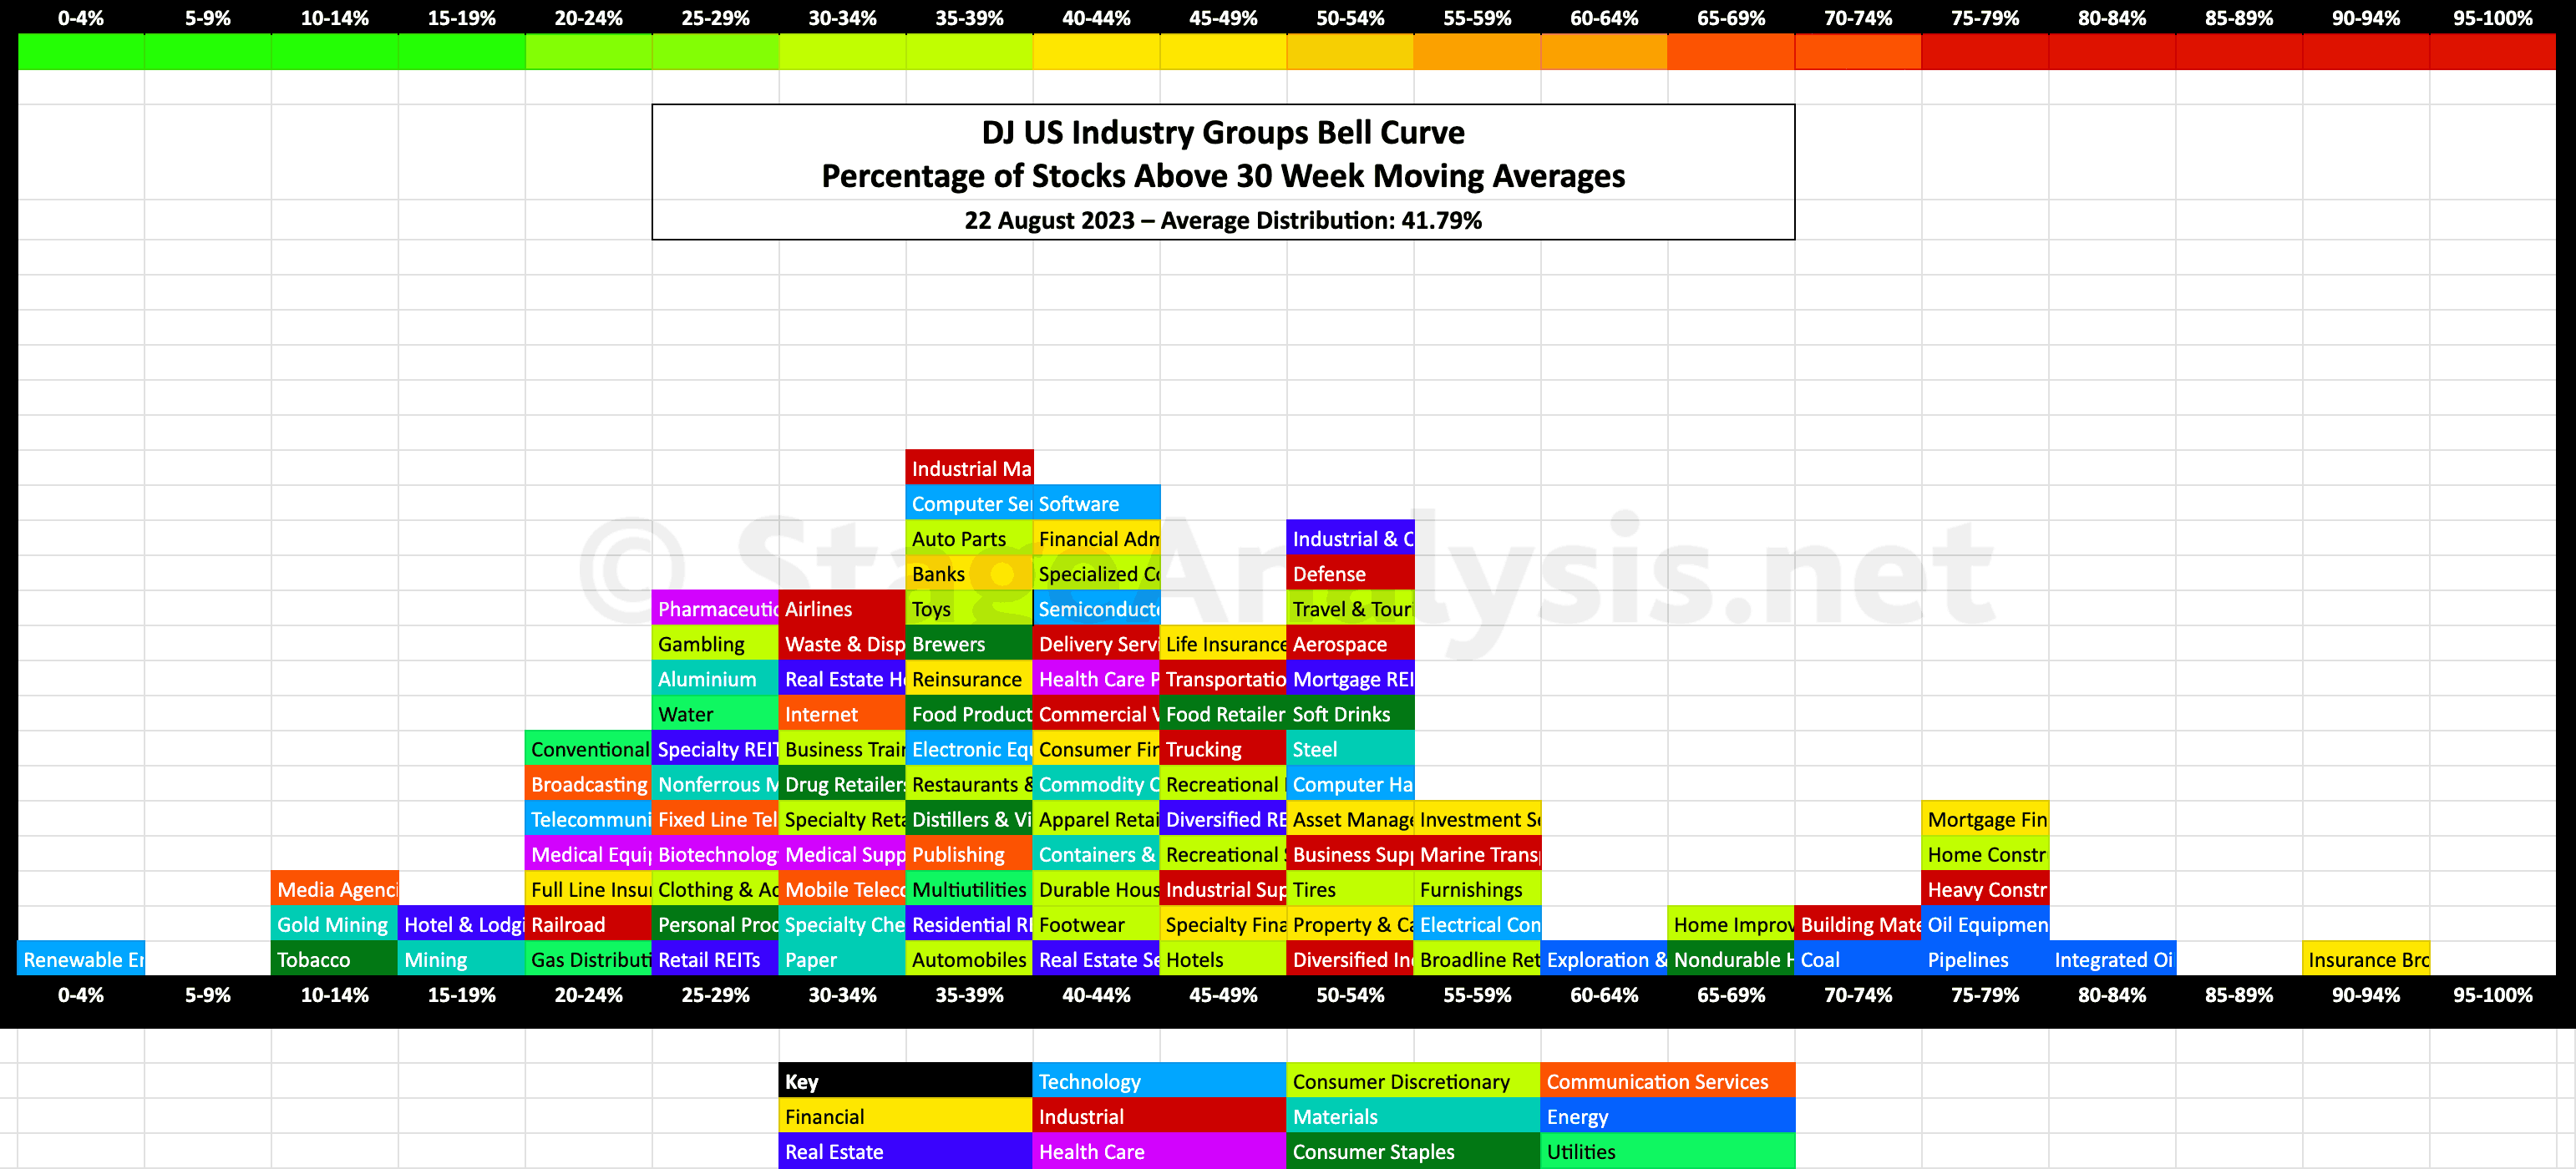
US Industry Groups Bell Curve – Exclusive to StageAnalysis.net
Exclusive graphic of the 104 Dow Jones Industry Groups showing the Percentage of Stocks Above 30 week MA in each group visualised as a Bell Curve chart...
Read More
17 August, 2023
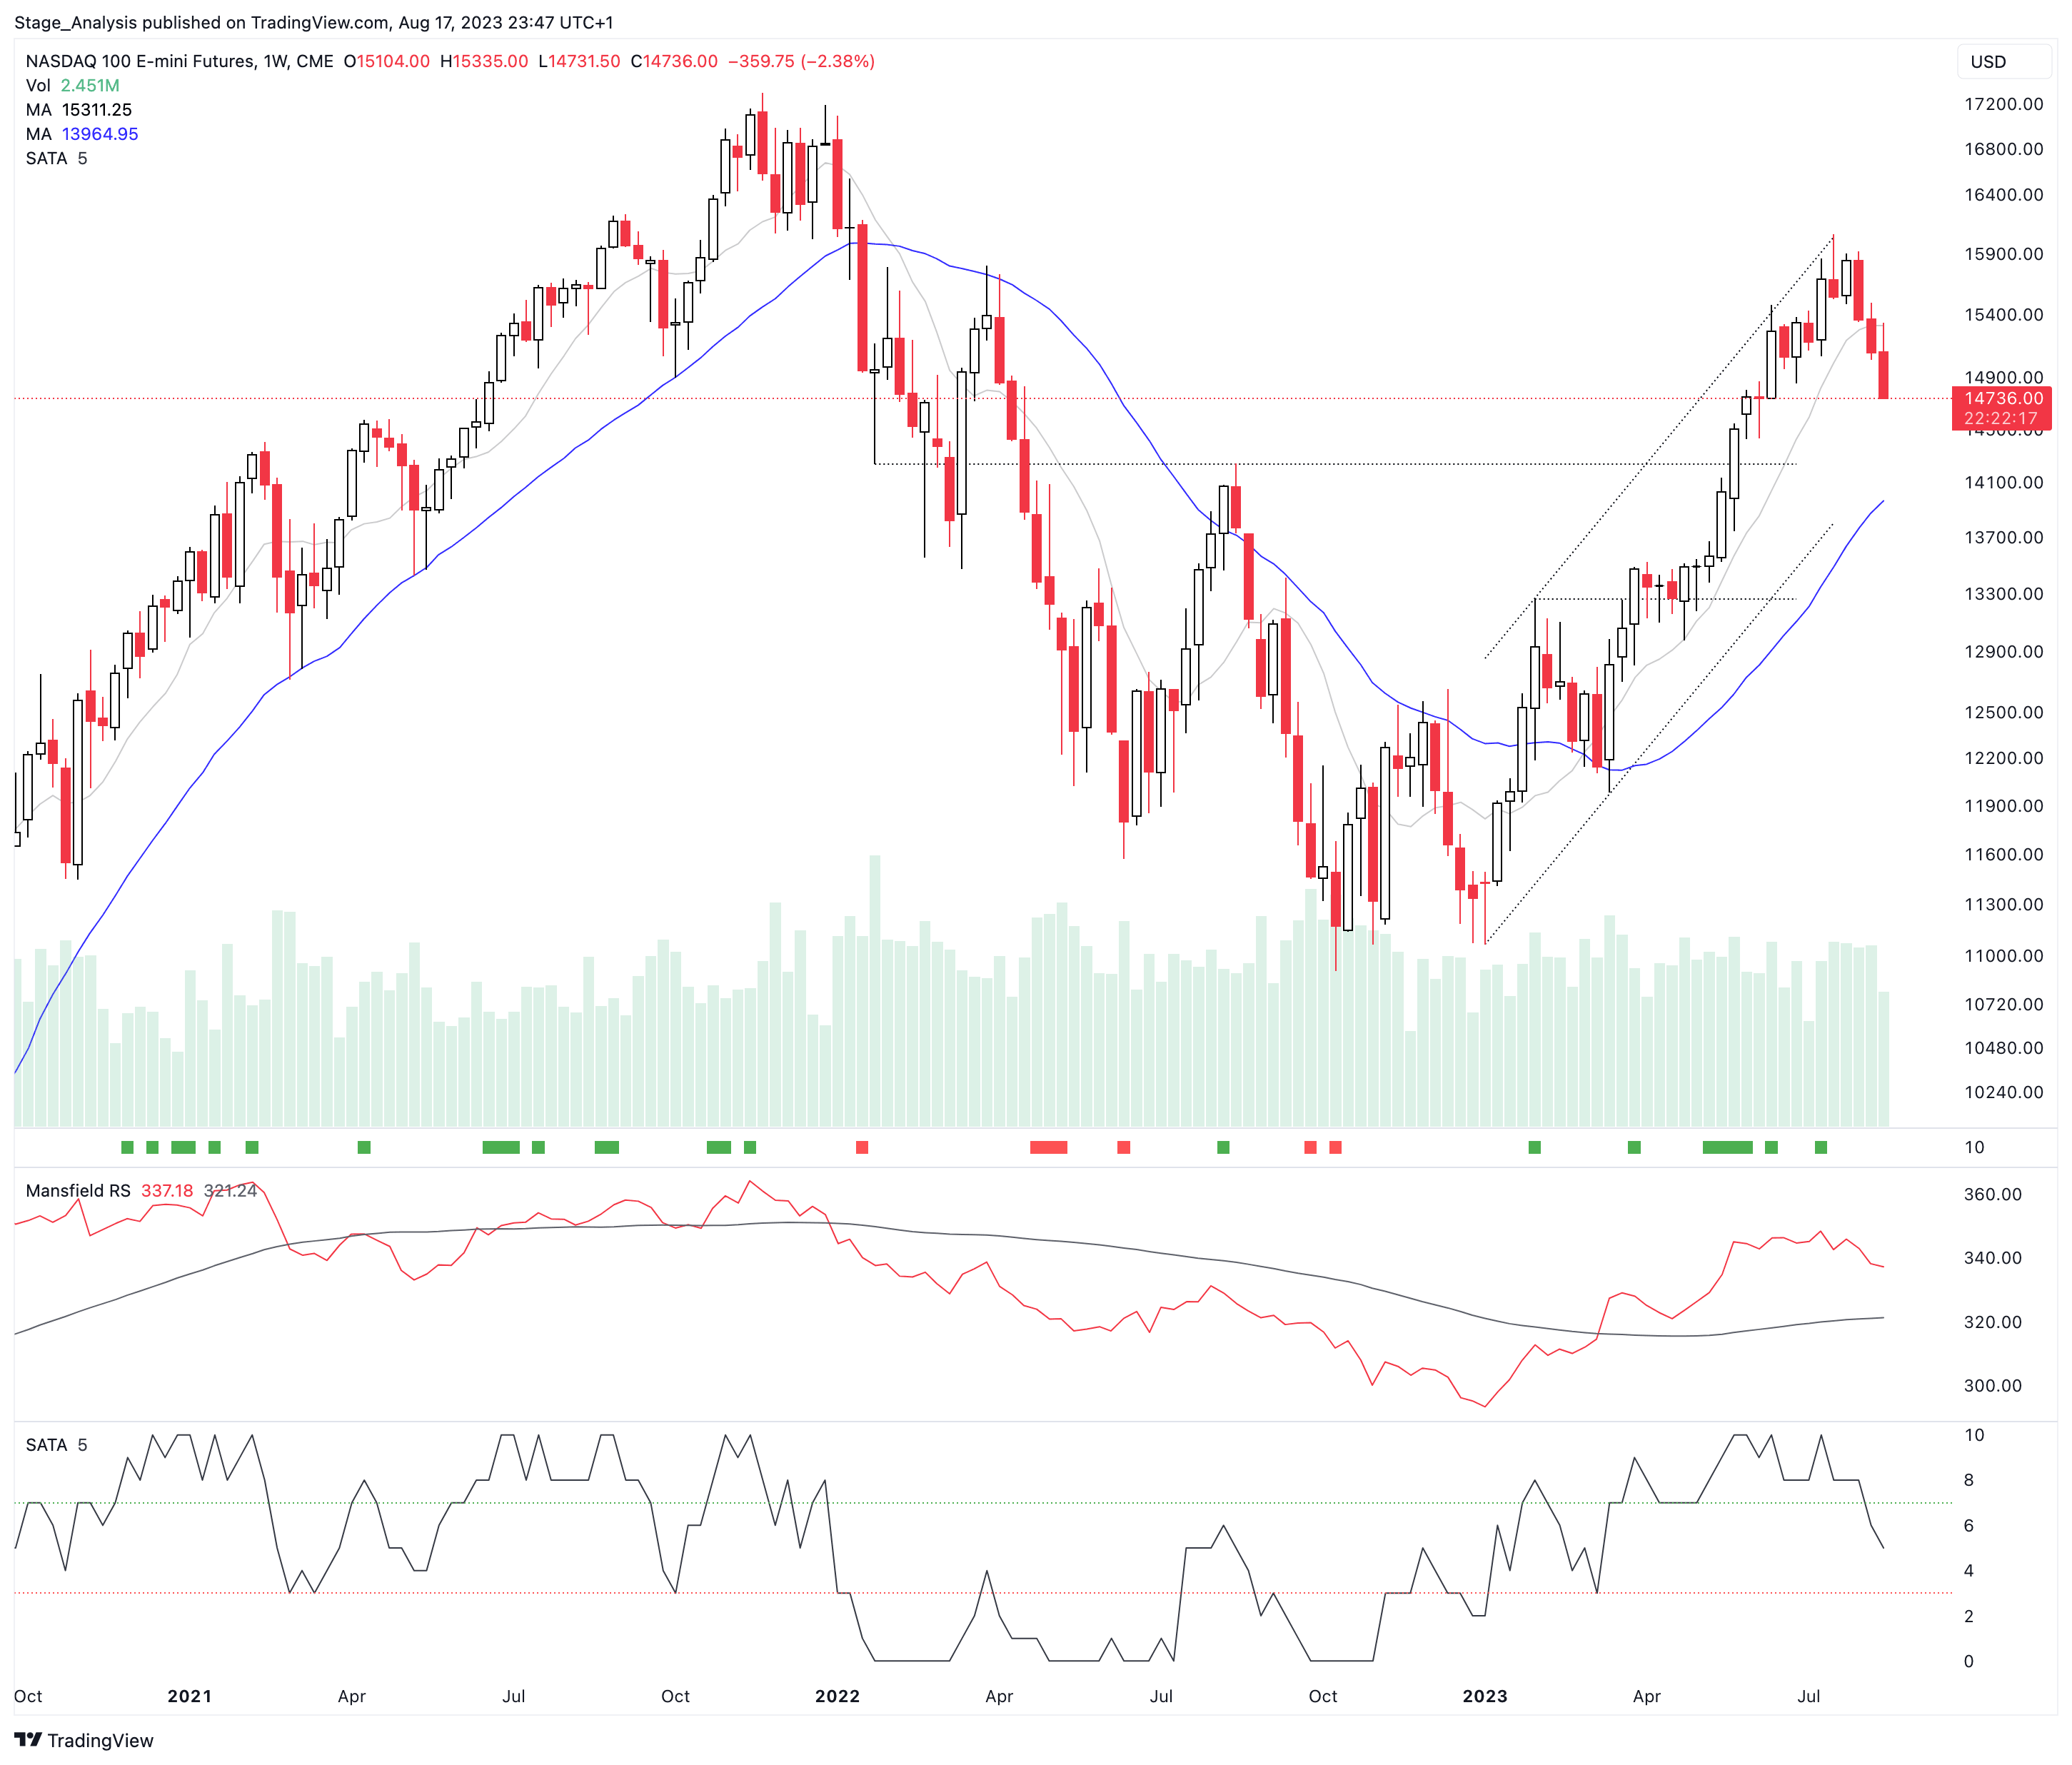
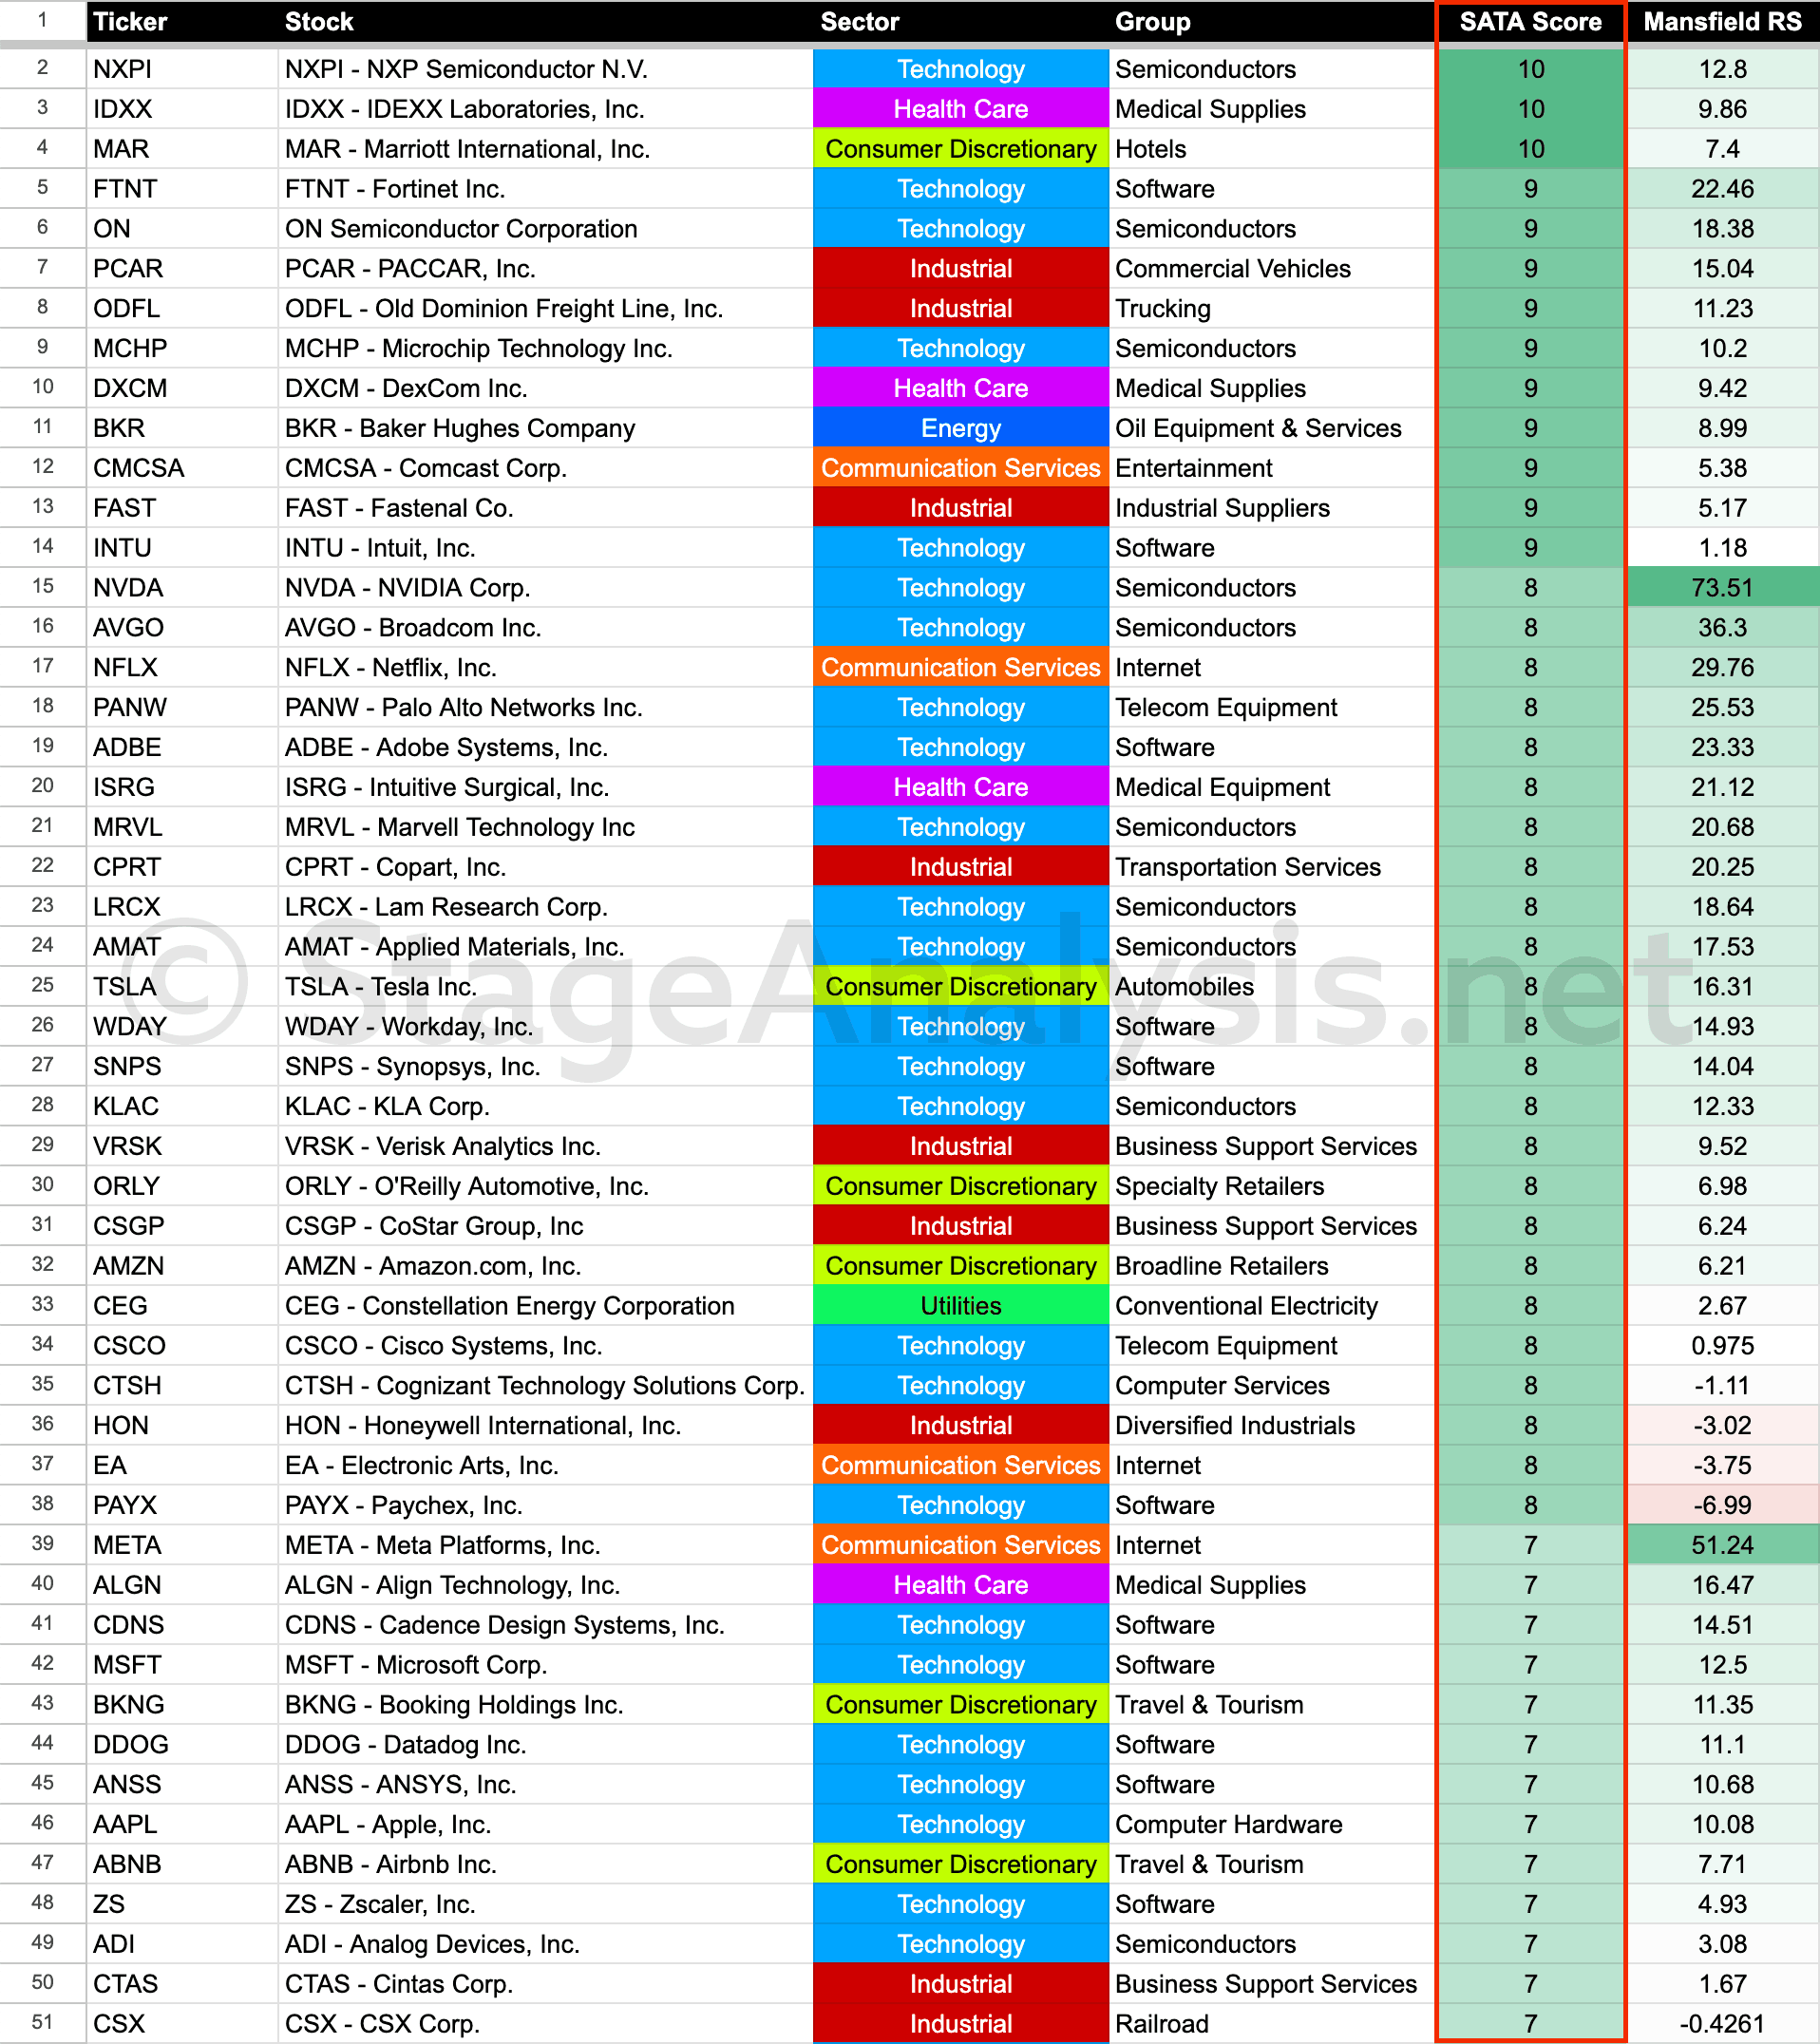
Stage Analysis Technical Attributes Scores – Nasdaq 100
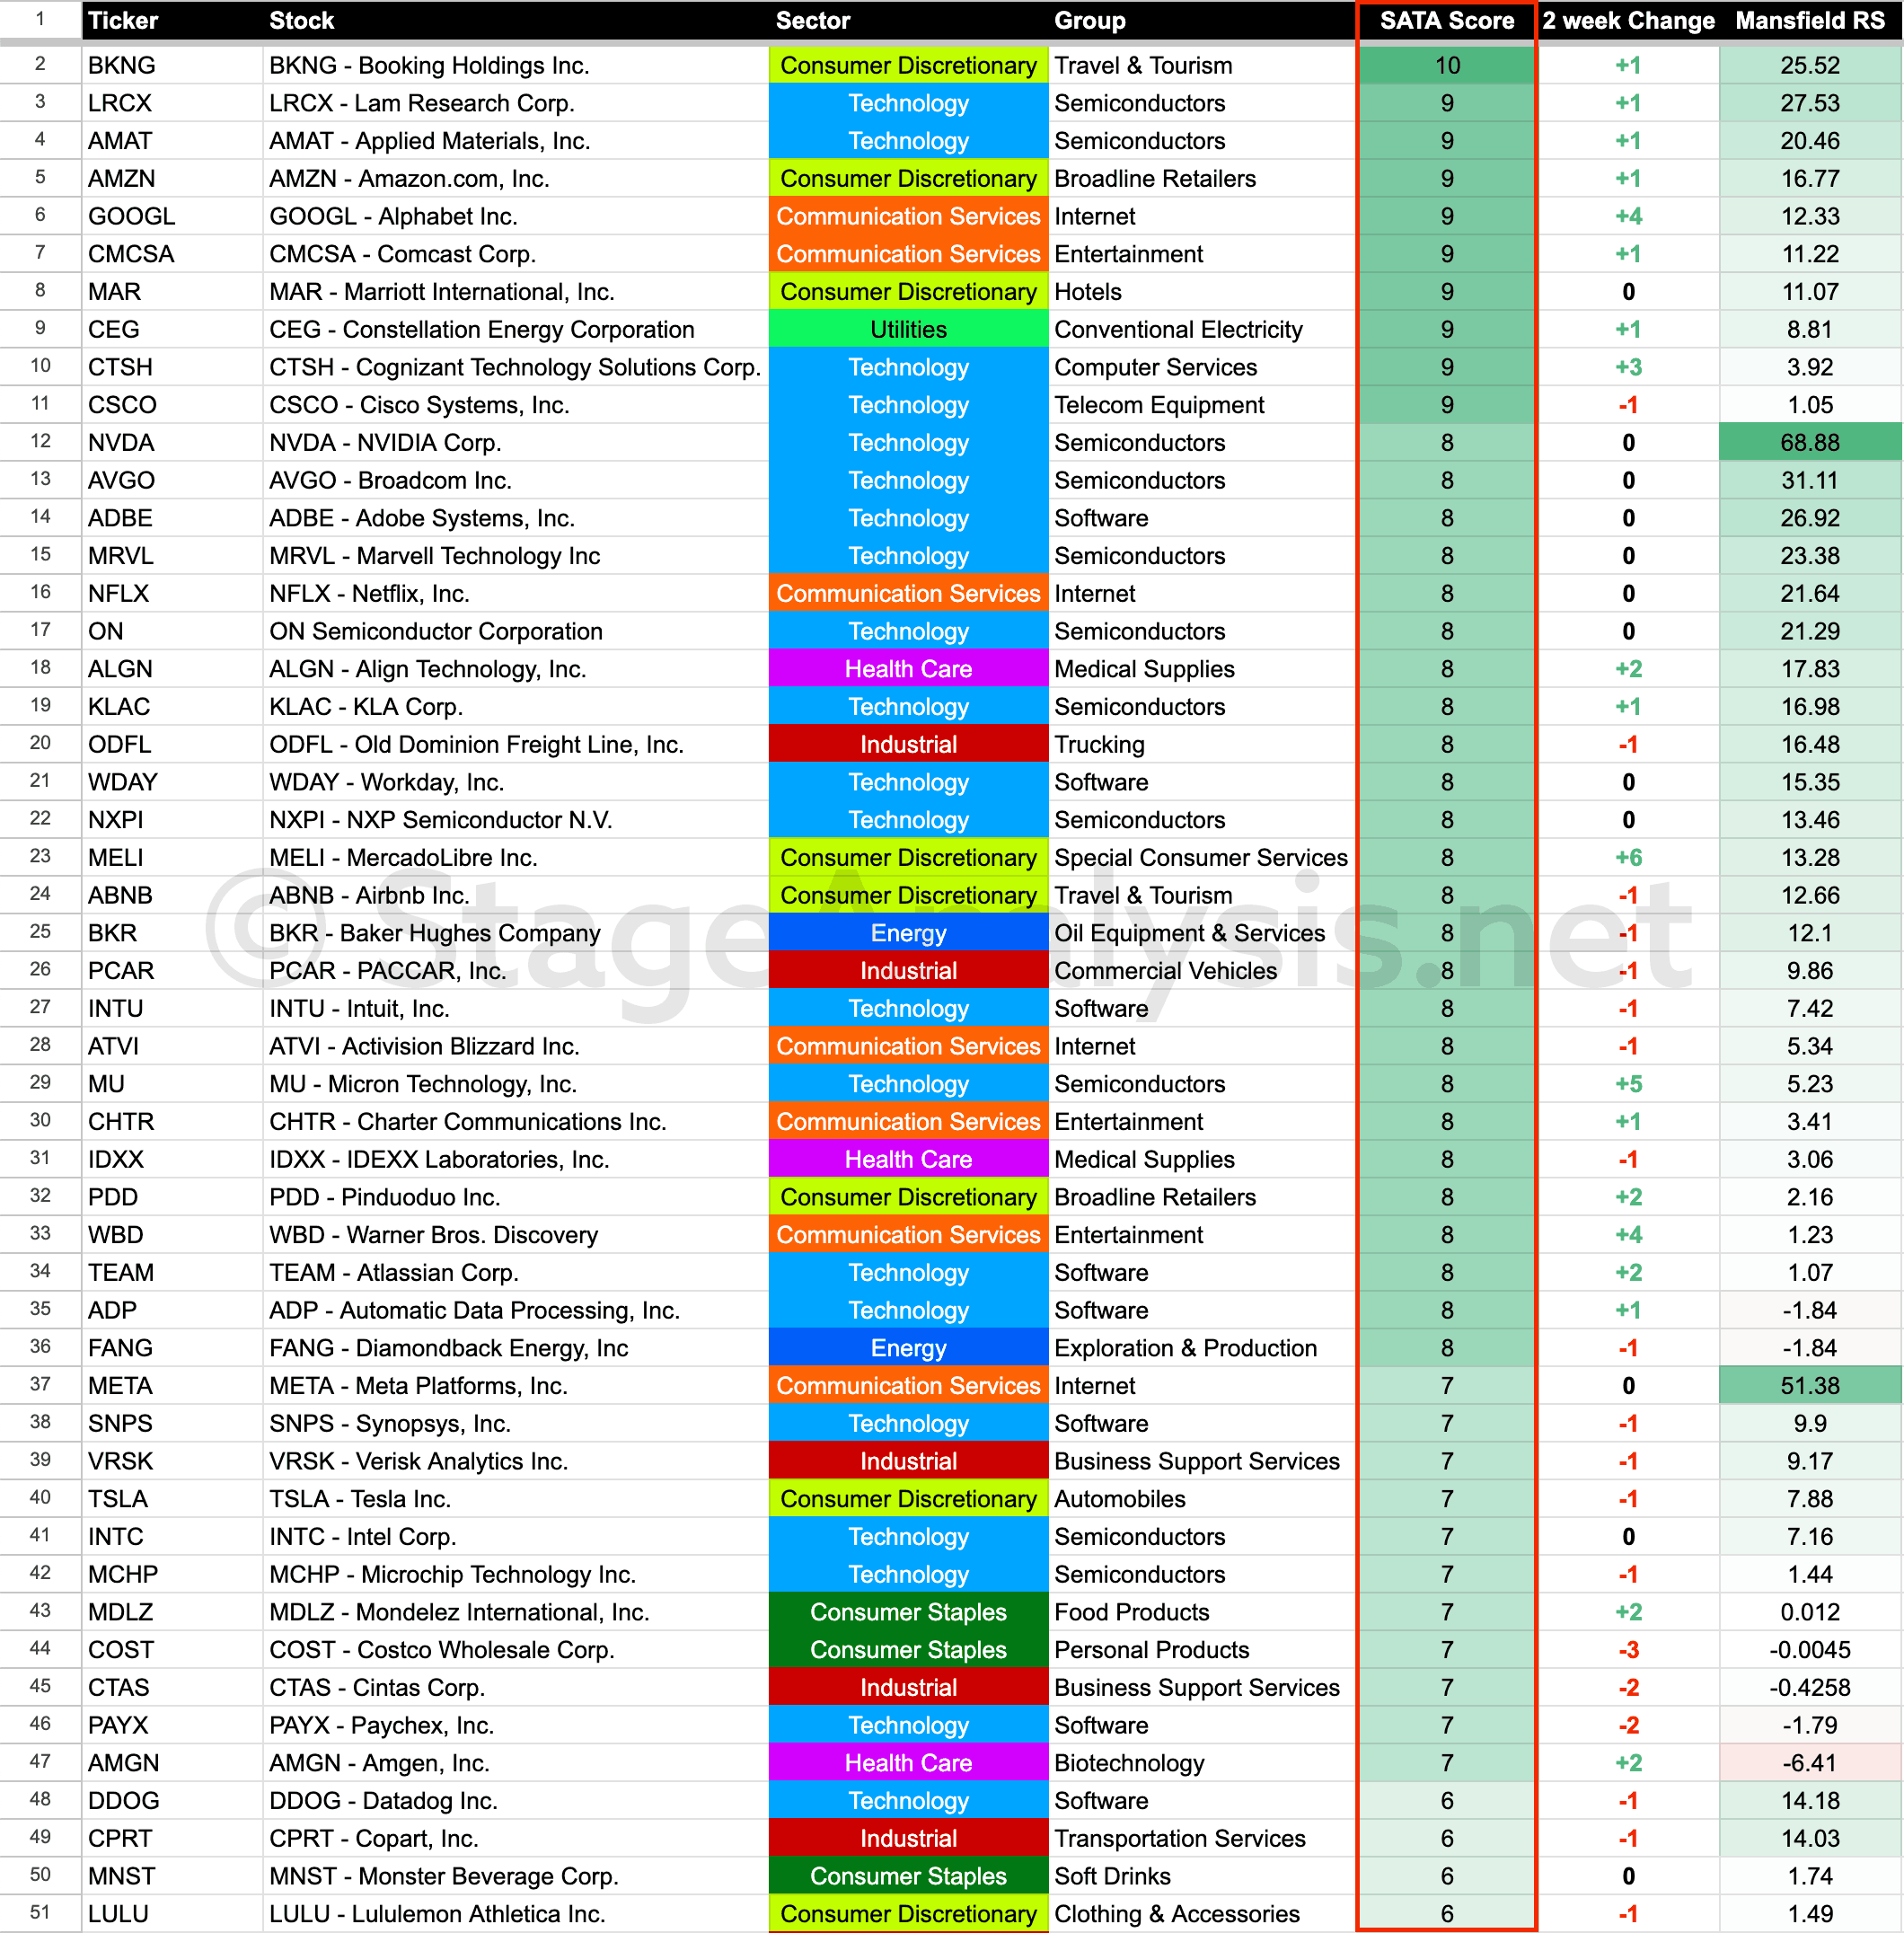
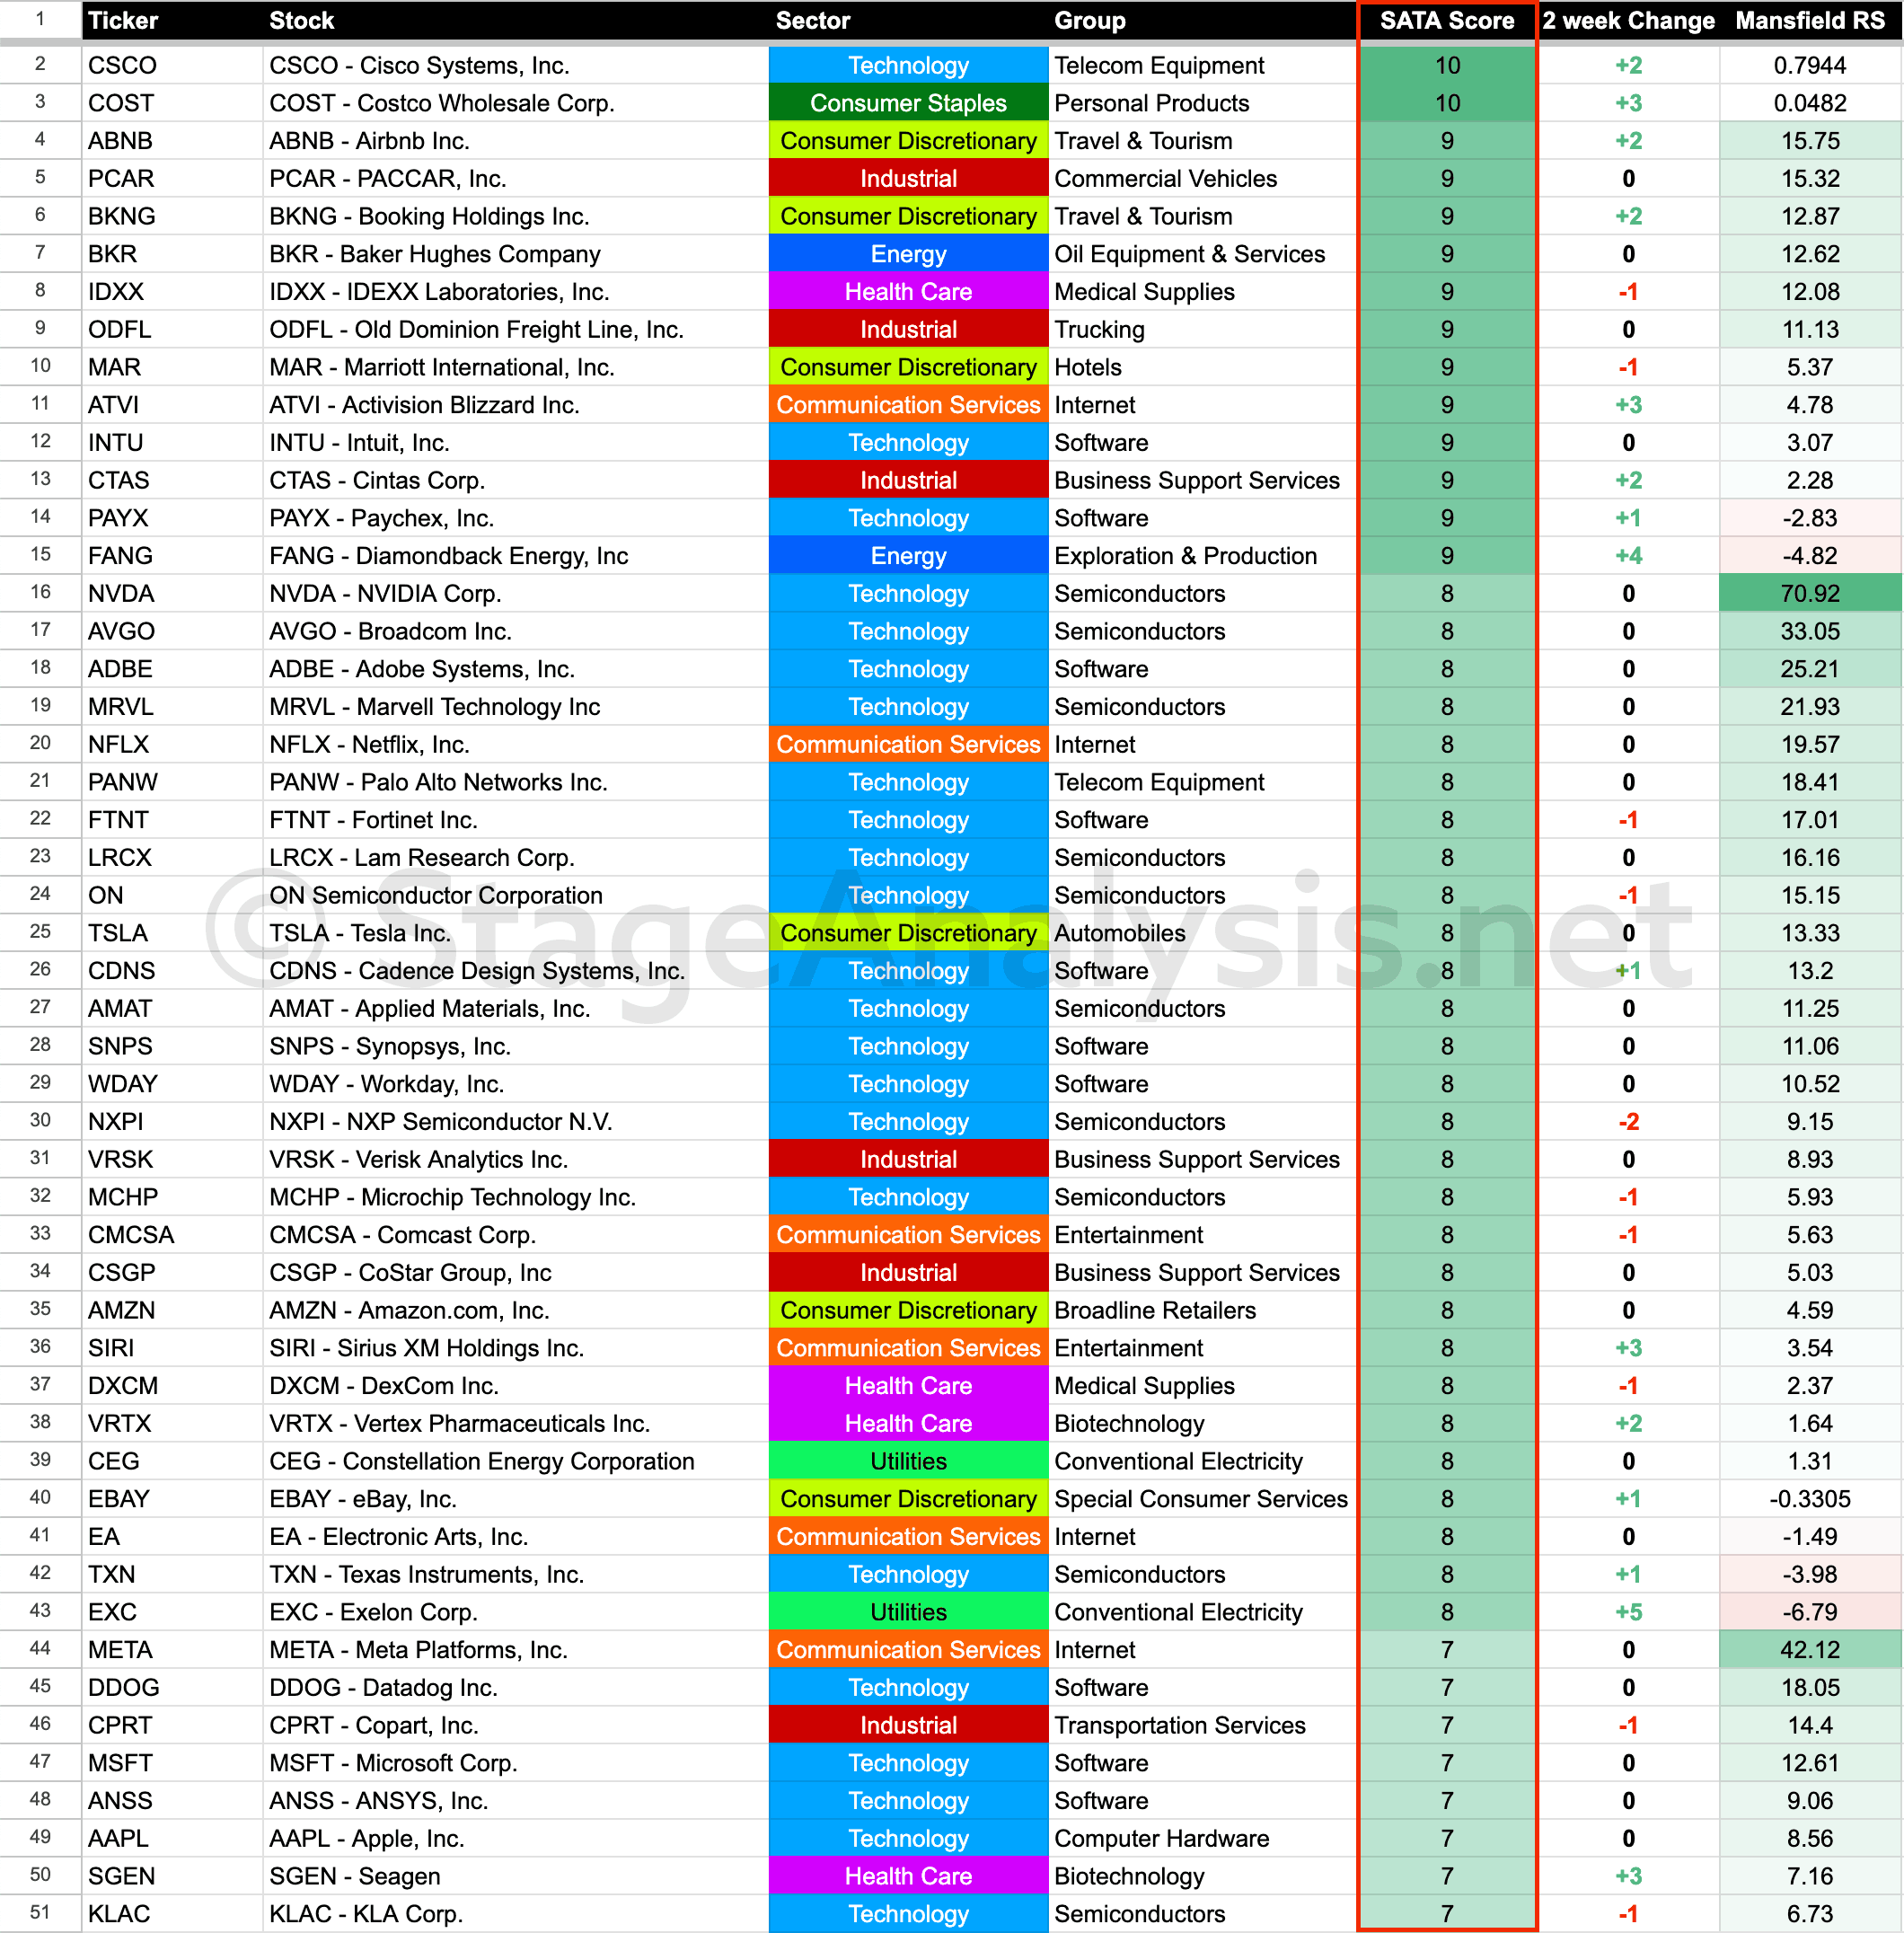
The Stage Analysis Technical Attributes (SATA) score is our proprietary indicator that helps to identify the four stages from Stan Weinstein's Stage Analysis method, using a scoring system from 0 to 10 that rates ten of the key technical characteristics that we look for when analysing the weekly charts.
Read More
14 August, 2023
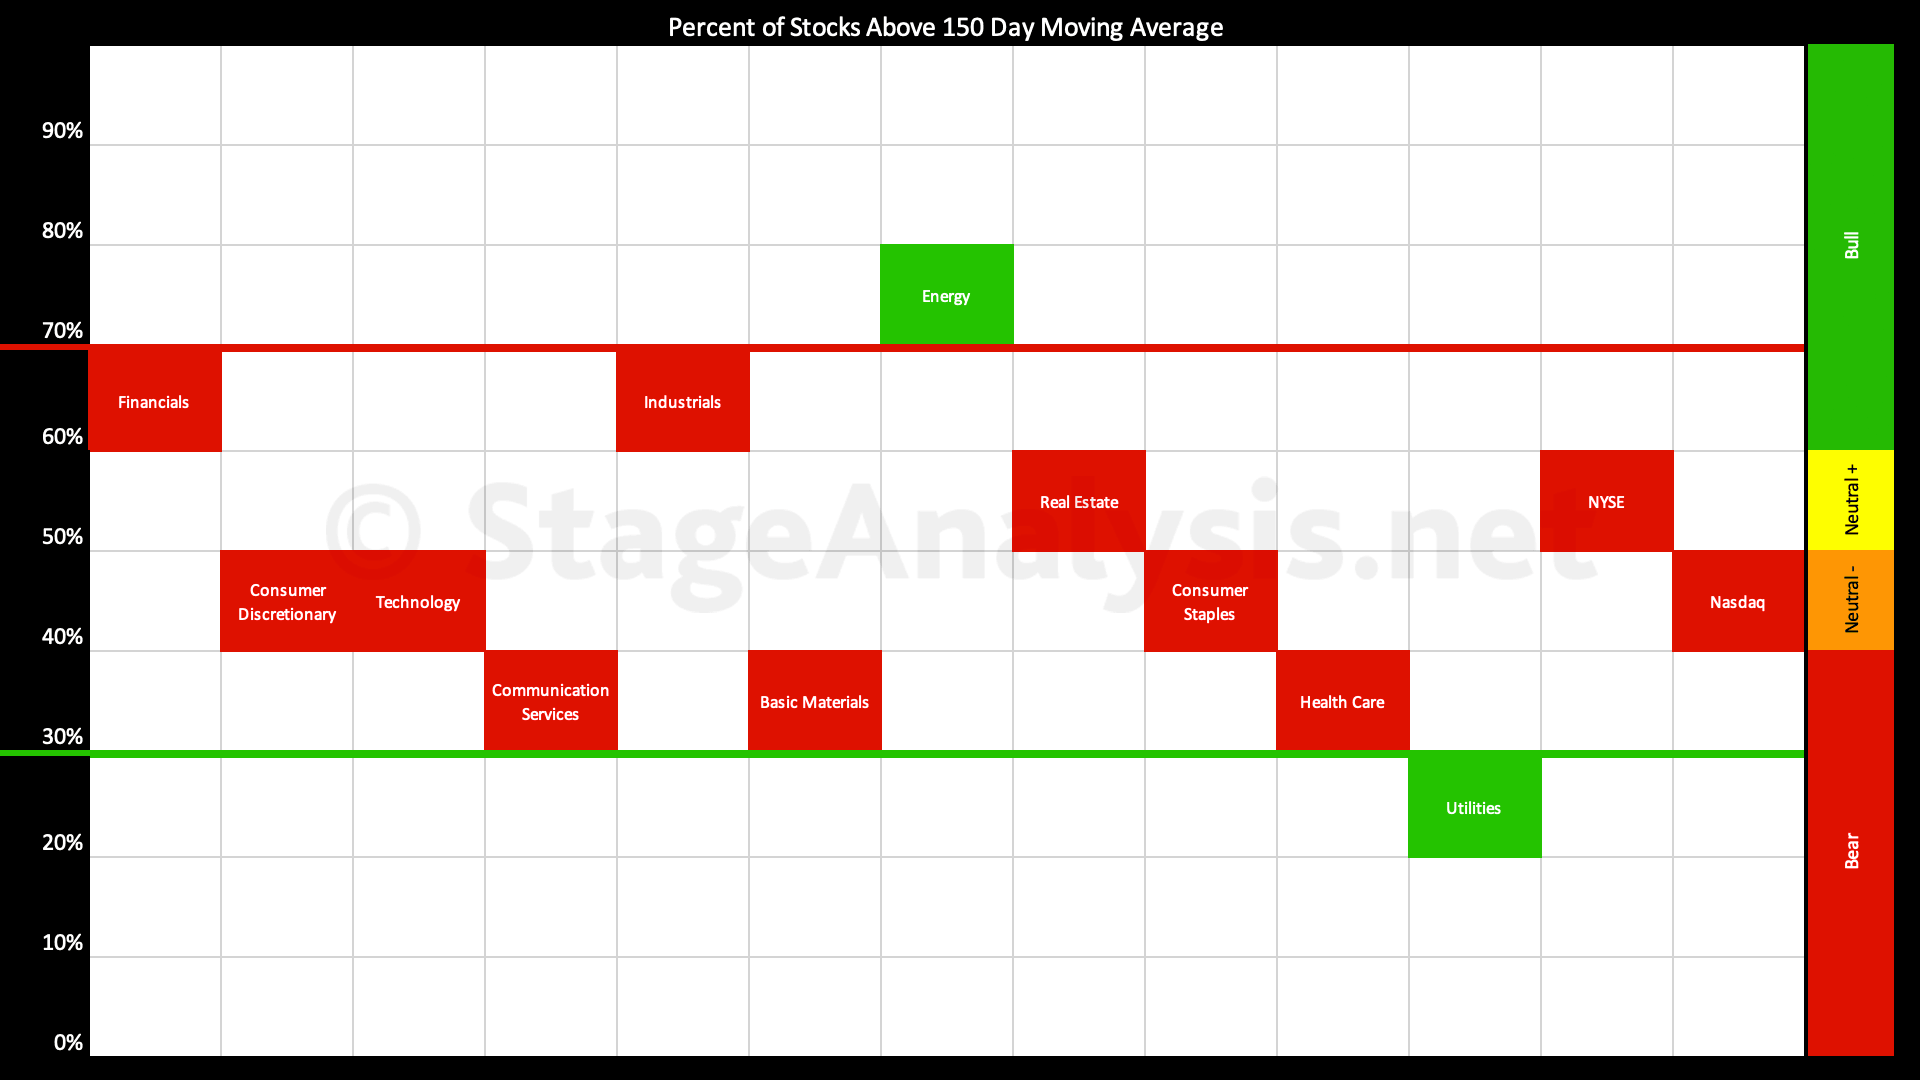
Sector Breadth: Percentage of US Stocks Above Their 150 day (30 Week) Moving Averages
The Percentage of US Stocks Above Their 150 day Moving Averages in the 11 major sectors has declined by -11.96% over the last few weeks since the previous post on the 31st July 2023, moving the overall average down to 47.42%, which in the Neutral- zone, just below the mid-point. Hence a very neutral overall field position...
Read More
07 August, 2023
Stage Analysis Technical Attributes Scores – Nasdaq 100
The Stage Analysis Technical Attributes (SATA) score is our proprietary indicator that helps to identify the four stages from Stan Weinstein's Stage Analysis method, using a scoring system from 0 to 10 that rates ten of the key technical characteristics that we look for when analysing the weekly charts.
Read More
31 July, 2023
Sector Breadth: Percentage of US Stocks Above Their 150 day (30 Week) Moving Averages
The Percentage of US Stocks Above Their 150 day Moving Averages in the 11 major sectors has improved by +5.59% over the last few weeks since the previous post on the 17th July 2023, moving the overall average up to 59.38%...
Read More
24 July, 2023
Stage Analysis Technical Attributes Scores – Nasdaq 100
The Stage Analysis Technical Attributes (SATA) score is our proprietary indicator that helps to identify the four stages from Stan Weinstein's Stage Analysis method, using a scoring system from 0 to 10 that rates ten of the key technical characteristics that we look for when analysing the weekly charts.
Read More
17 July, 2023
Sector Breadth: Percentage of US Stocks Above Their 150 day (30 Week) Moving Averages
The percentage of US stocks above their 150 day (30 week) moving averages in the 11 major sectors post provides a unique snapshot of the overall market health and is highlighted every few weeks in the Stage Analysis blog...
Read More
10 July, 2023
Stage Analysis Technical Attributes Scores – Nasdaq 100
The Stage Analysis Technical Attributes (SATA) score is our proprietary indicator that helps to identify the four stages from Stan Weinstein's Stage Analysis method, using a scoring system from 0 to 10 that rates ten of the key technical characteristics that we look for when analysing the weekly charts.
Read More
03 July, 2023
Sector Breadth: Percentage of US Stocks Above Their 150 day (30 Week) Moving Averages
The percentage of US stocks above their 150 day (30 week) moving averages in the 11 major sectors post provides a unique snapshot of the overall market health and is highlighted every few weeks in the Stage Analysis blog...
Read More

