The Stage Analysis Technical Attributes (SATA) score is our proprietary indicator that helps to identify the four stages from Stan Weinstein's Stage Analysis method, using a scoring system from 0 to 10 that rates ten of the key technical characteristics that we look for when analysing the weekly charts.
Read More

Blog
13 November, 2023
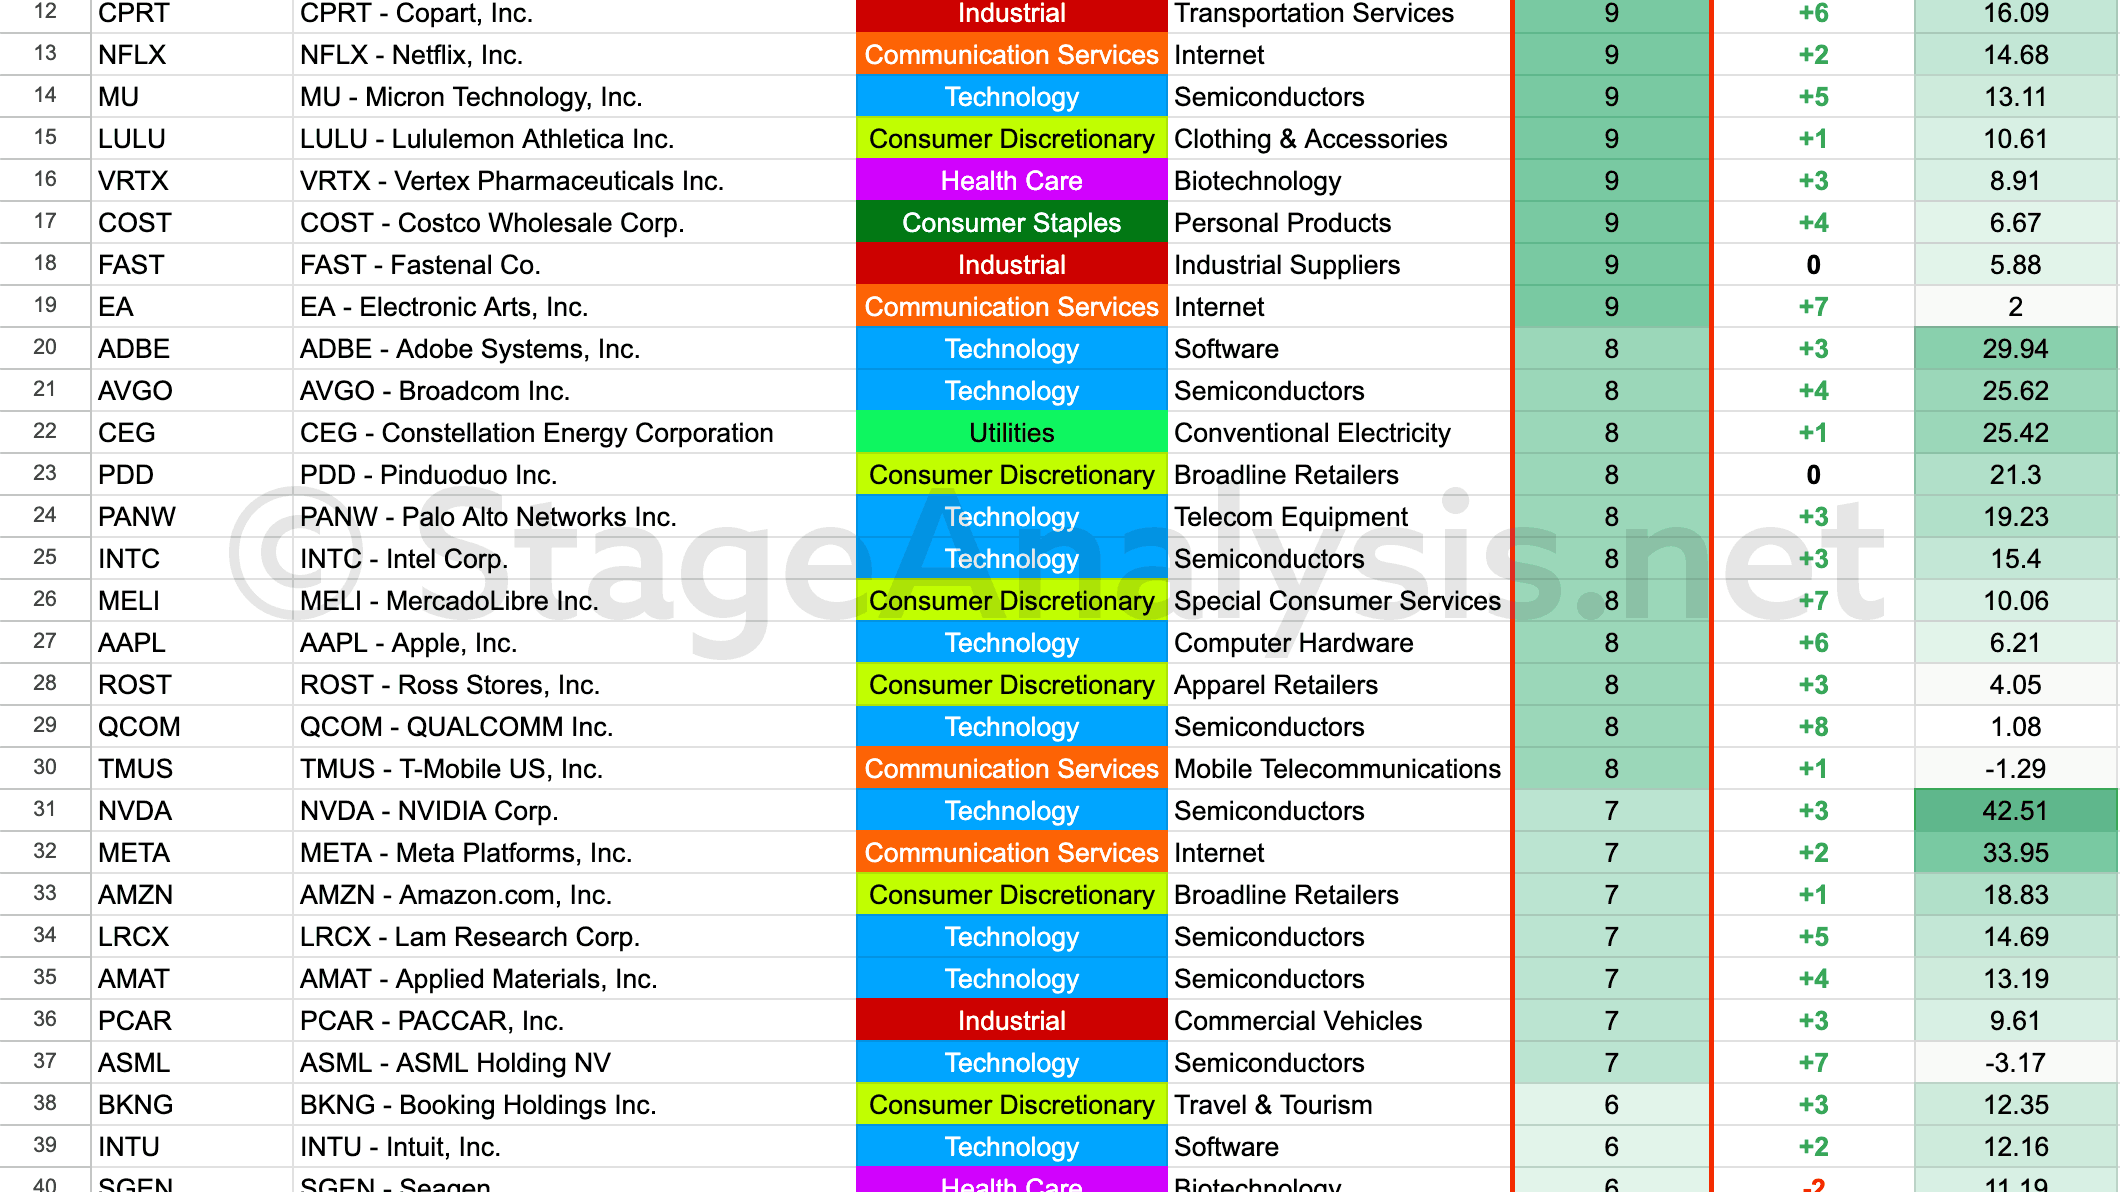
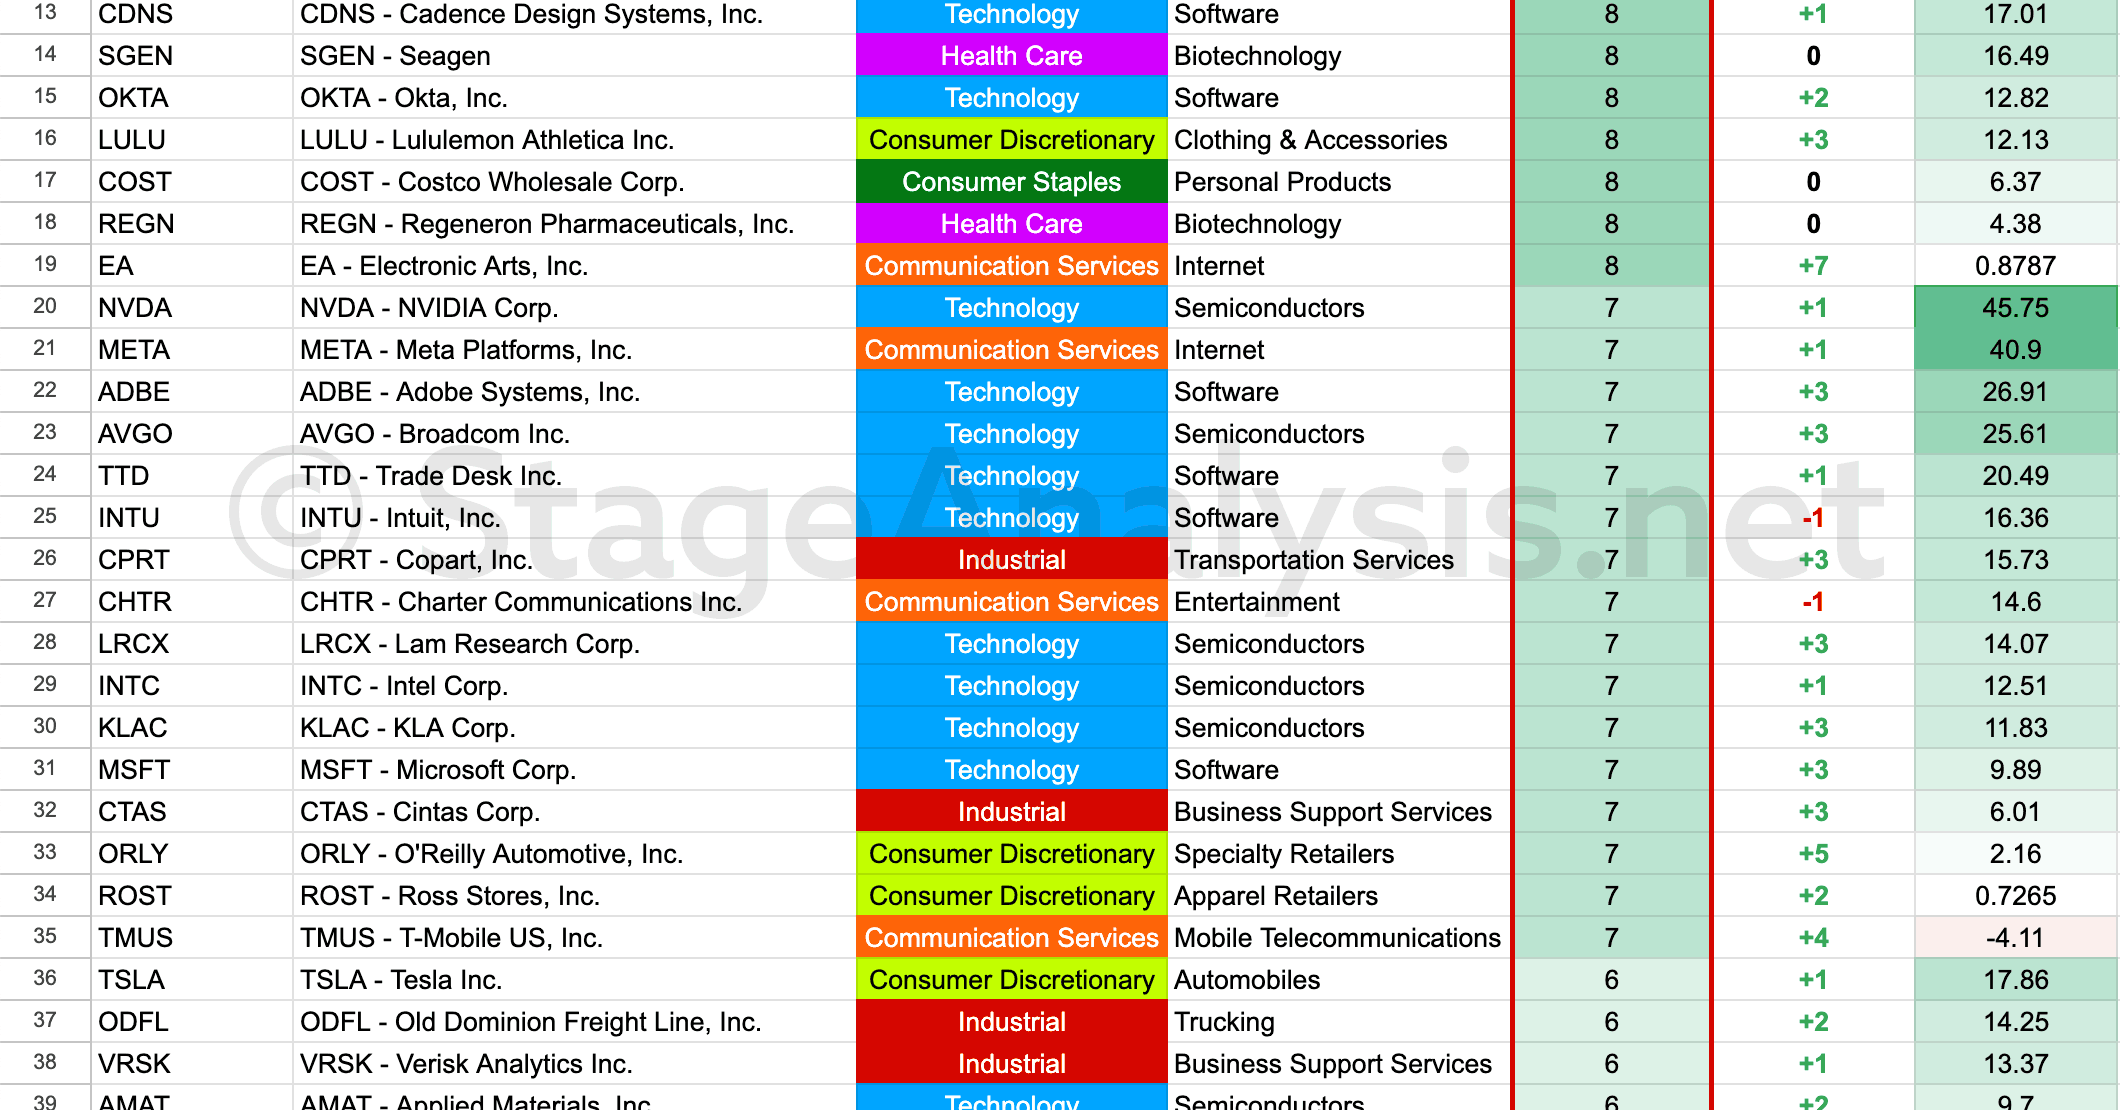
Stage Analysis Technical Attributes Scores – Nasdaq 100
06 November, 2023
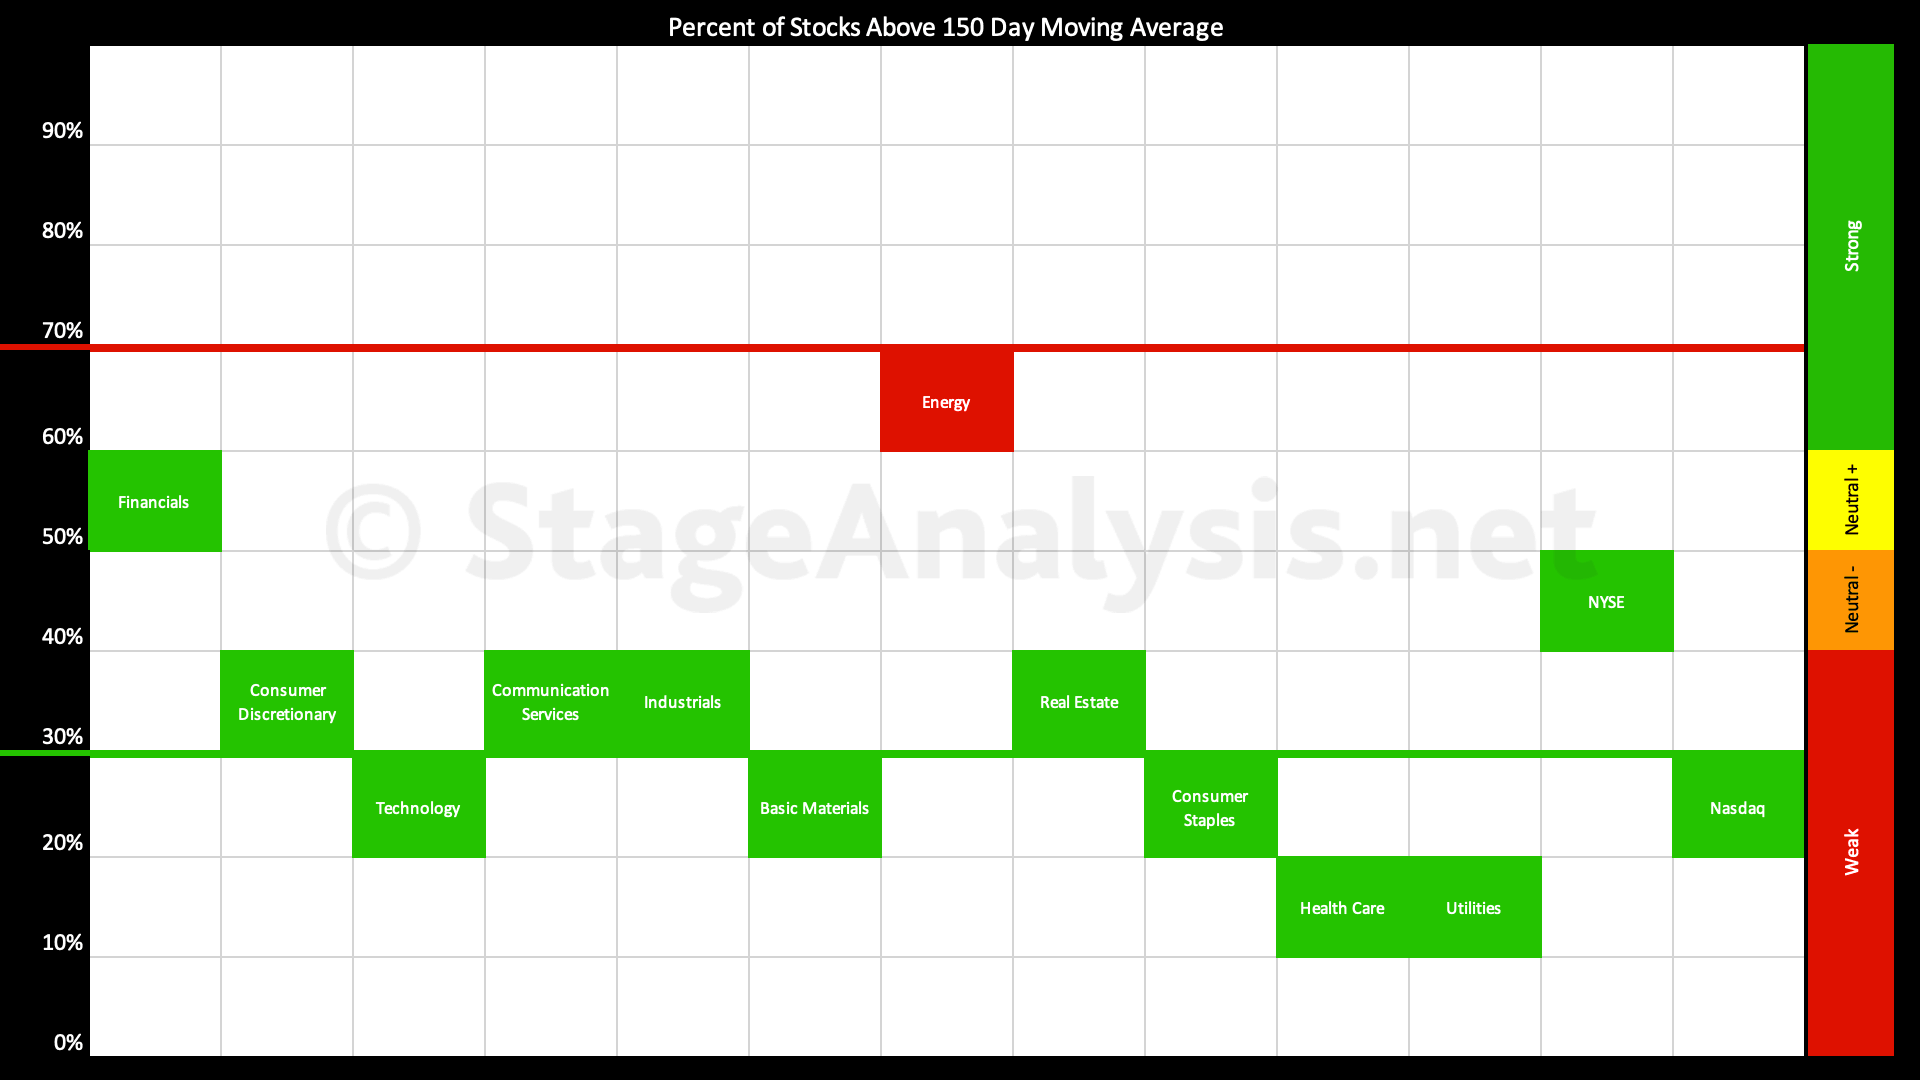
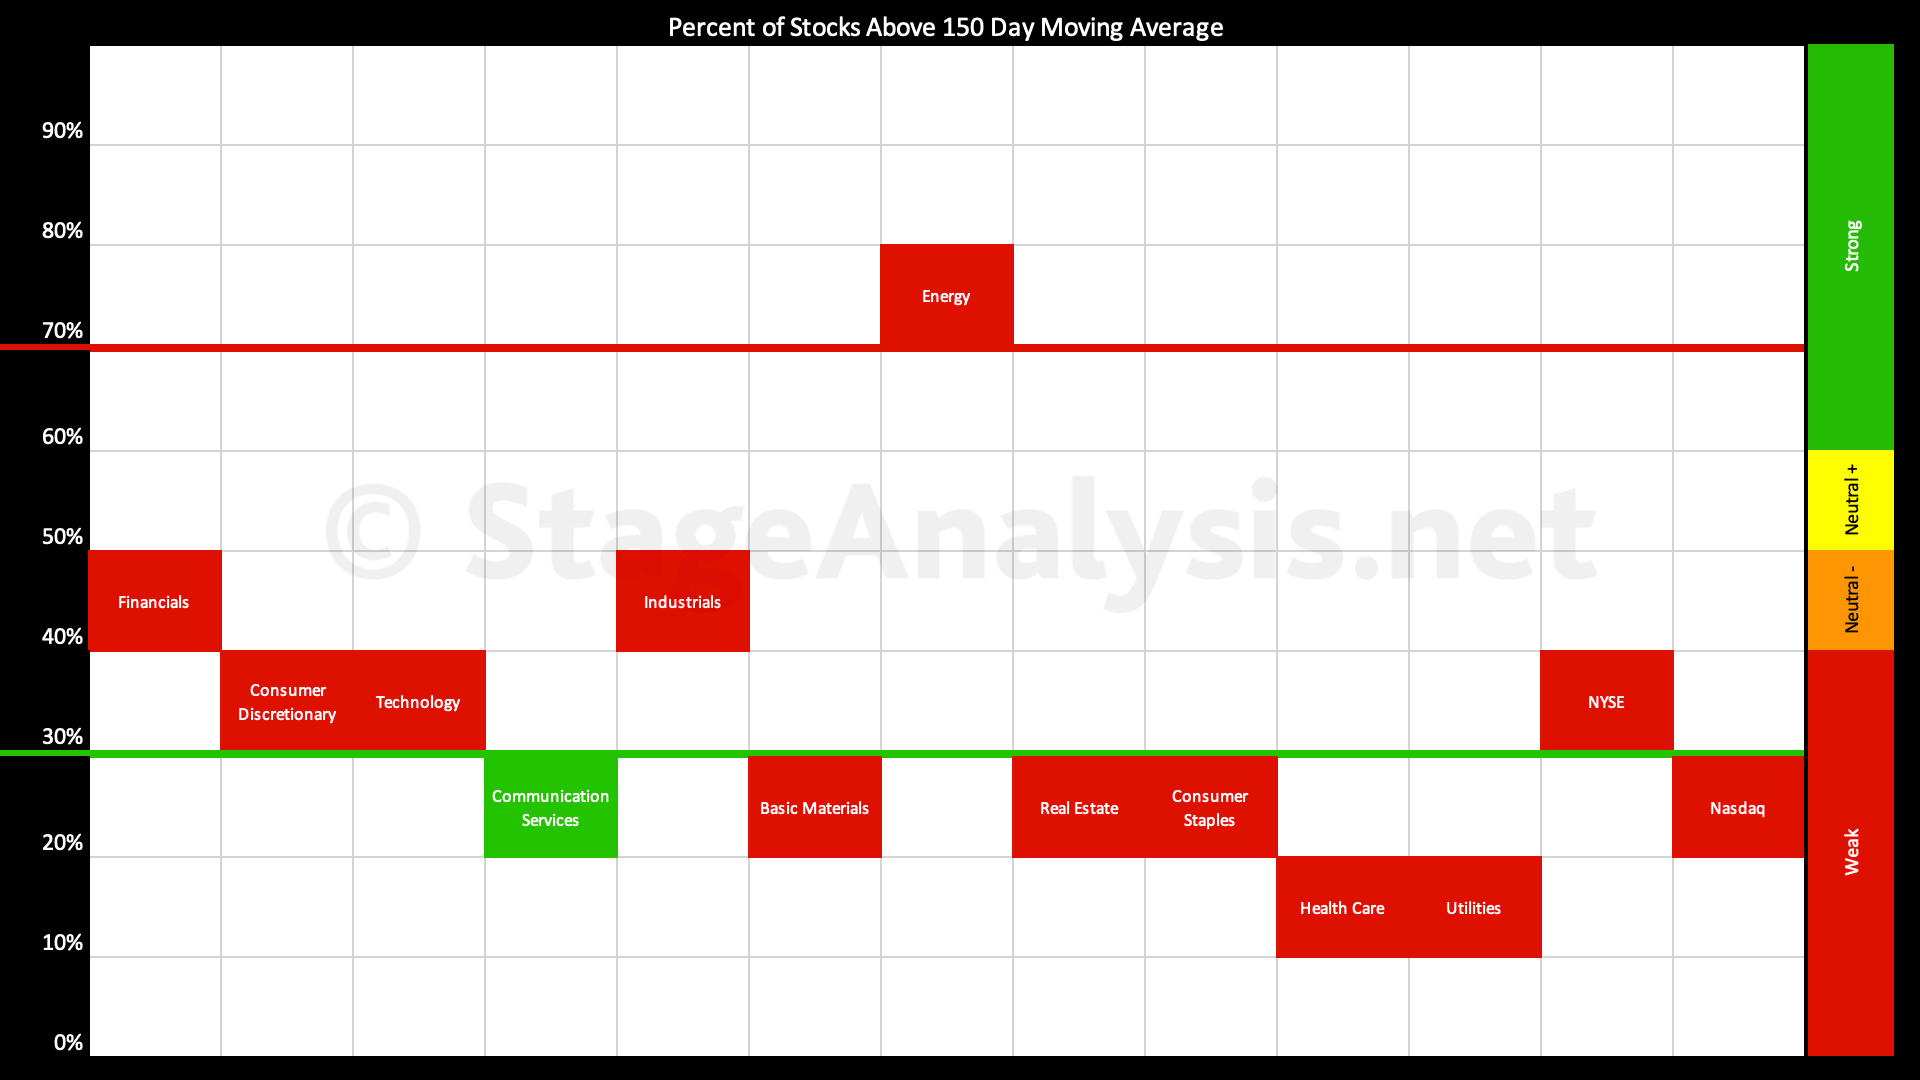
Sector Breadth: Percentage of US Stocks Above Their 150 day (30 Week) Moving Averages
The percentage of US stocks above their 150 day moving averages in the 11 major sectors increased by +10.13% since the previous post on the 23rd October 2023, with a strong rebound from the lower zone up through the key 30% level. Which is a positive change for this contrarian breadth indicator...
Read More
30 October, 2023
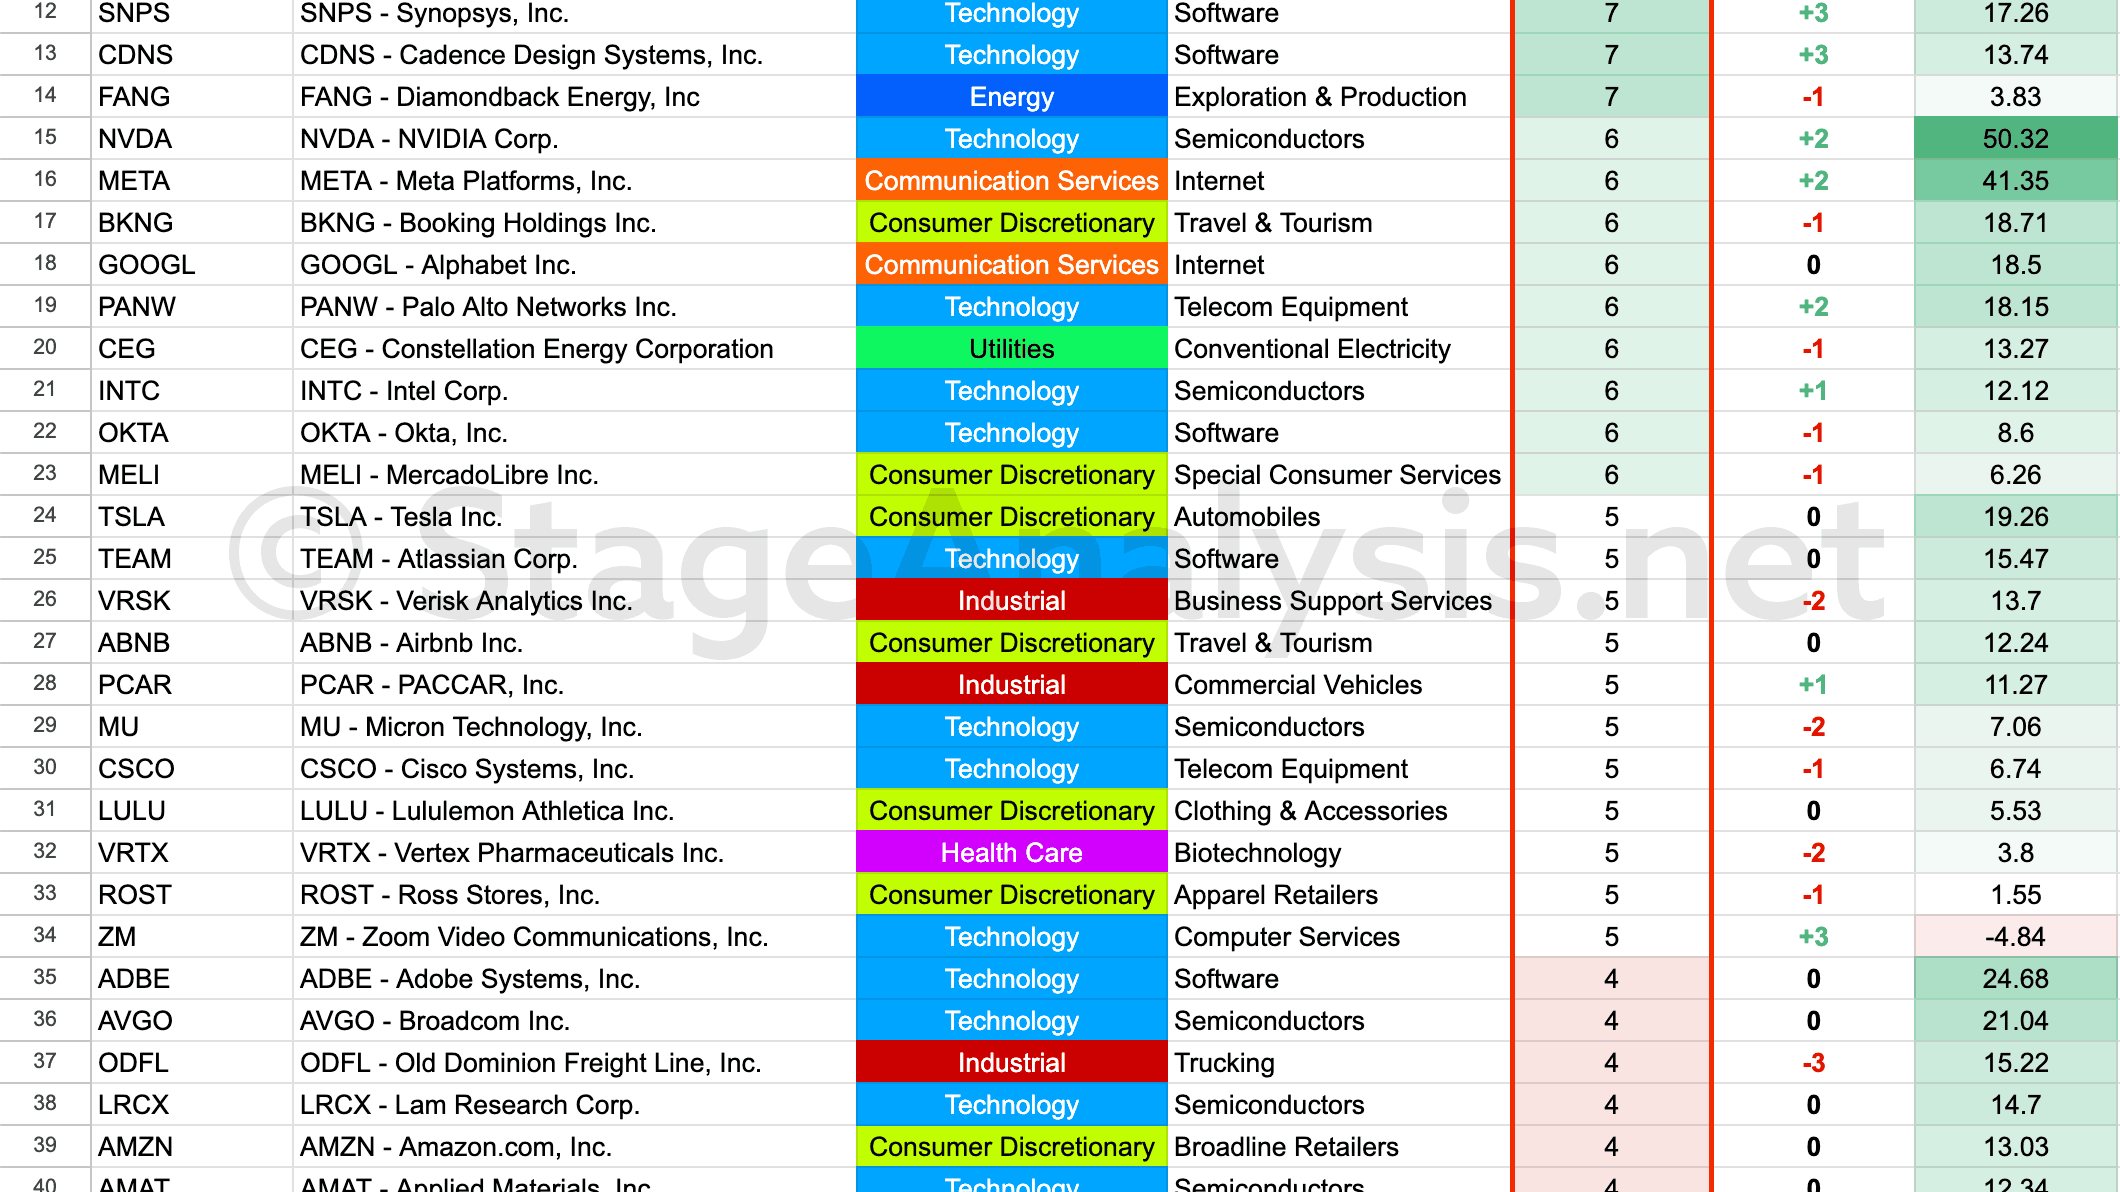
Stage Analysis Technical Attributes Scores – Nasdaq 100
The Stage Analysis Technical Attributes (SATA) score is our proprietary indicator that helps to identify the four stages from Stan Weinstein's Stage Analysis method, using a scoring system from 0 to 10 that rates ten of the key technical characteristics that we look for when analysing the weekly charts.
Read More
23 October, 2023
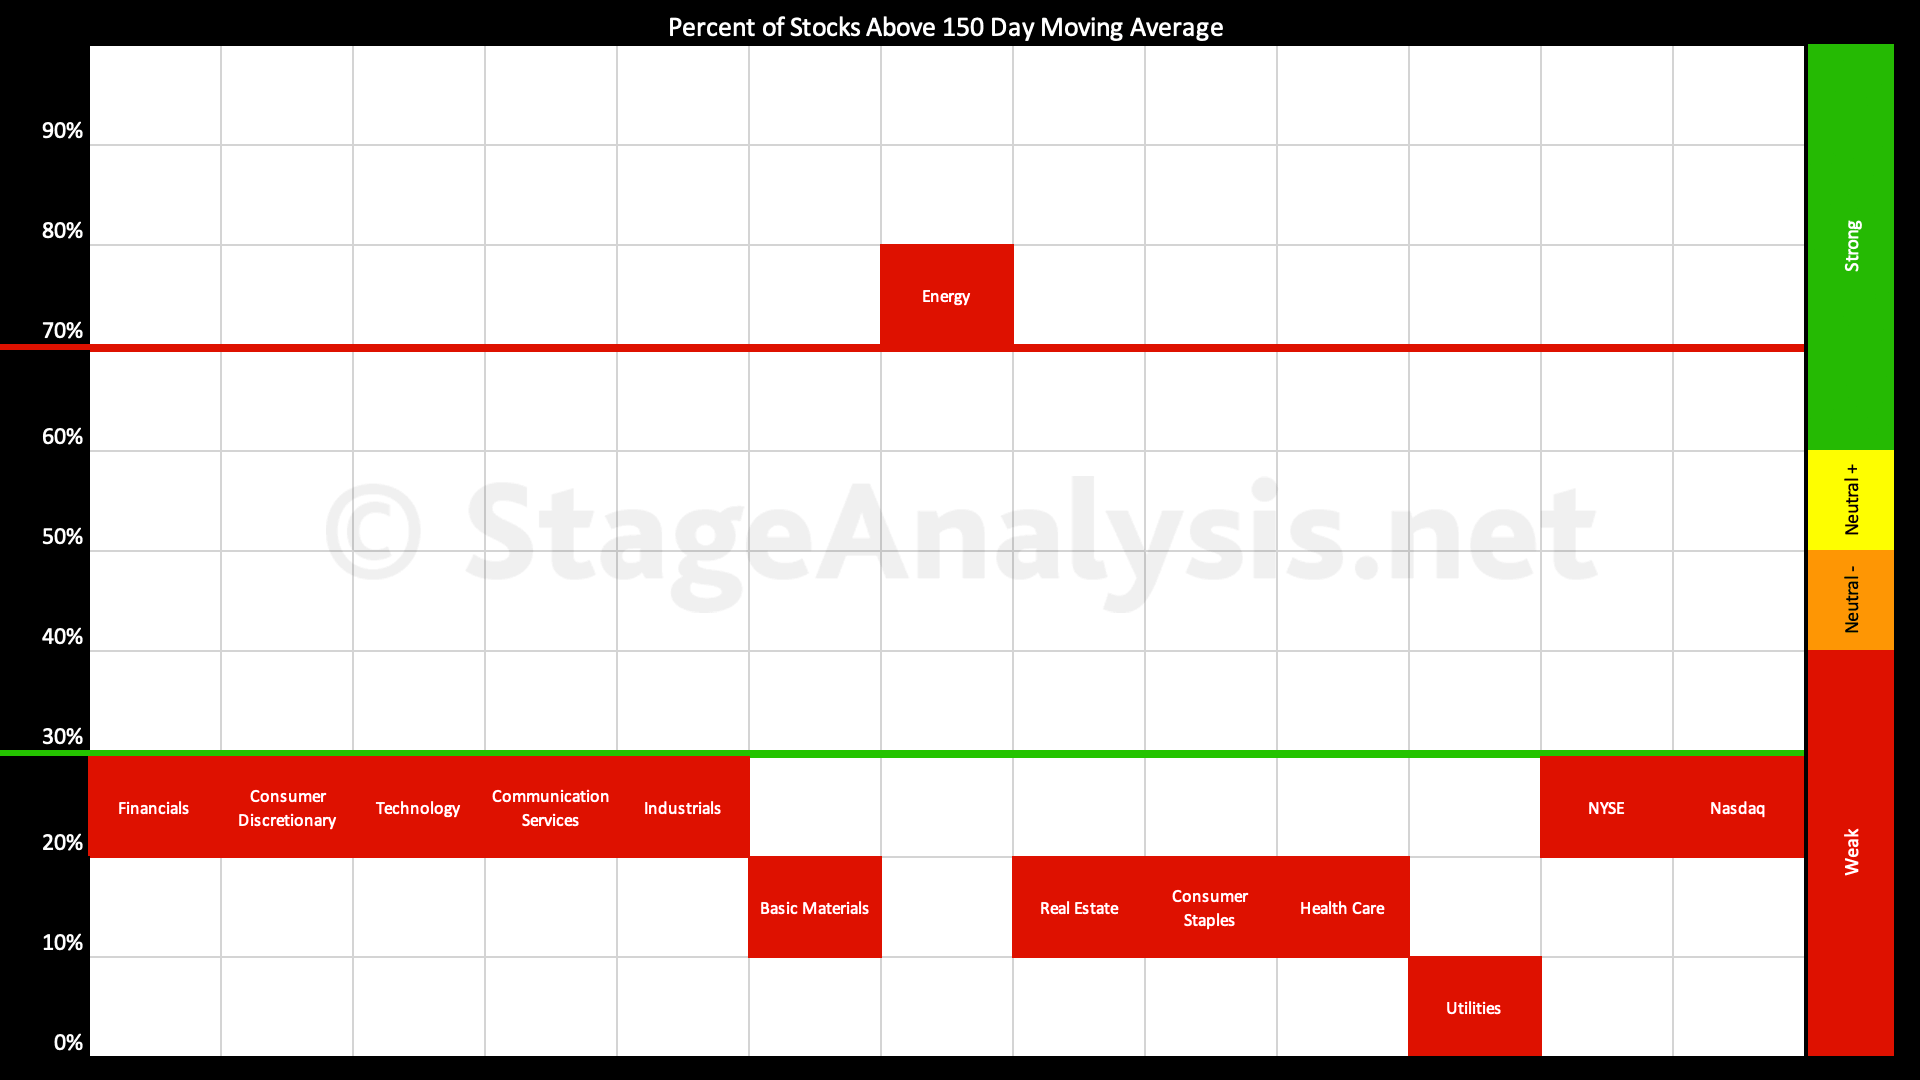
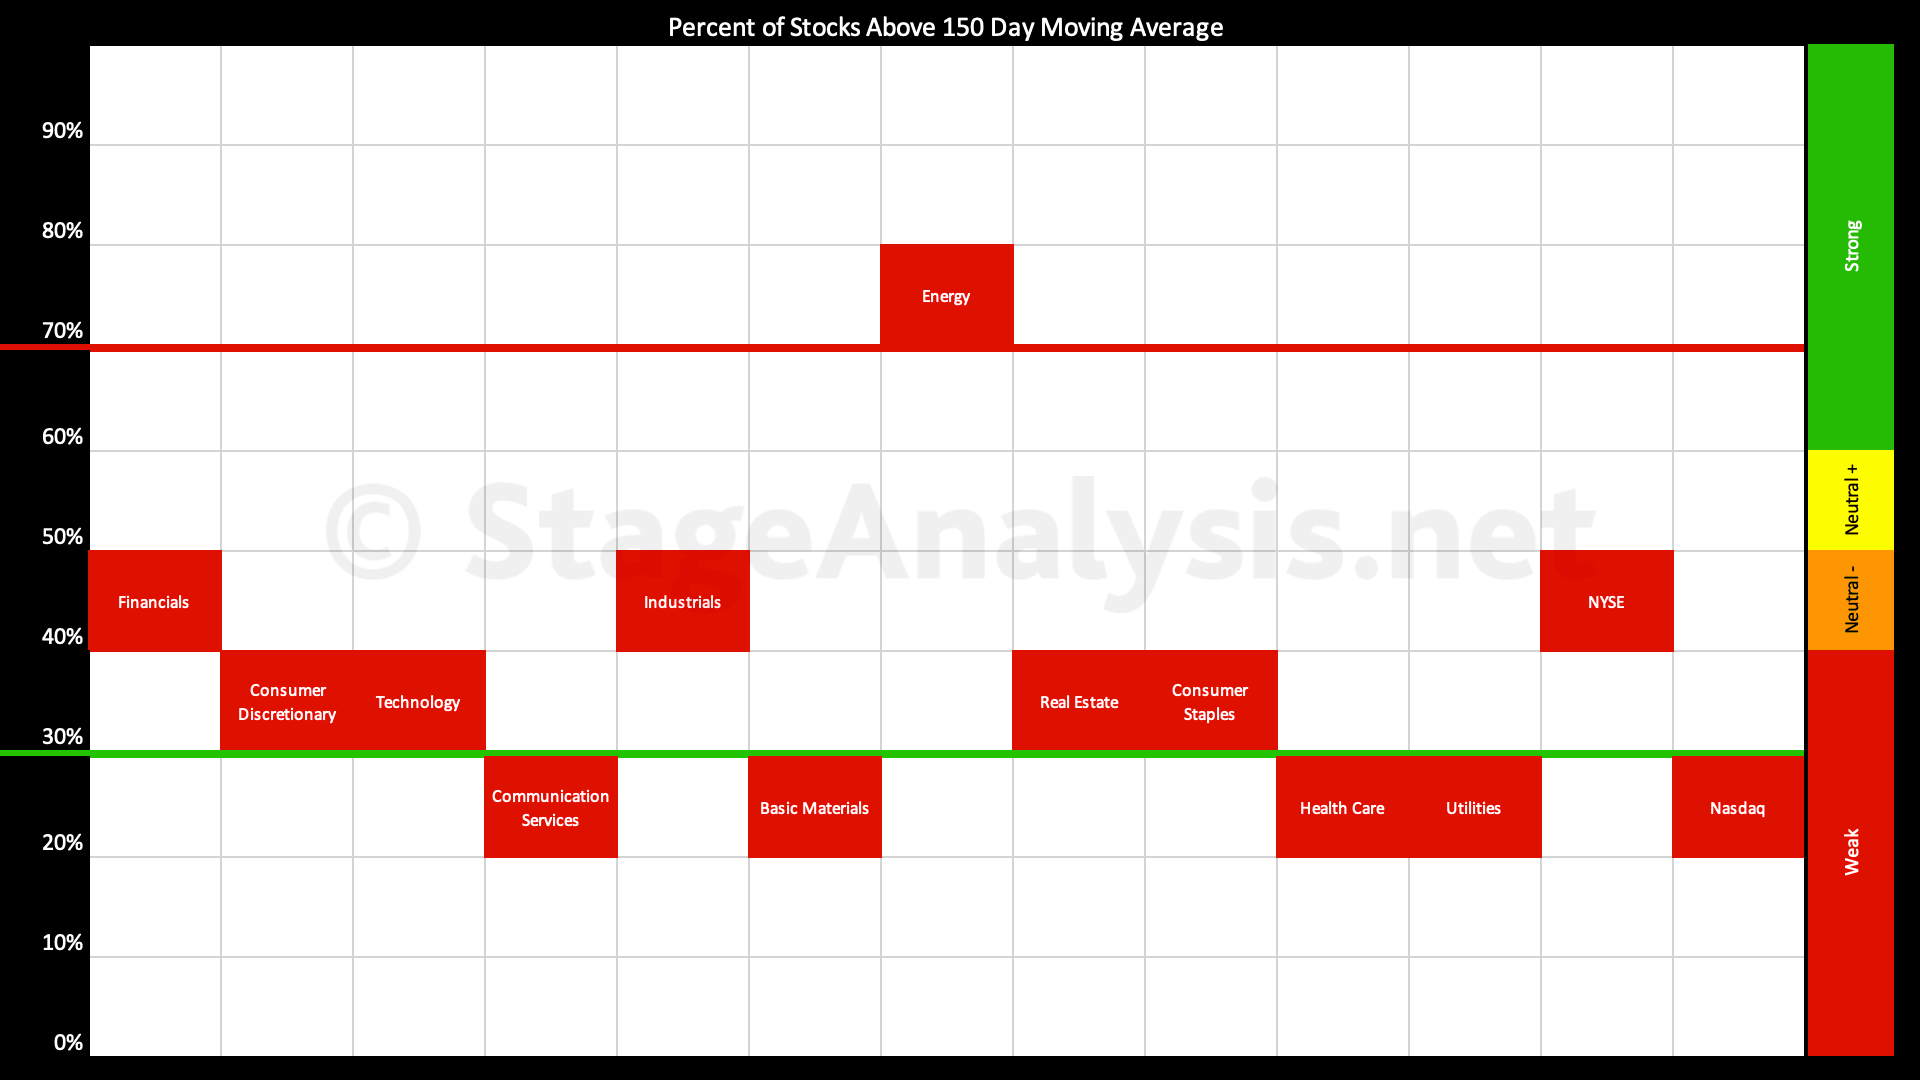
Sector Breadth: Percentage of US Stocks Above Their 150 day (30 Week) Moving Averages
The Percentage of US Stocks Above Their 150 day Moving Averages in the 11 major sectors declined a further -7.93% since the previous post on the 9th October 2023, dropping the overall average down to 24.53%, and so it is now heavily weighted in the Weak zone in the lower third of the field.
Read More
16 October, 2023
Stage Analysis Technical Attributes Scores – Nasdaq 100
The Stage Analysis Technical Attributes (SATA) score is our proprietary indicator that helps to identify the four stages from Stan Weinstein's Stage Analysis method, using a scoring system from 0 to 10 that rates ten of the key technical characteristics that we look for when analysing the weekly charts.
Read More
09 October, 2023
Sector Breadth: Percentage of US Stocks Above Their 150 day (30 Week) Moving Averages
The Percentage of US Stocks Above Their 150 day Moving Averages in the 11 major sectors declined a further -3.79% since the previous post on the 25th September 2023, taking the overall average down to 32.46%, and so has fallen further into the Weak zone in the lower third of the field...
Read More
02 October, 2023
Stage Analysis Technical Attributes Scores – Nasdaq 100
The Stage Analysis Technical Attributes (SATA) score is our proprietary indicator that helps to identify the four stages from Stan Weinstein's Stage Analysis method, using a scoring system from 0 to 10 that rates ten of the key technical characteristics that we look for when analysing the weekly charts.
Read More
25 September, 2023
Sector Breadth: Percentage of US Stocks Above Their 150 day (30 Week) Moving Averages
The Percentage of US Stocks Above Their 150 day Moving Averages in the 11 major sectors has continued to deteriorate over the last month, and has fallen a further -6.86% since the previous post...
Read More
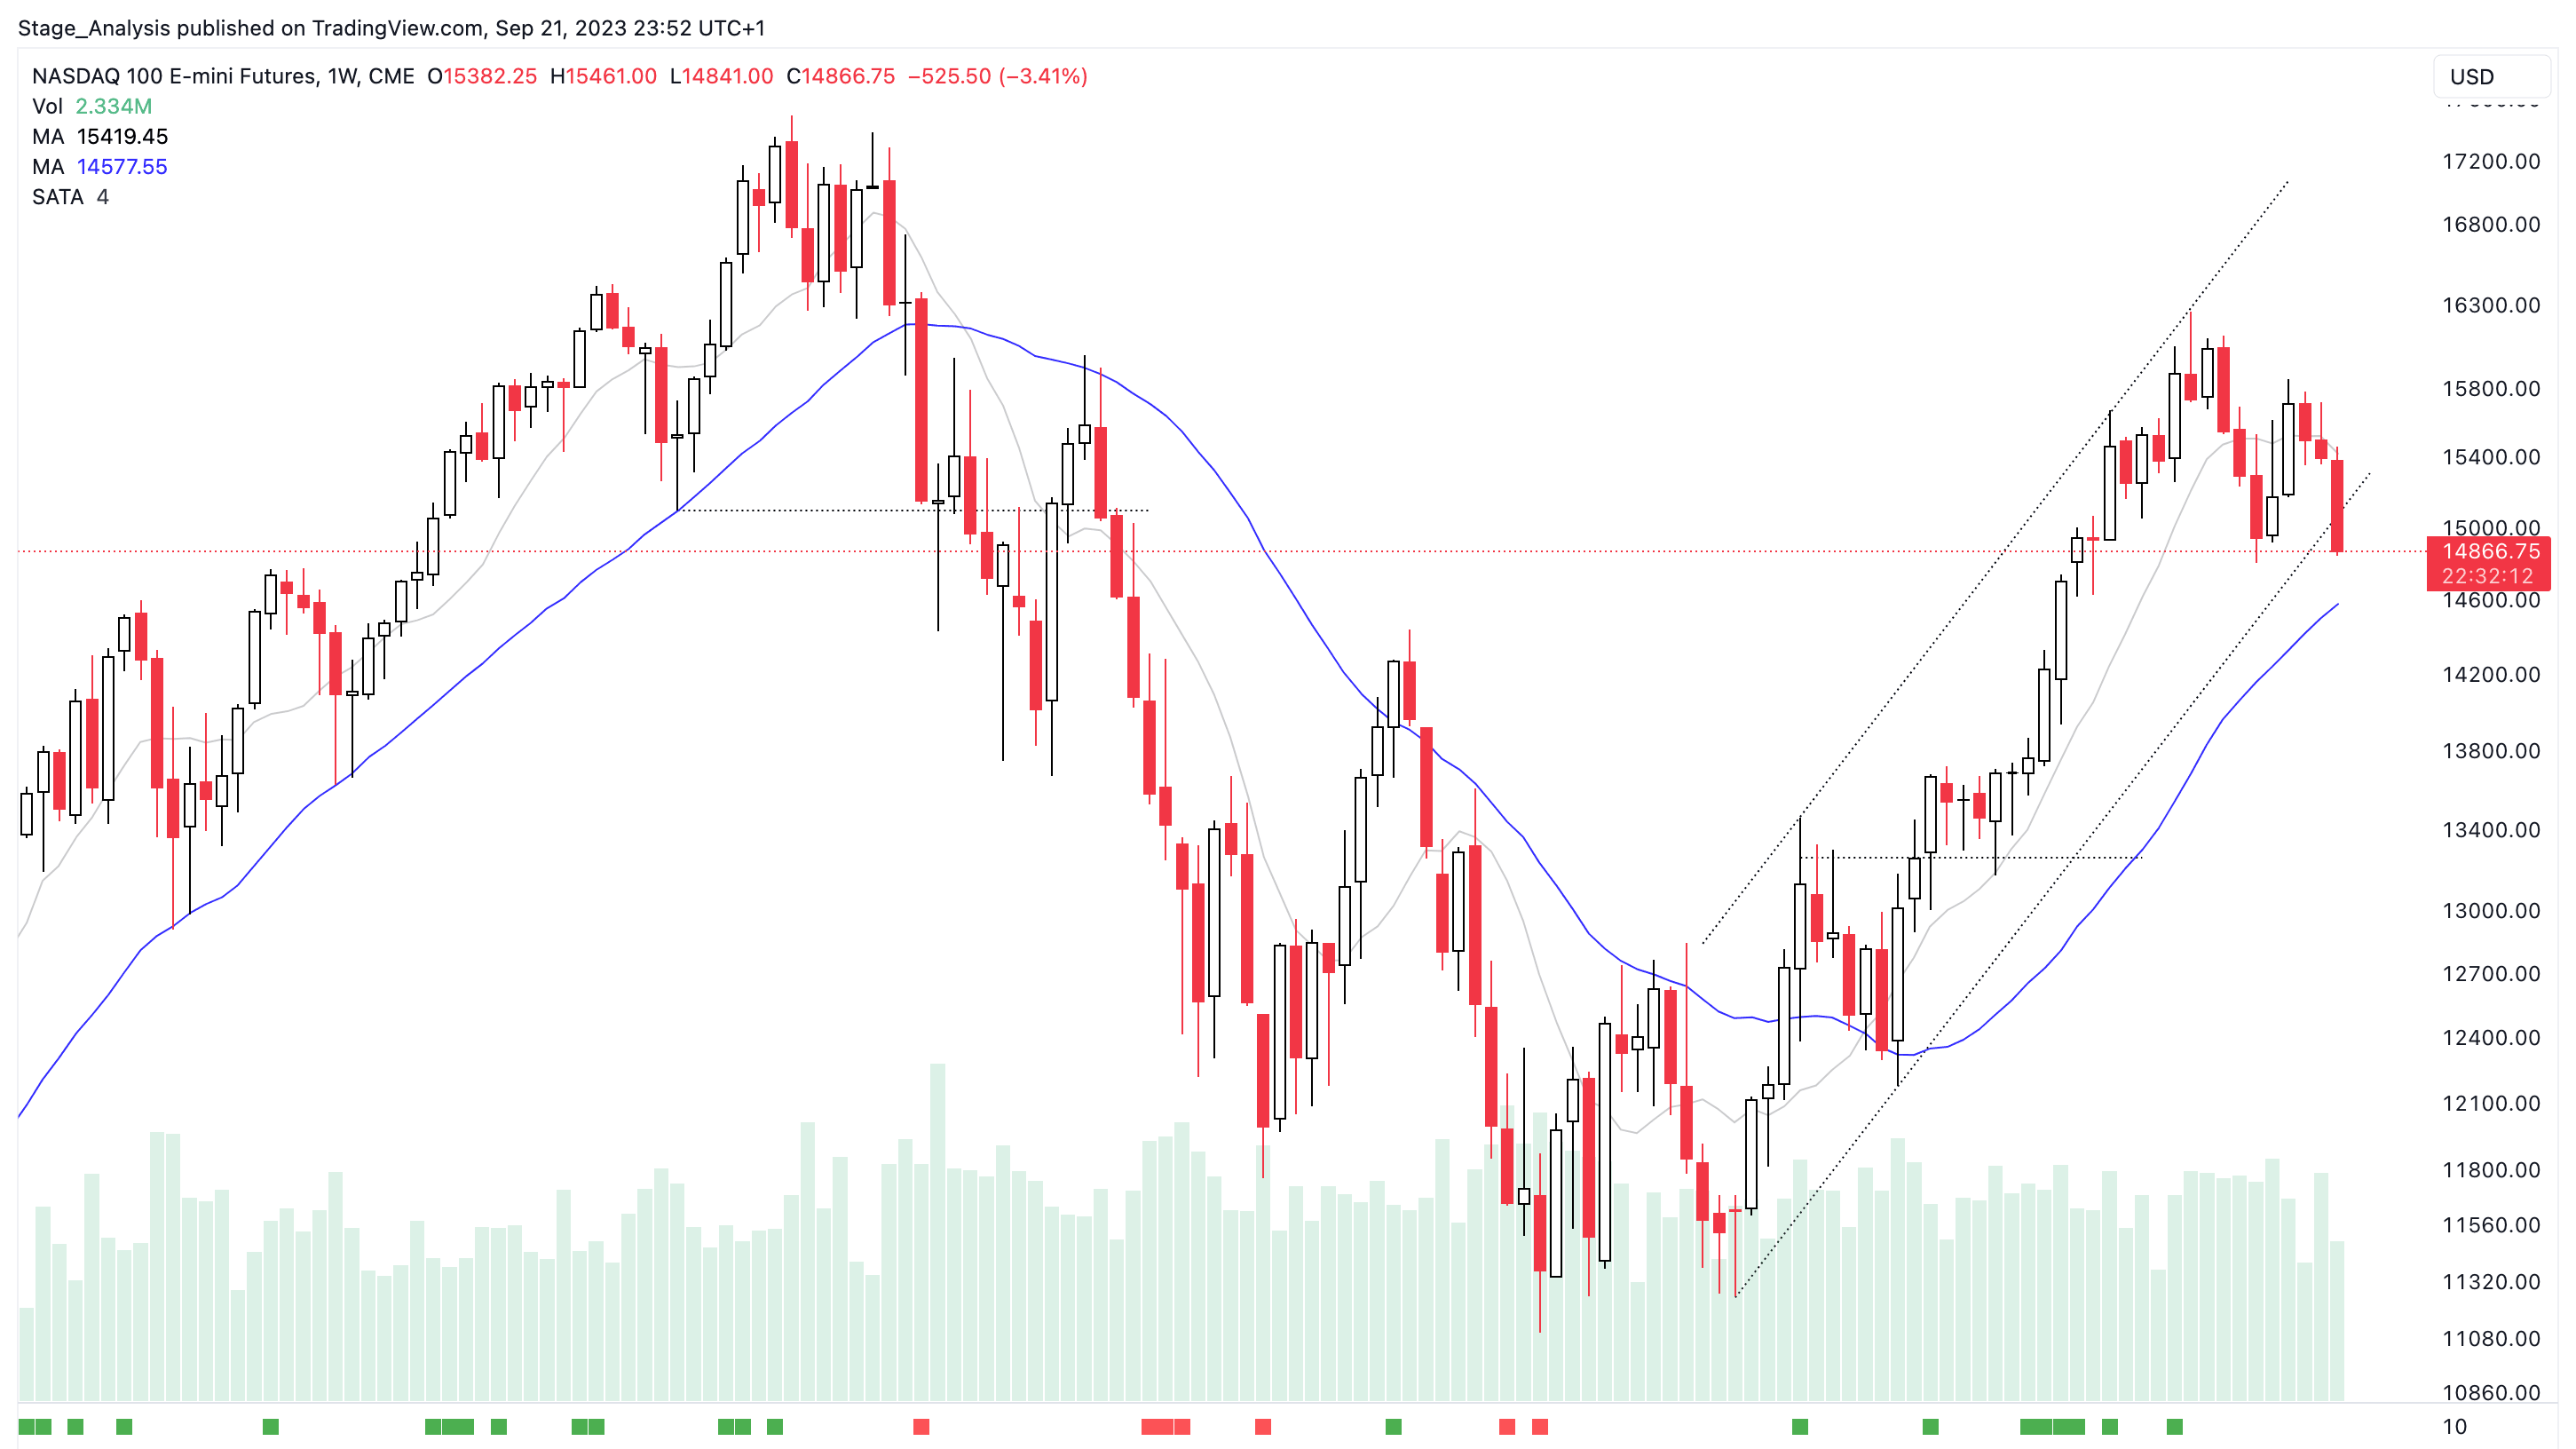
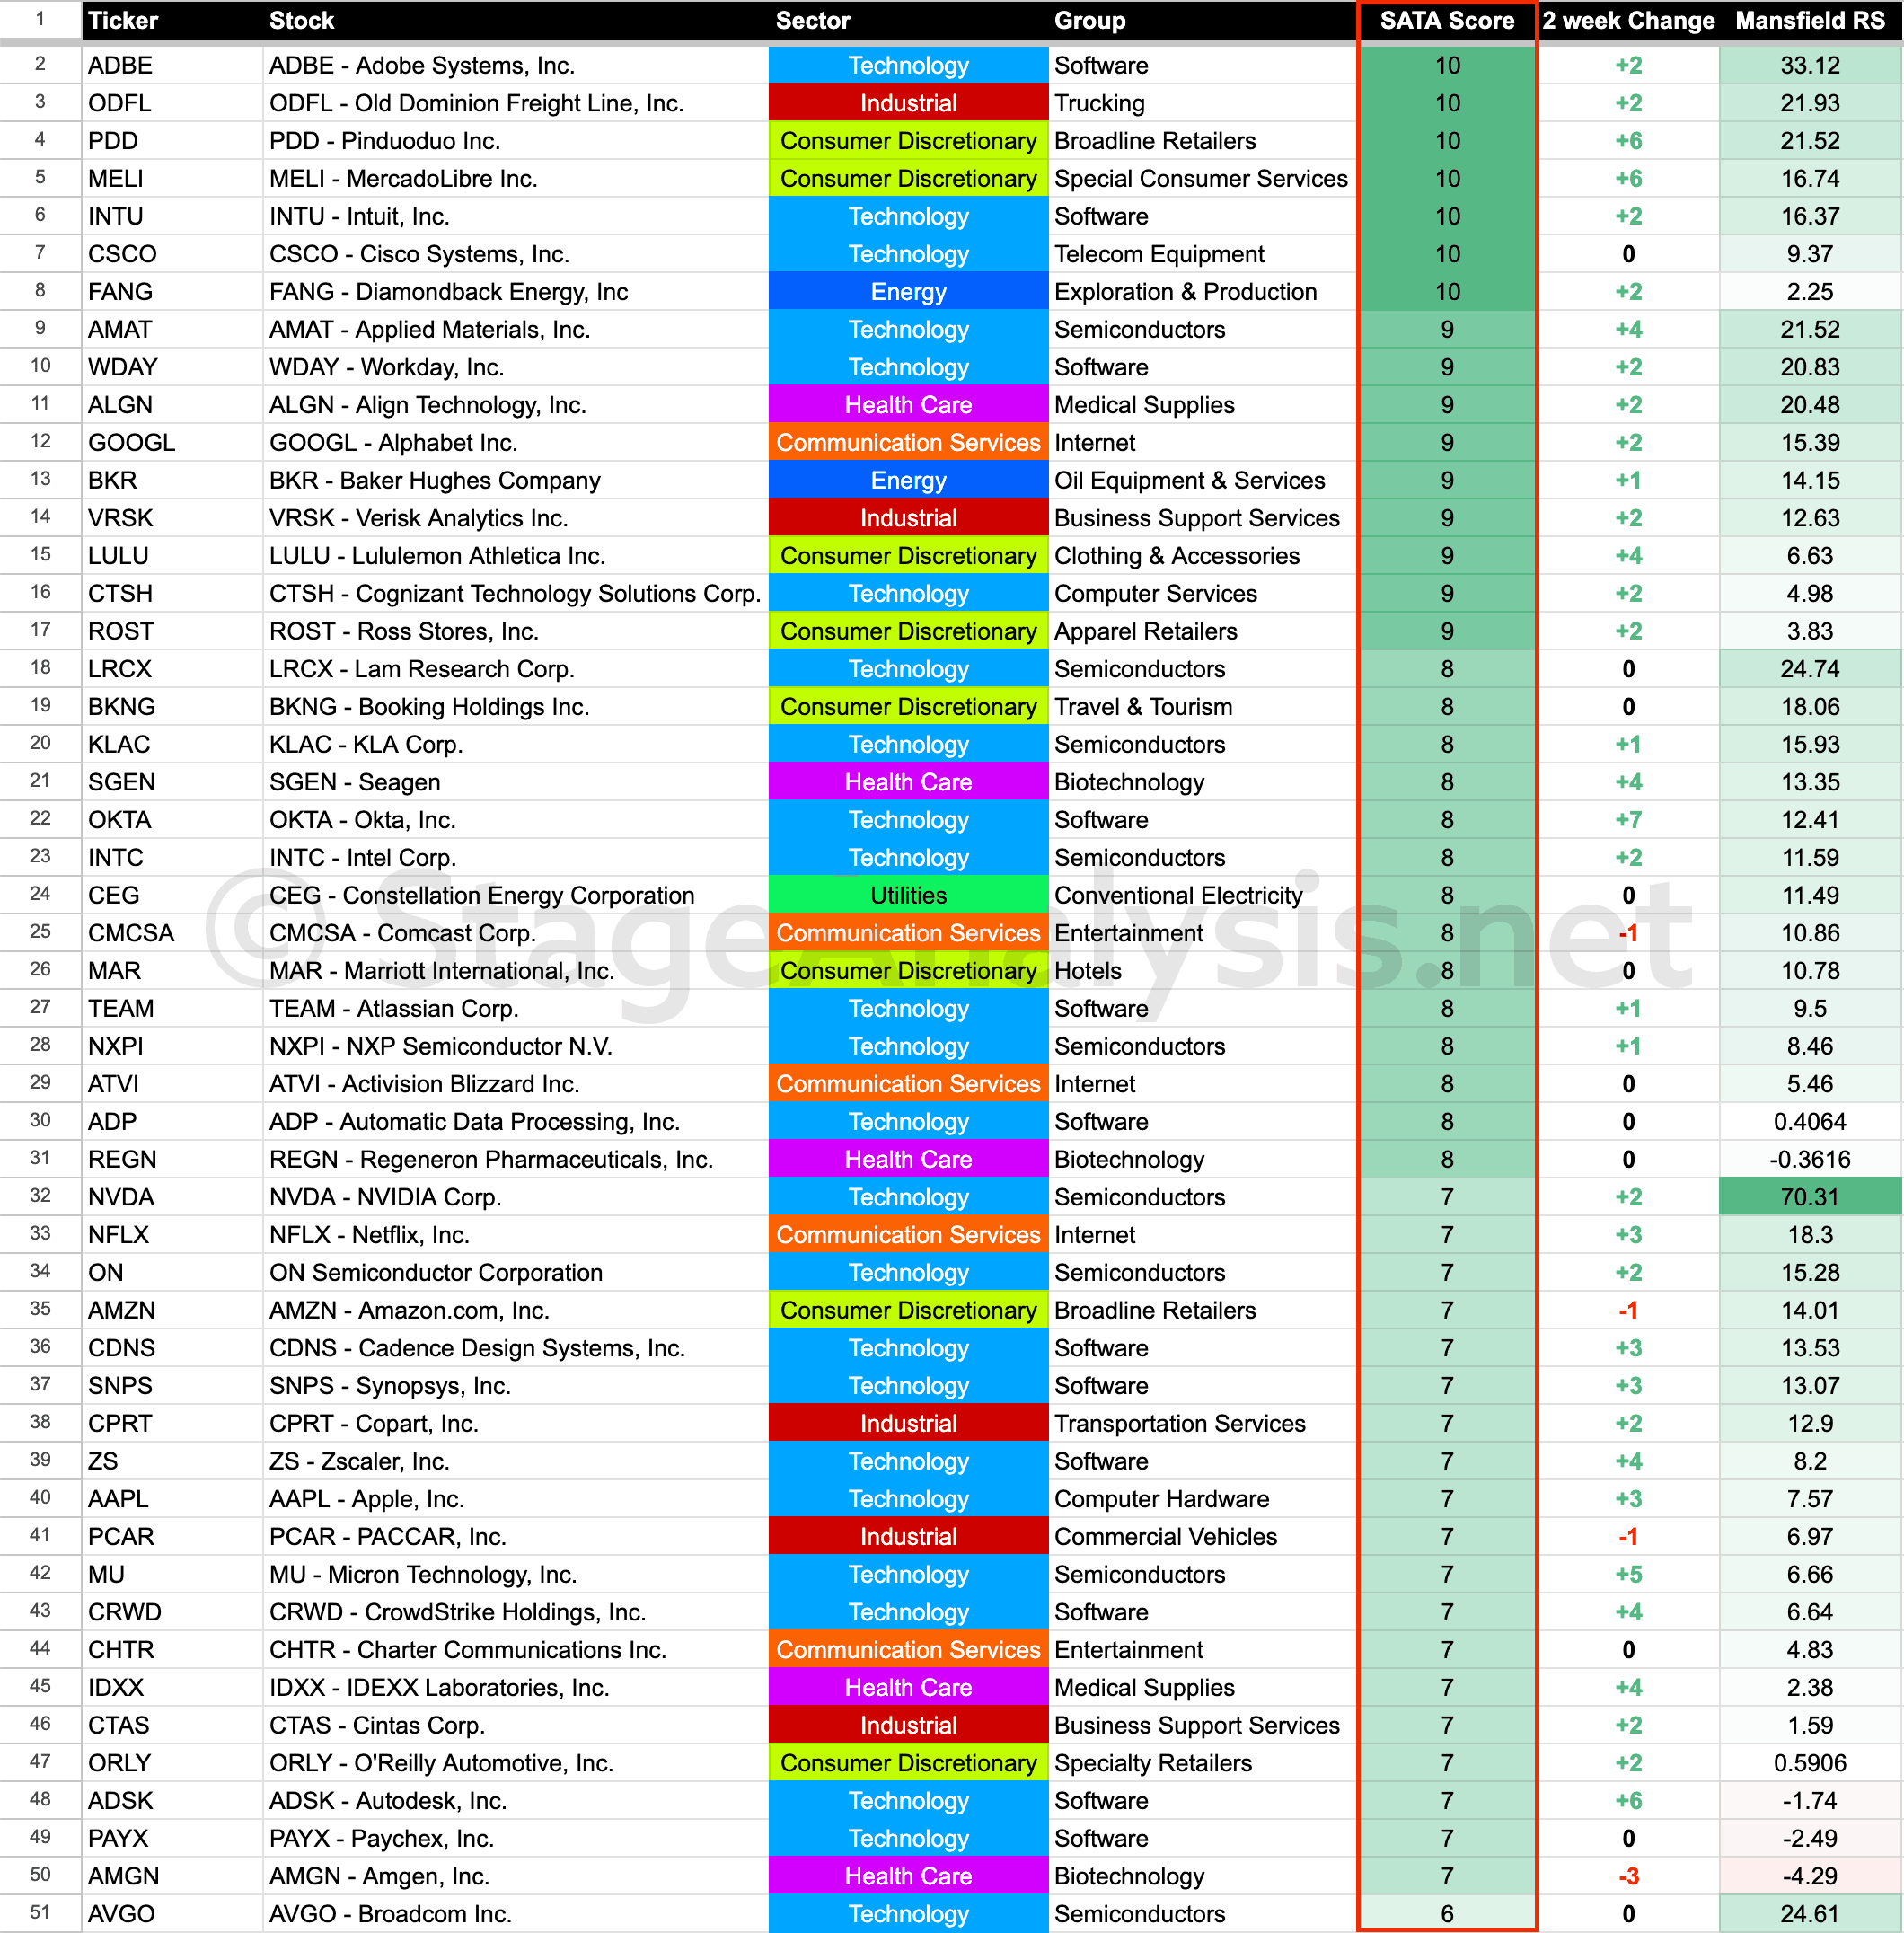
21 September, 2023
Stage Analysis Technical Attributes Scores – Nasdaq 100
The Stage Analysis Technical Attributes (SATA) score is our proprietary indicator that helps to identify the four stages from Stan Weinstein's Stage Analysis method, using a scoring system from 0 to 10 that rates ten of the key technical characteristics that we look for when analysing the weekly charts.
Read More
04 September, 2023
Stage Analysis Technical Attributes Scores – Nasdaq 100
The Stage Analysis Technical Attributes (SATA) score is our proprietary indicator that helps to identify the four stages from Stan Weinstein's Stage Analysis method, using a scoring system from 0 to 10 that rates ten of the key technical characteristics that we look for when analysing the weekly charts.
Read More