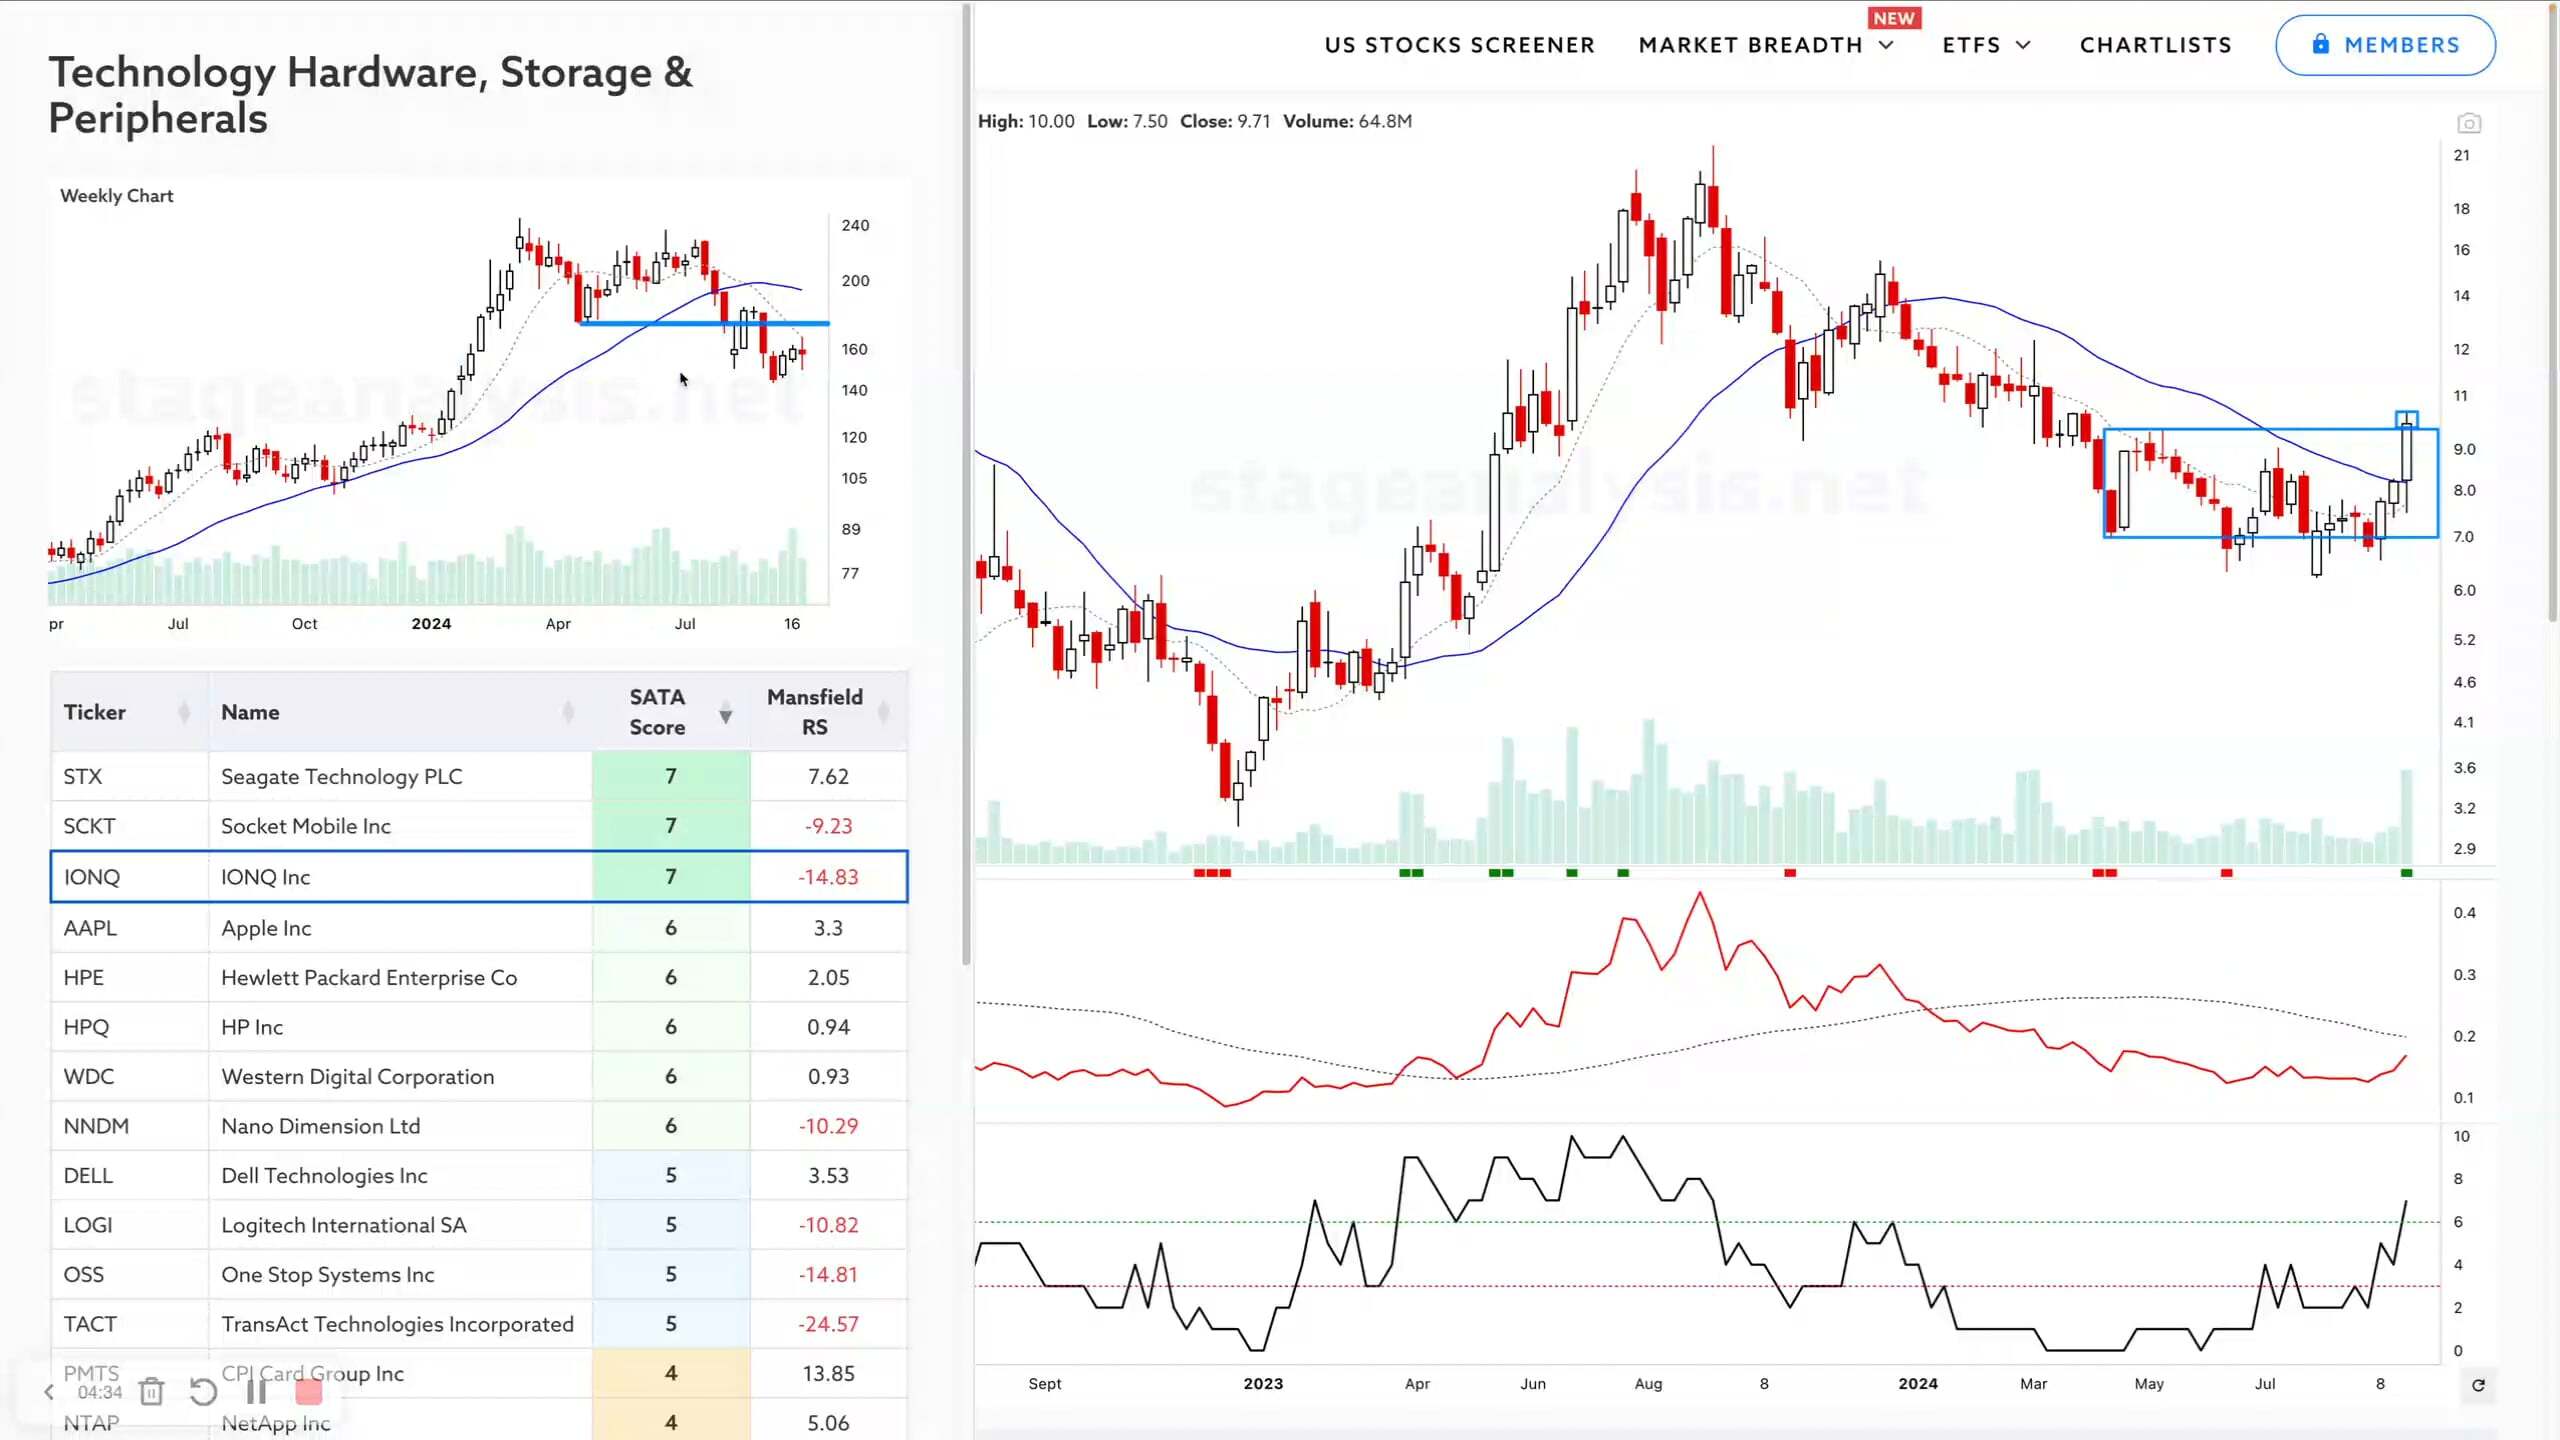
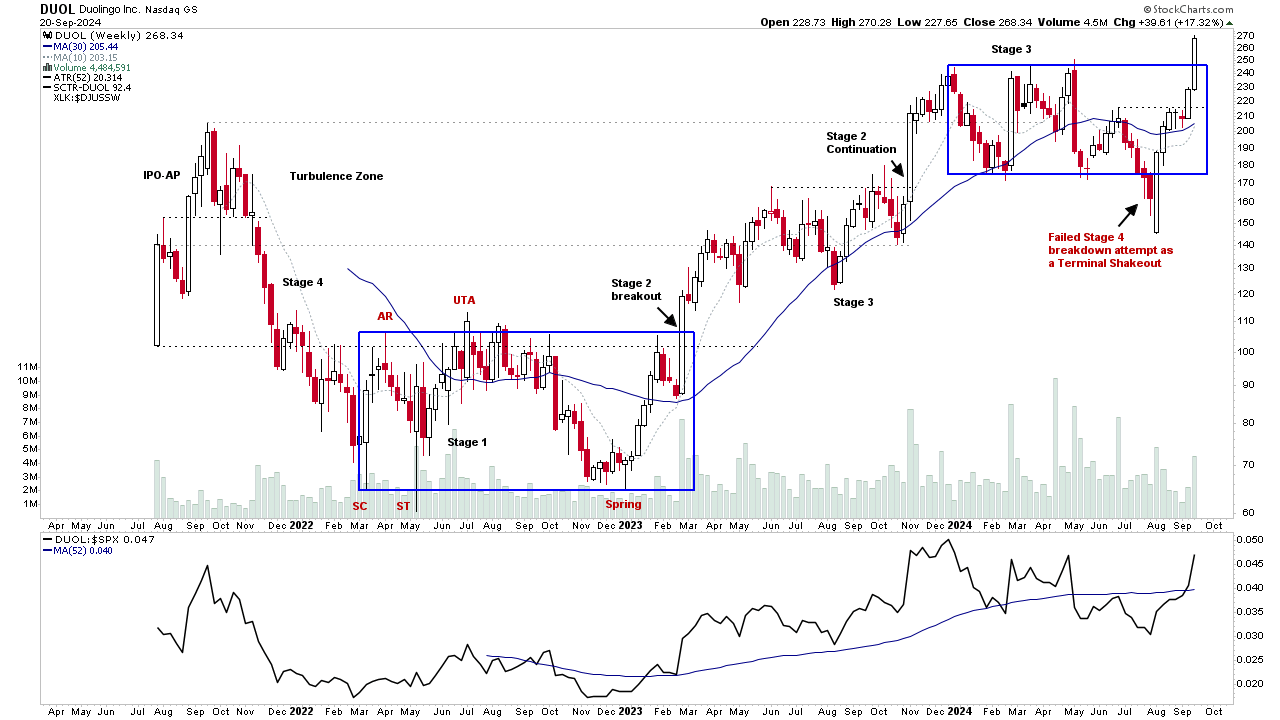
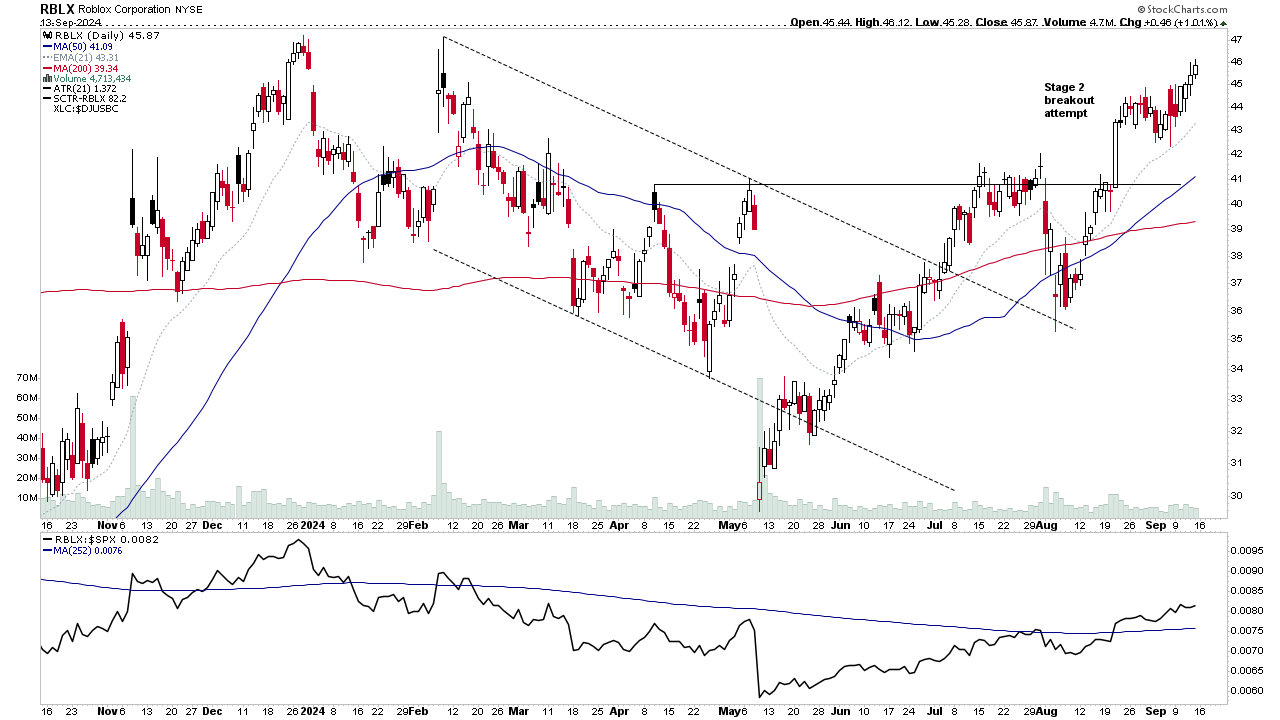
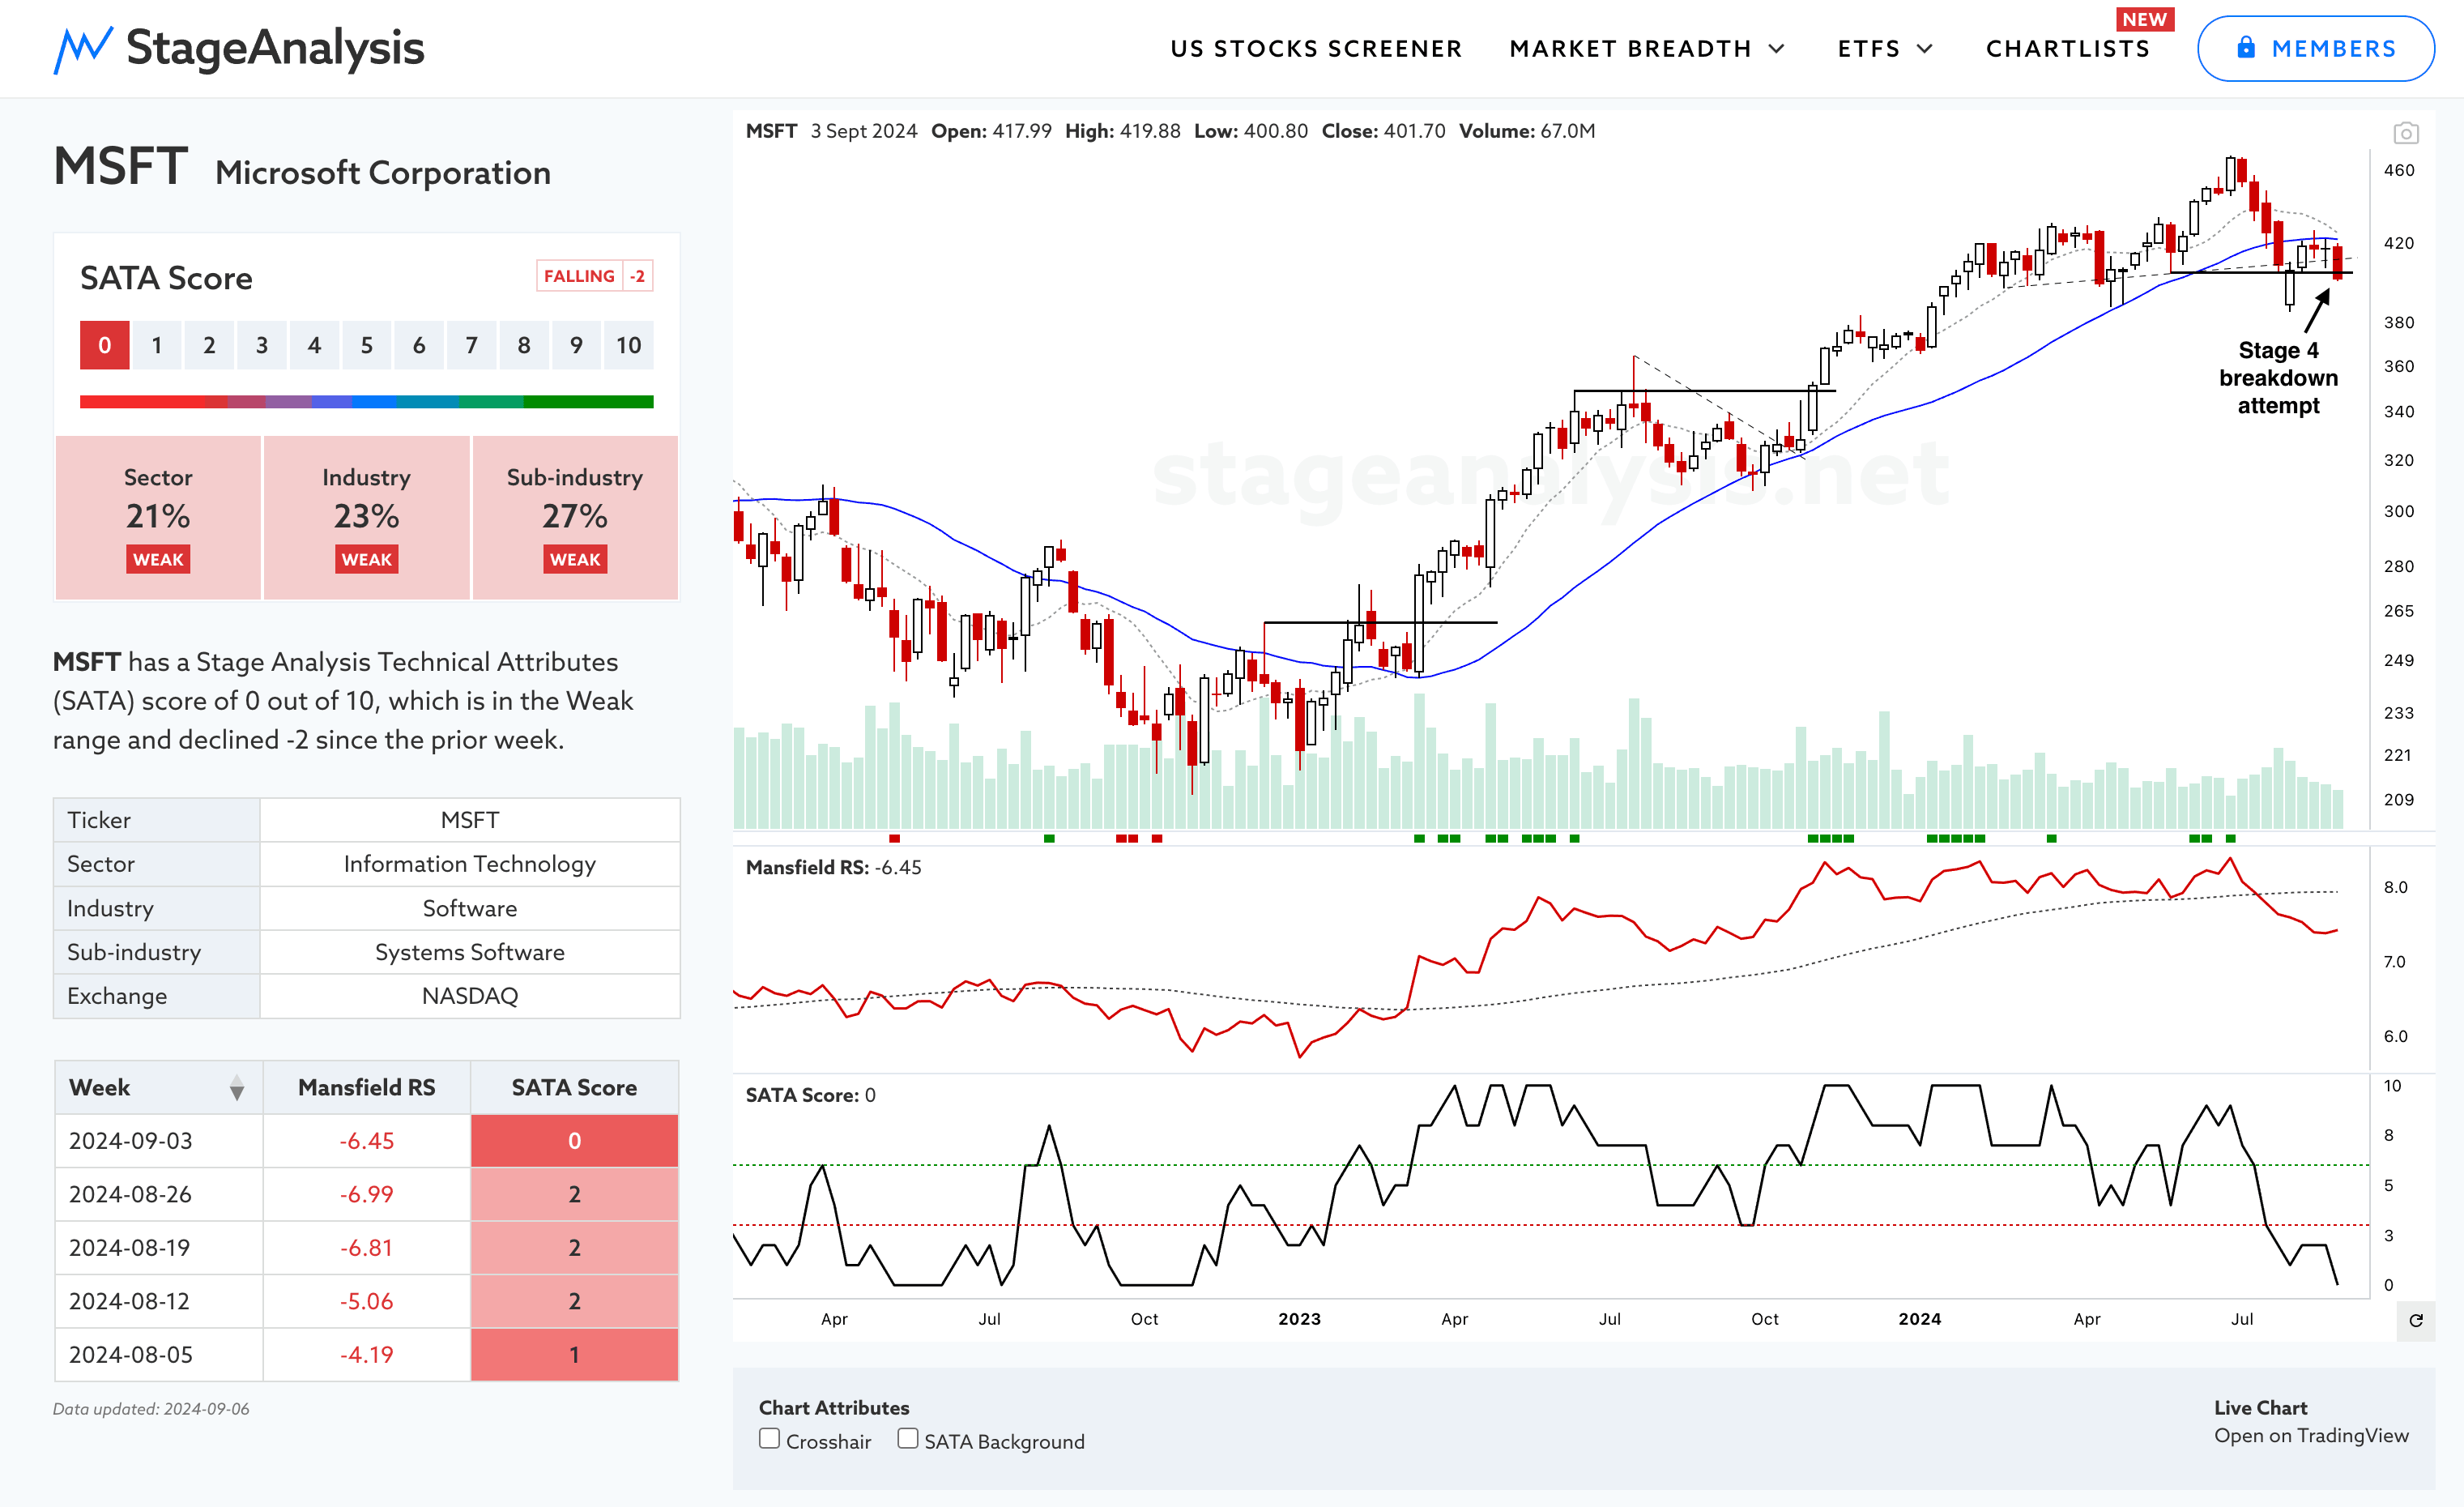
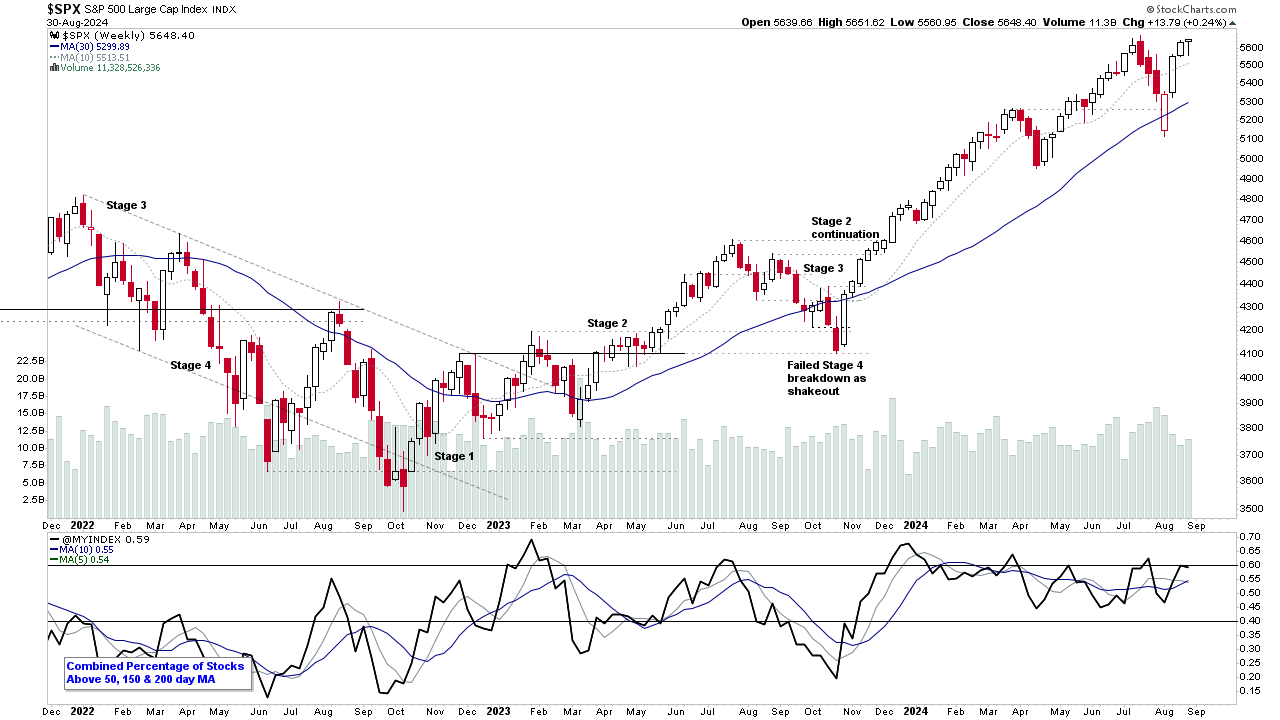
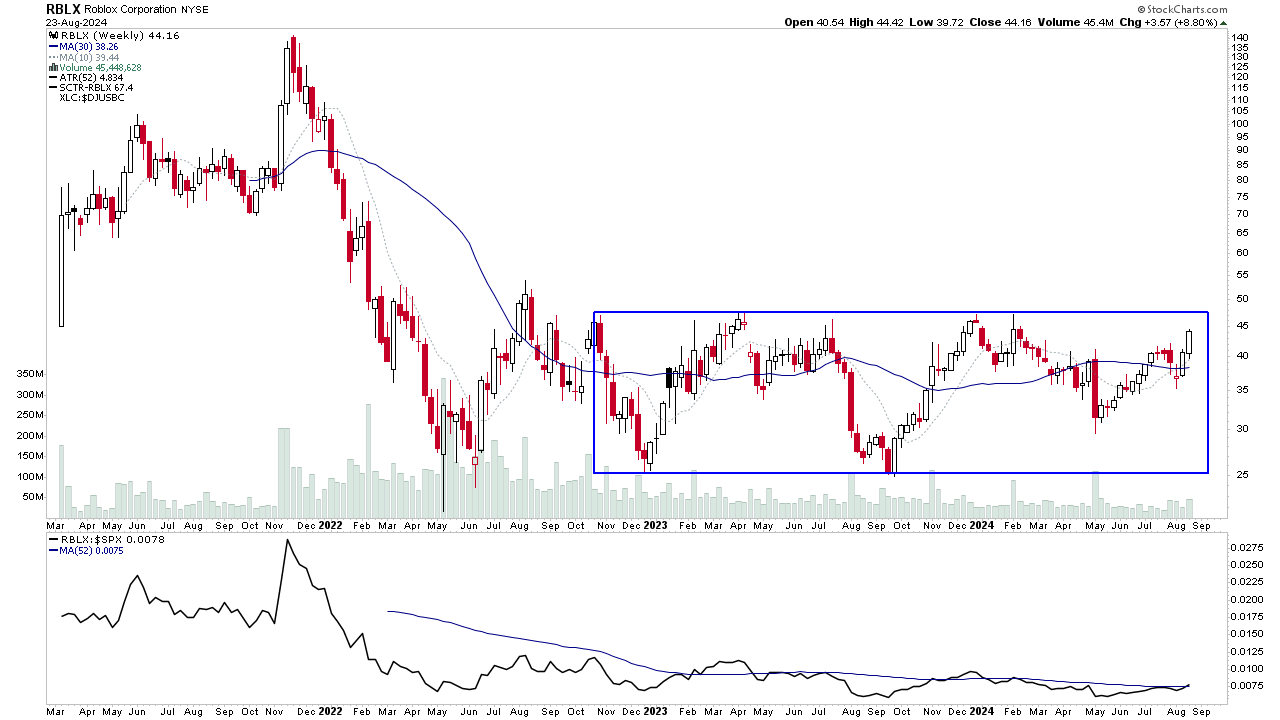
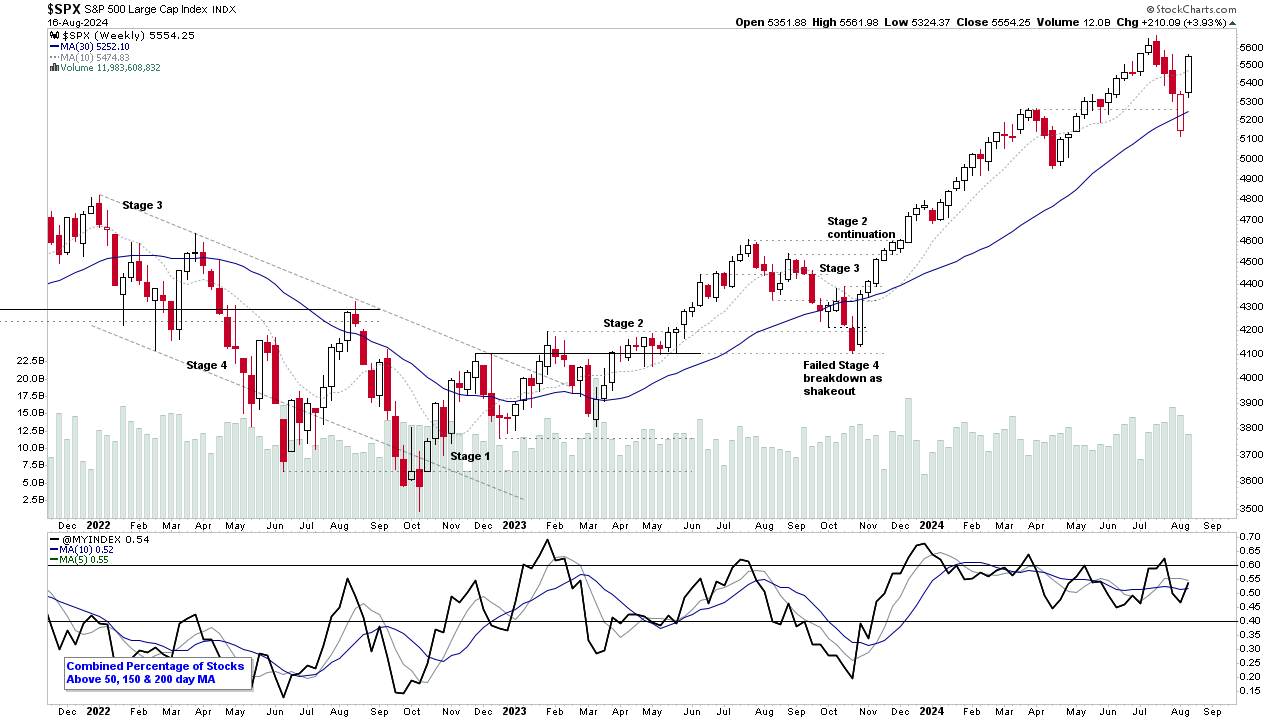
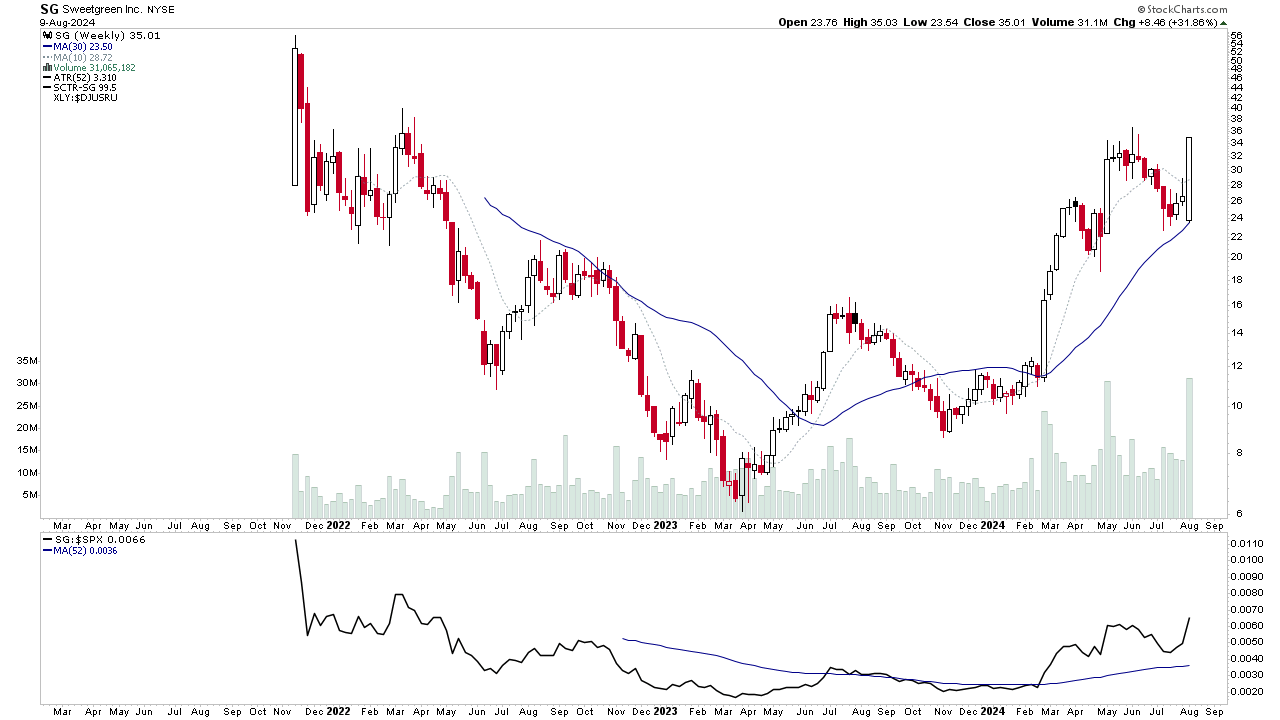
Sector, Group, Industry and Sub-Industry charts have been added to the Stage Analysis website this weekend. So first part of the weekend video discusses what they are and how to use them in detail. Followed by the weekend US watchlist stocks and the Major US Stock Market Indexes Update.
Read More
Blog
22 September, 2024
Stage Analysis Members Video – 22 September 2024 (48mins)
Stage Analysis members weekend video discussing of the US Watchlist Stocks in detail on multiple timeframes, the Significant Weekly Bars, the Sectors and Sub-industries Bell Curves and RS Rankings, the key Market Breadth Charts to determine the Weight of Evidence, and the Major US Stock Market Indexes Update.
Read More
15 September, 2024
Stage Analysis Members Video – 15 September 2024 (54mins)
Stage Analysis members weekend video begins this week with a discussion of the US Watchlist Stocks in detail on multiple timeframes, the Significant Weekly Bars, the Sectors and Sub-industries Bell Curves and RS Rankings, the key Market Breadth Charts to determine the Weight of Evidence, and the Major US Stock Market Indexes Update.
Read More
08 September, 2024
Stage Analysis Members Video – 8 September 2024 (54mins)
Stage Analysis members weekend video discussing the US Watchlist Stocks in detail on multiple timeframes, the Significant Weekly Bars, the Sectors and Sub-industries Bell Curves and RS Rankings, the key Market Breadth Charts to determine the Weight of Evidence, Bitcoin & Ethereum and the Major US Stock Market Indexes Update.
Read More
01 September, 2024
Stage Analysis Members Video – 1 September 2024 (46mins)
Stage Analysis members weekend video starting with a discussion of the new User Chartlists feature and how to use it, followed by the US Watchlist Stocks in detail on multiple timeframes, the Significant Weekly Bars, the Sectors and Sub-industries Bell Curves, the key Market Breadth Charts to determine the Weight of Evidence and the Major US Stock Market Indexes Update.
Read More
25 August, 2024
Stage Analysis Members Video – 25 August 2024 (1hr 3mins)
Stage Analysis members weekend video with a discussion of the Significant Weekly Bars, new features discussion, the Sectors and Sub-industries Bell Curves, the US Watchlist Stocks in detail on multiple timeframes, the key Market Breadth Charts to determine the Weight of Evidence and the Major US Stock Market Indexes Update.
Read More
18 August, 2024
Stage Analysis Members Video – 18 August 2024 (48mins)
Stage Analysis members weekend video starting with a discussion of the Significant Weekly Bars, the US Watchlist Stocks in detail on multiple timeframes, the Sectors and Sub-industries Bell Curves, the key Market Breadth Charts to determine the Weight of Evidence and the Major US Stock Market Indexes Update.
Read More
11 August, 2024
Stage Analysis Members Video – 11 August 2024 (58mins)
Stage Analysis members weekend video starting with a discussion of the Significant Weekly Bars, the Major US Stock Market Indexes, the Sectors and Sub-industries Bell Curves, the key Market Breadth Charts to determine the Weight of Evidence and the US Watchlist Stocks in detail on multiple timeframes
Read More
05 August, 2024
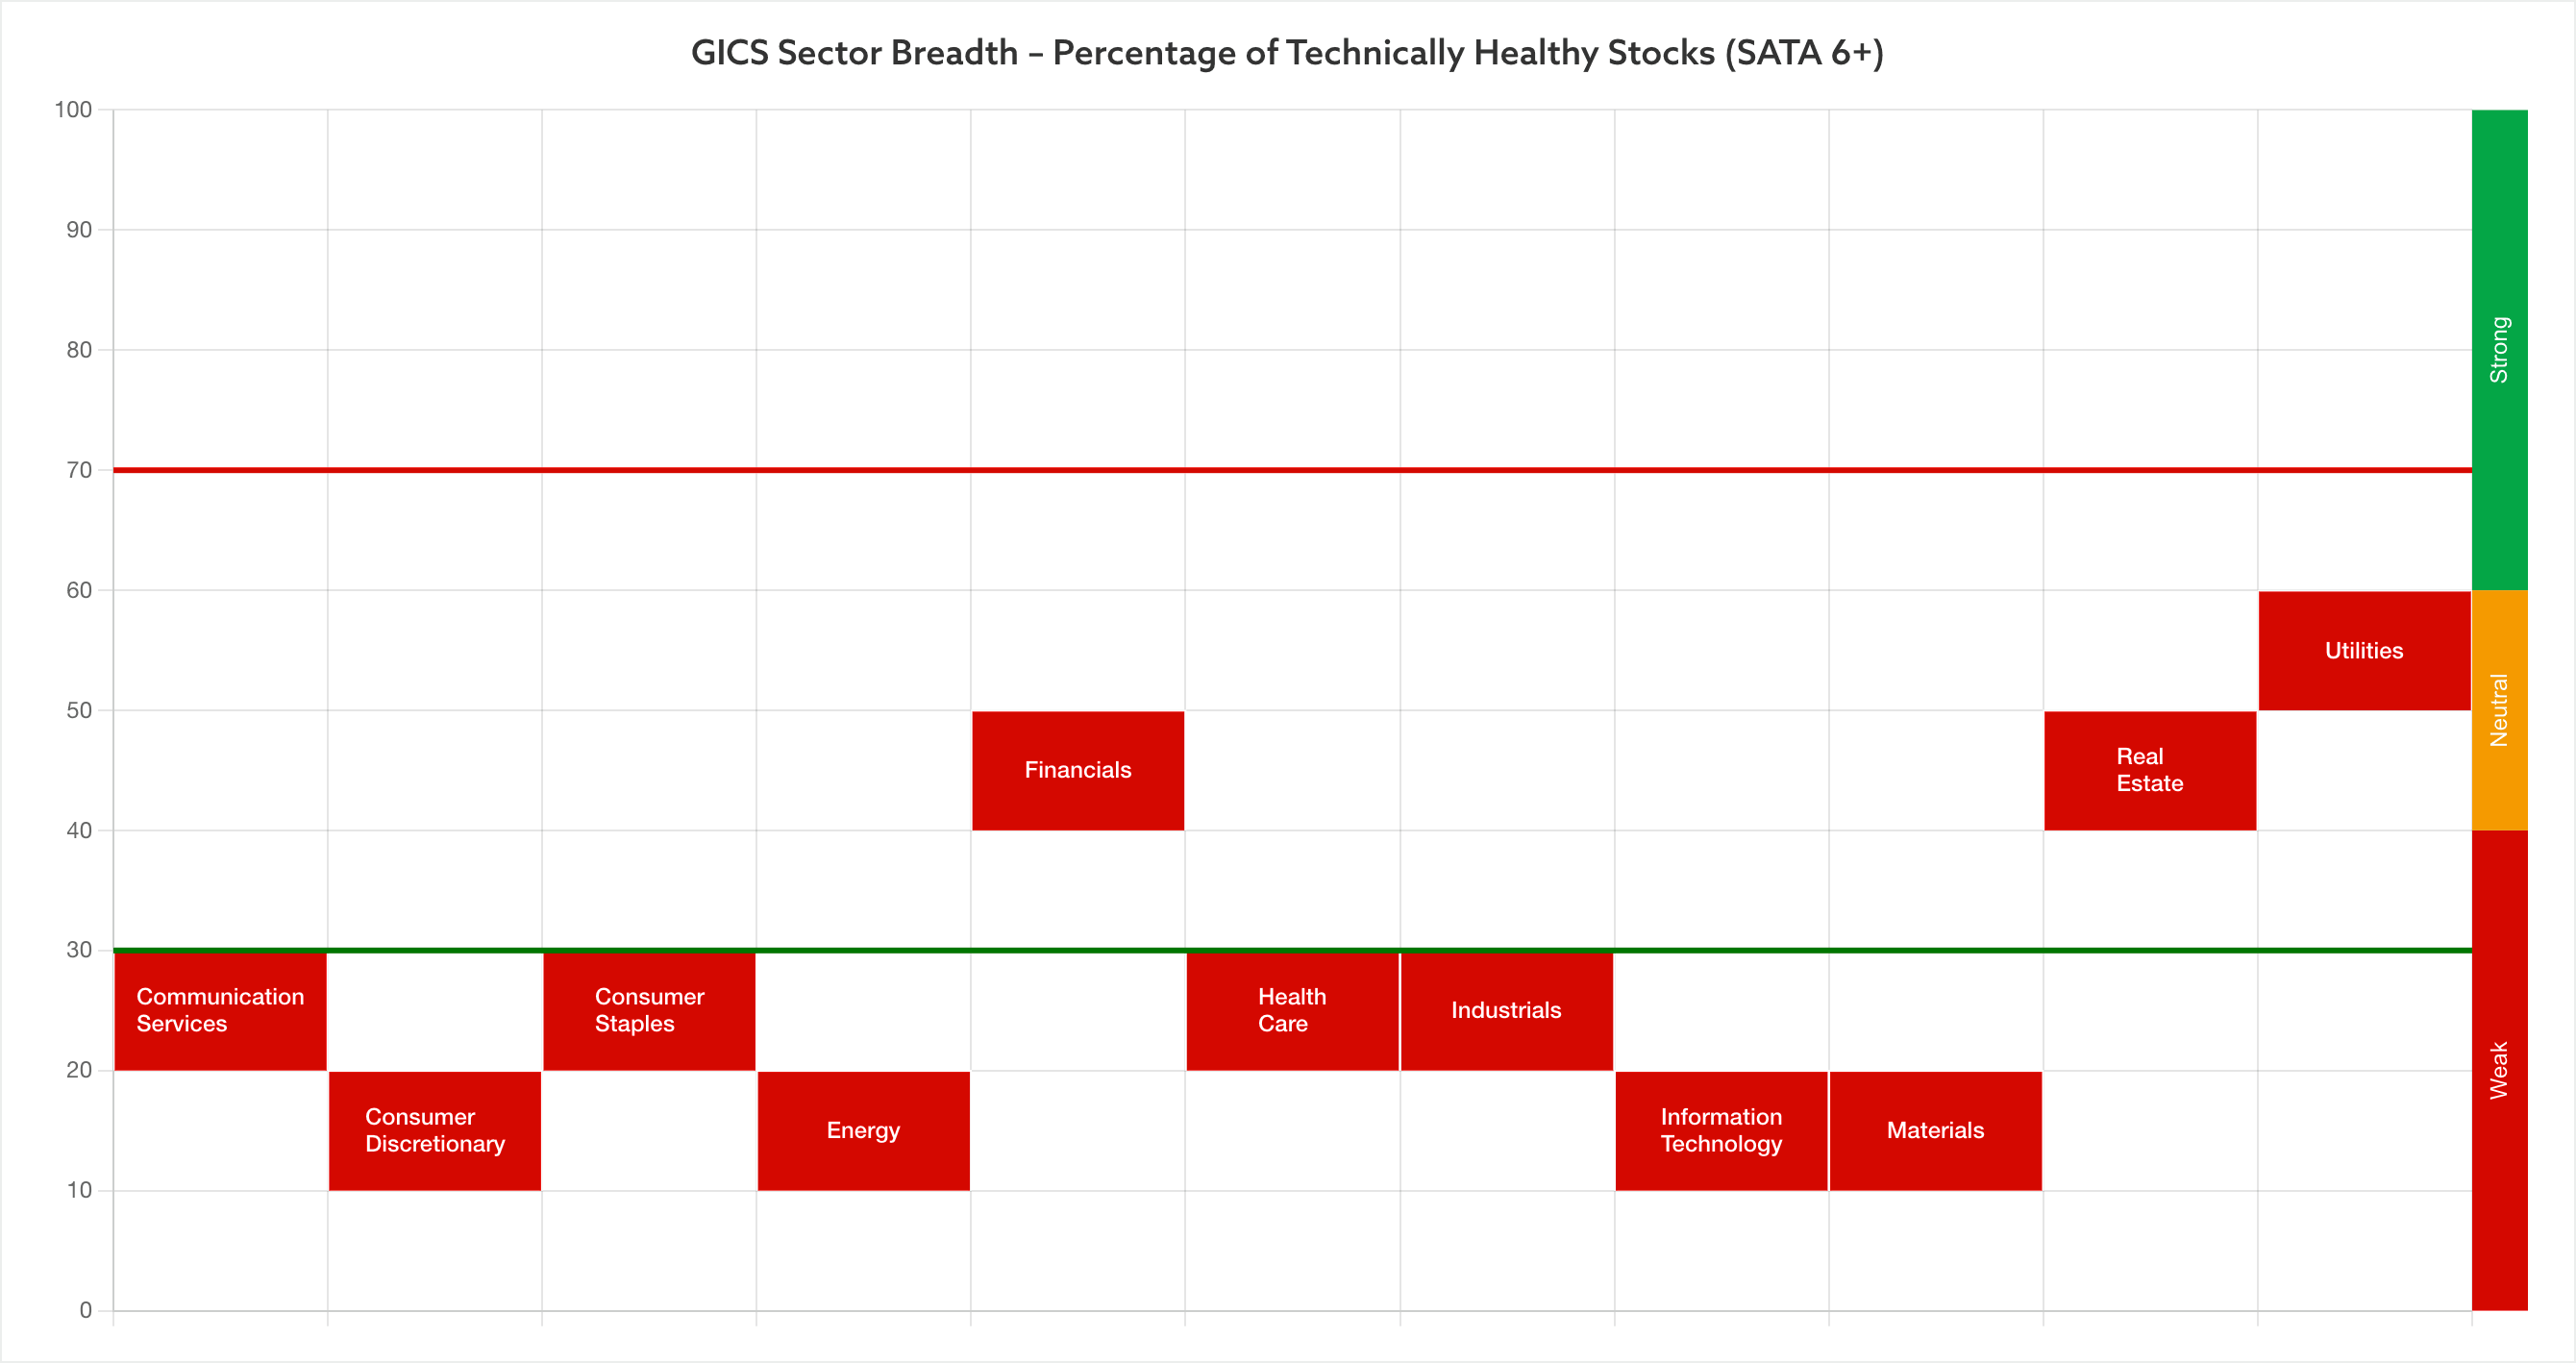
Sector Breadth: Percentage of Technically Healthy Stocks
The sector breadth has seen a steep drop over the past few weeks from overall neutral levels to weak levels. With numerous stocks collapsing into Stage 3 and Stage 4 declines...
Read More
04 August, 2024
Stage Analysis Members Video – 4 August 2024 (45mins)
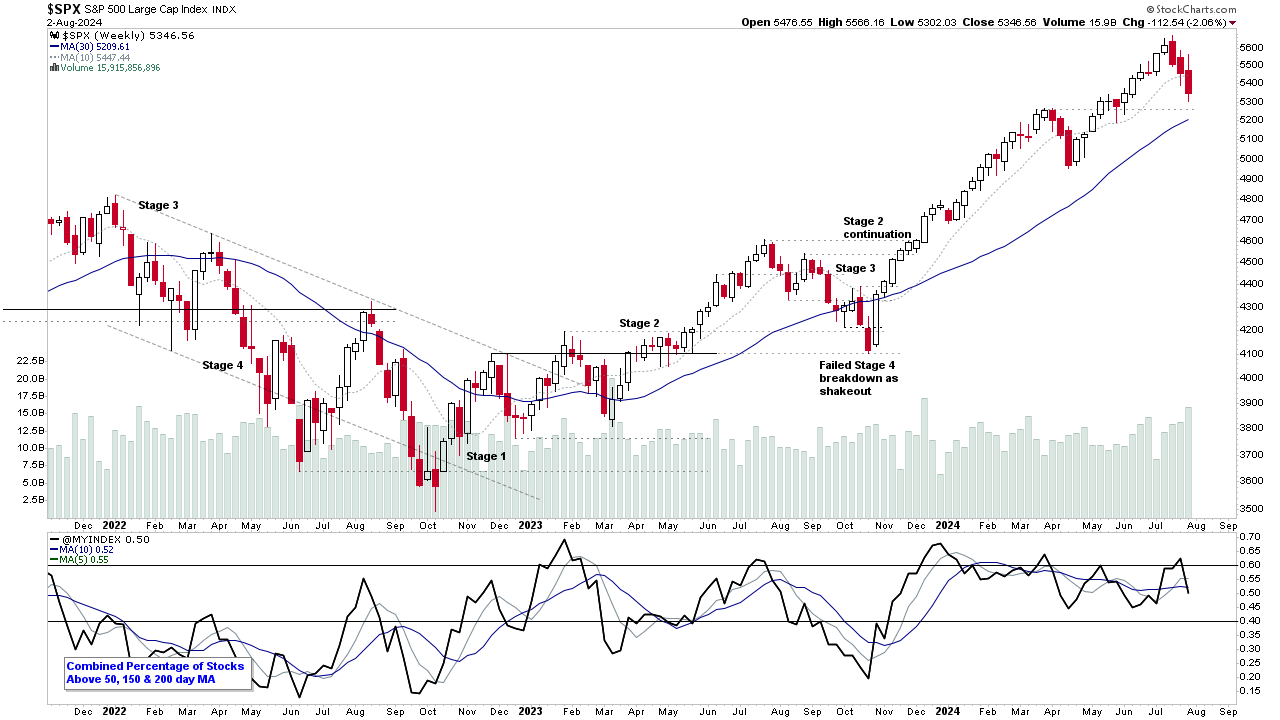
Stage Analysis members weekend video starting with a discussion about the Stage 4 breakdown attempt in Ethereum. Followed by the Major US Stock Market Indexes, the Sector Breadth and Sub-industry Bell Curve, the key Market Breadth Charts to determine the Weight of Evidence and a look at some of the stocks with upcoming earnings this coming week.
Read More

