Brief video highlighting some of the new features added this week to the Stage Analysis website for the members to use...
Read More

Blog
08 April, 2024
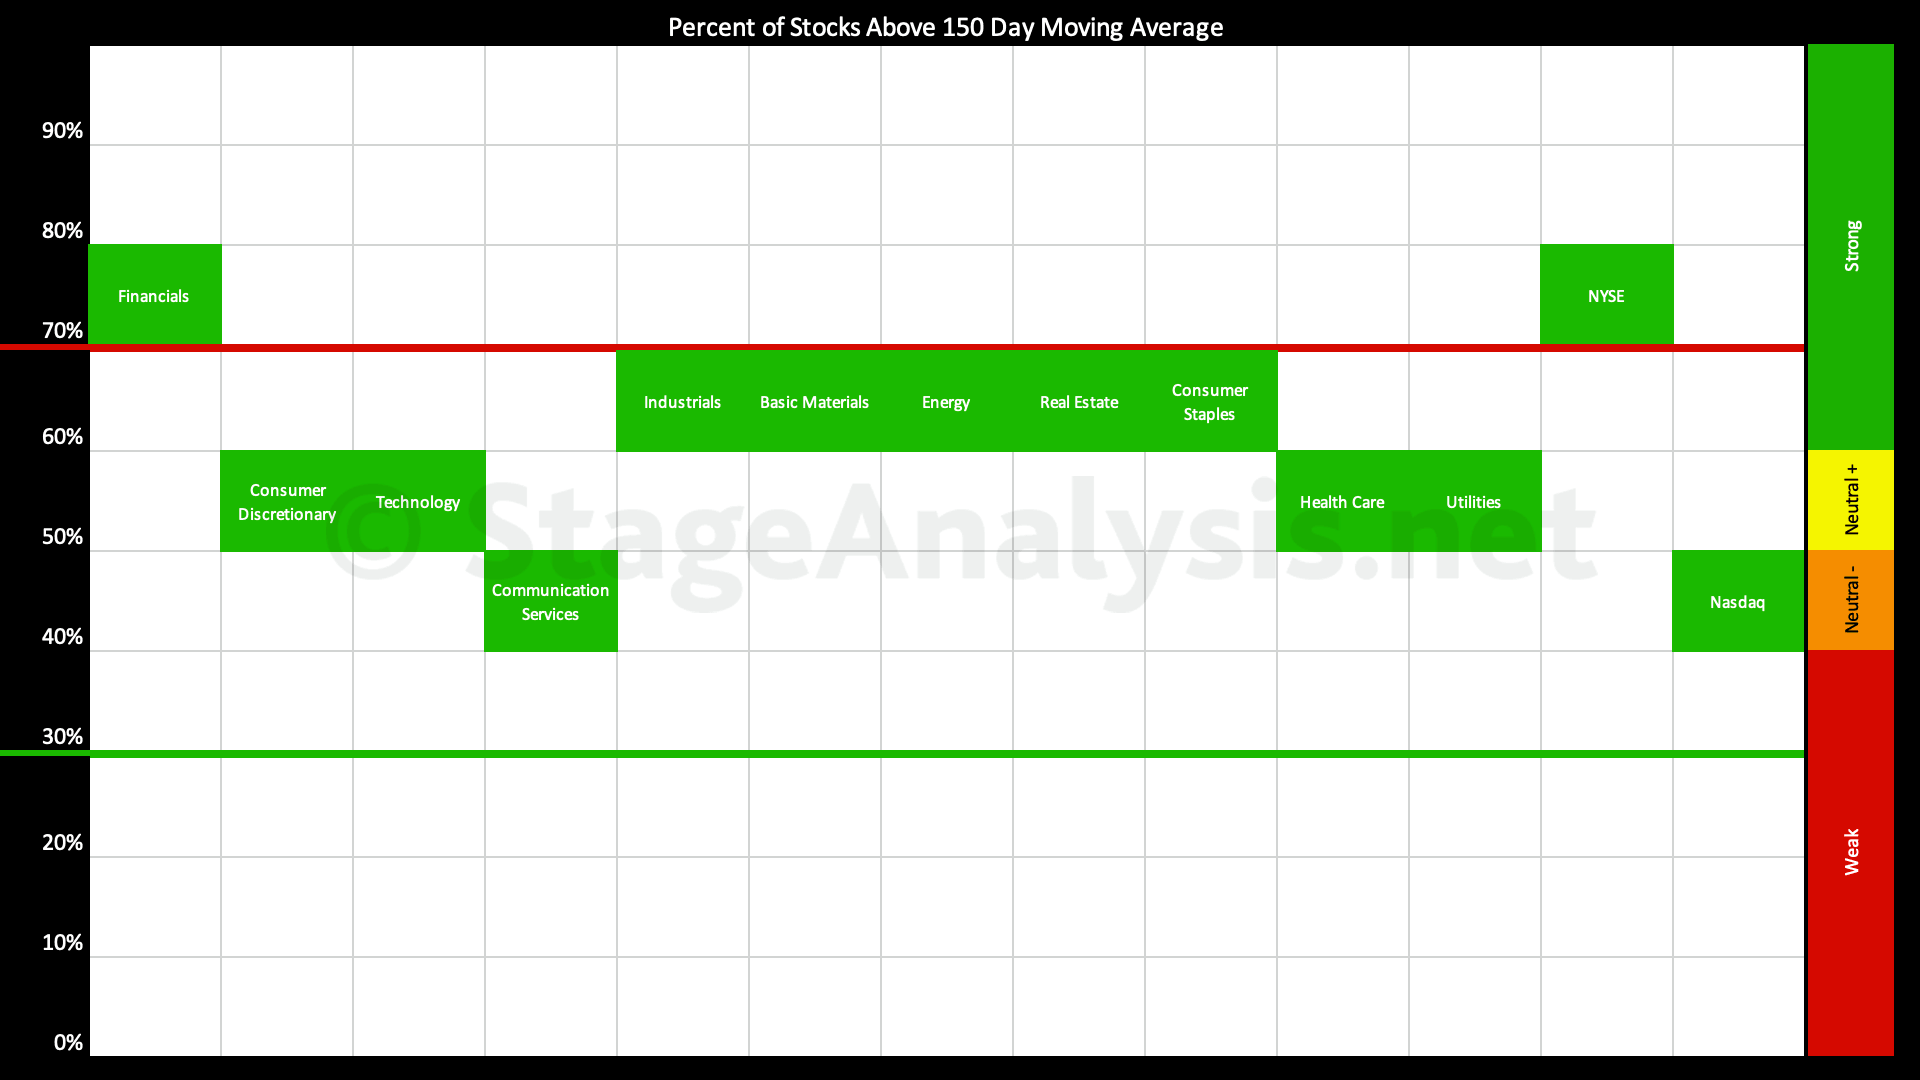
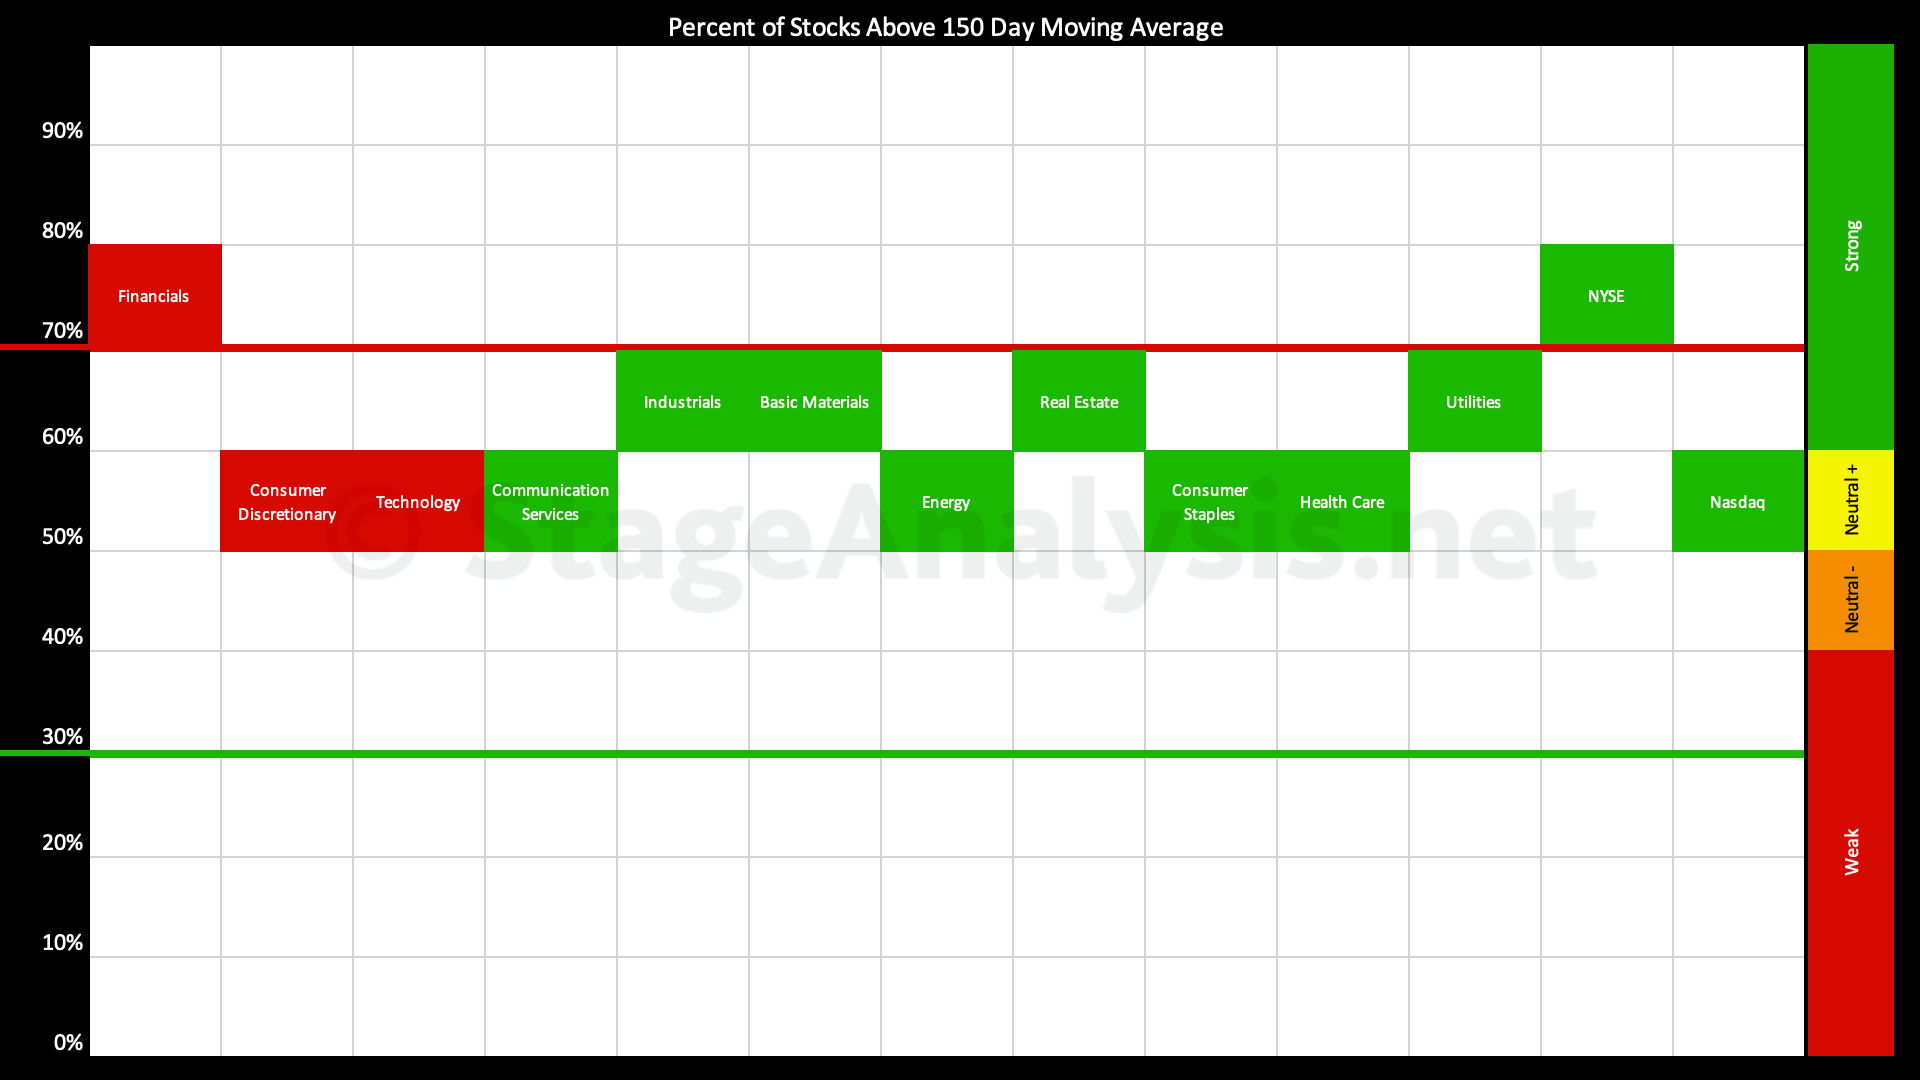
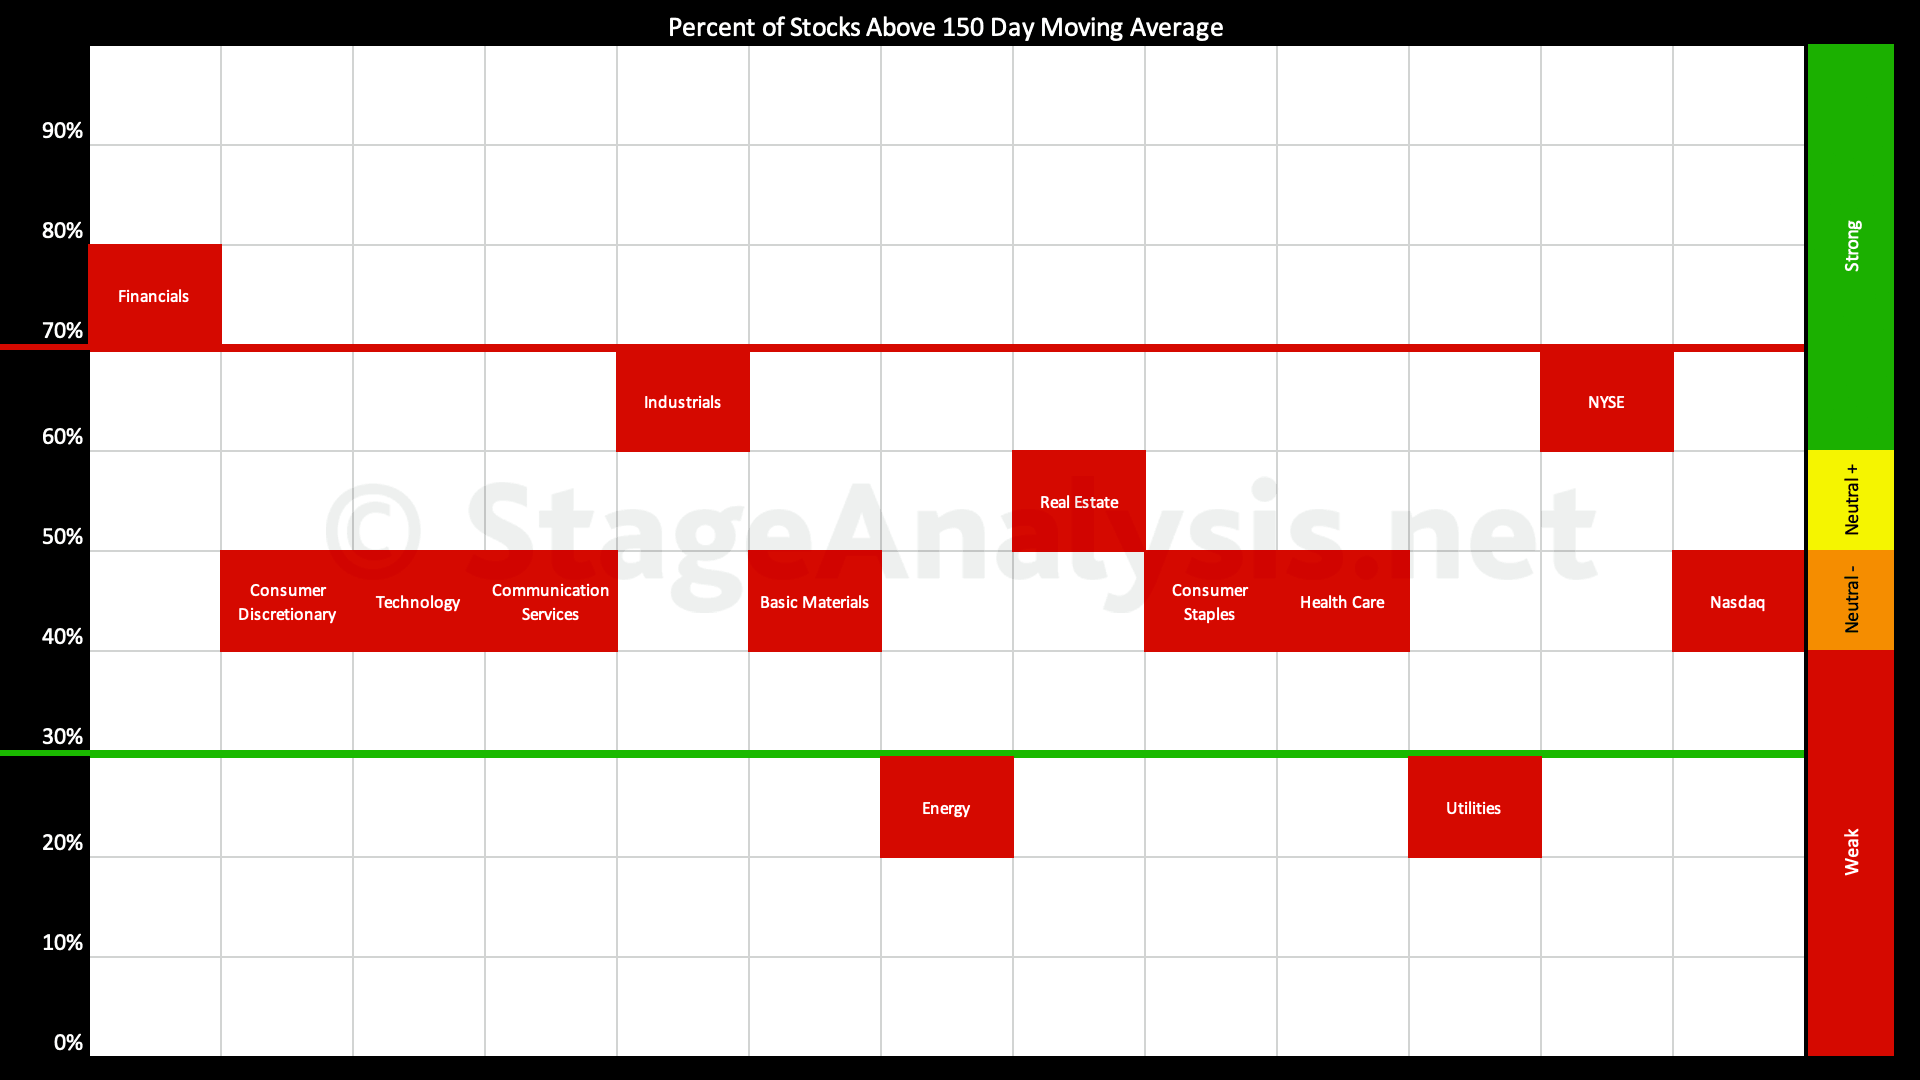
Sector Breadth: Percentage of US Stocks Above Their 150 day (30 Week) Moving Averages
The percentage of US stocks above their 150 day moving averages in the 11 major sectors increased by +3.08% since the previous post, moving the overall average to 63.10%, which is the Strong zone (60%+ range).
Read More
27 March, 2024
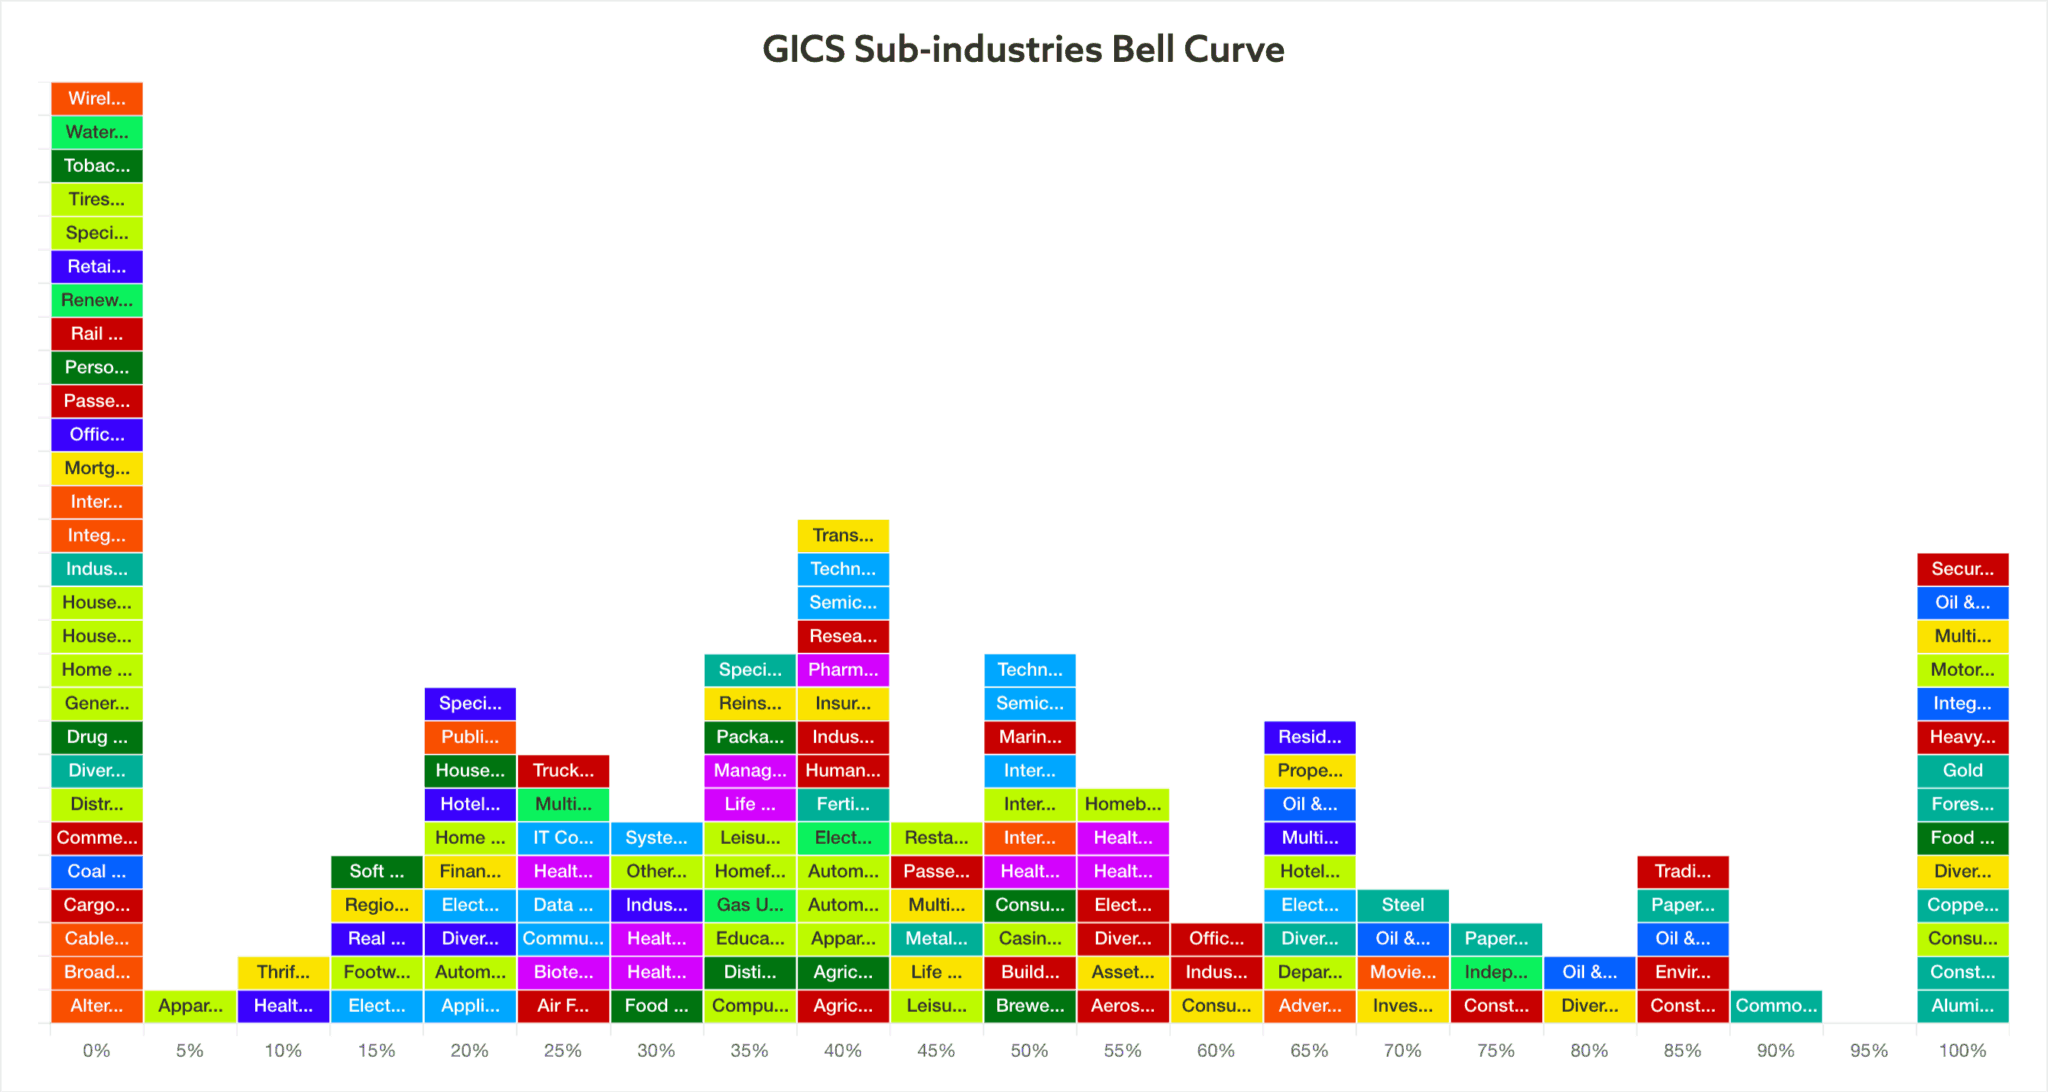
Video: New Features - Automated Industry Groups Bell Curve and Sector Breadth Charts - 27 March 2024
Brief video discussing more of the new features in development as well as a quick run through of the current market indexes and short-term breadth charts.
Read More
25 March, 2024
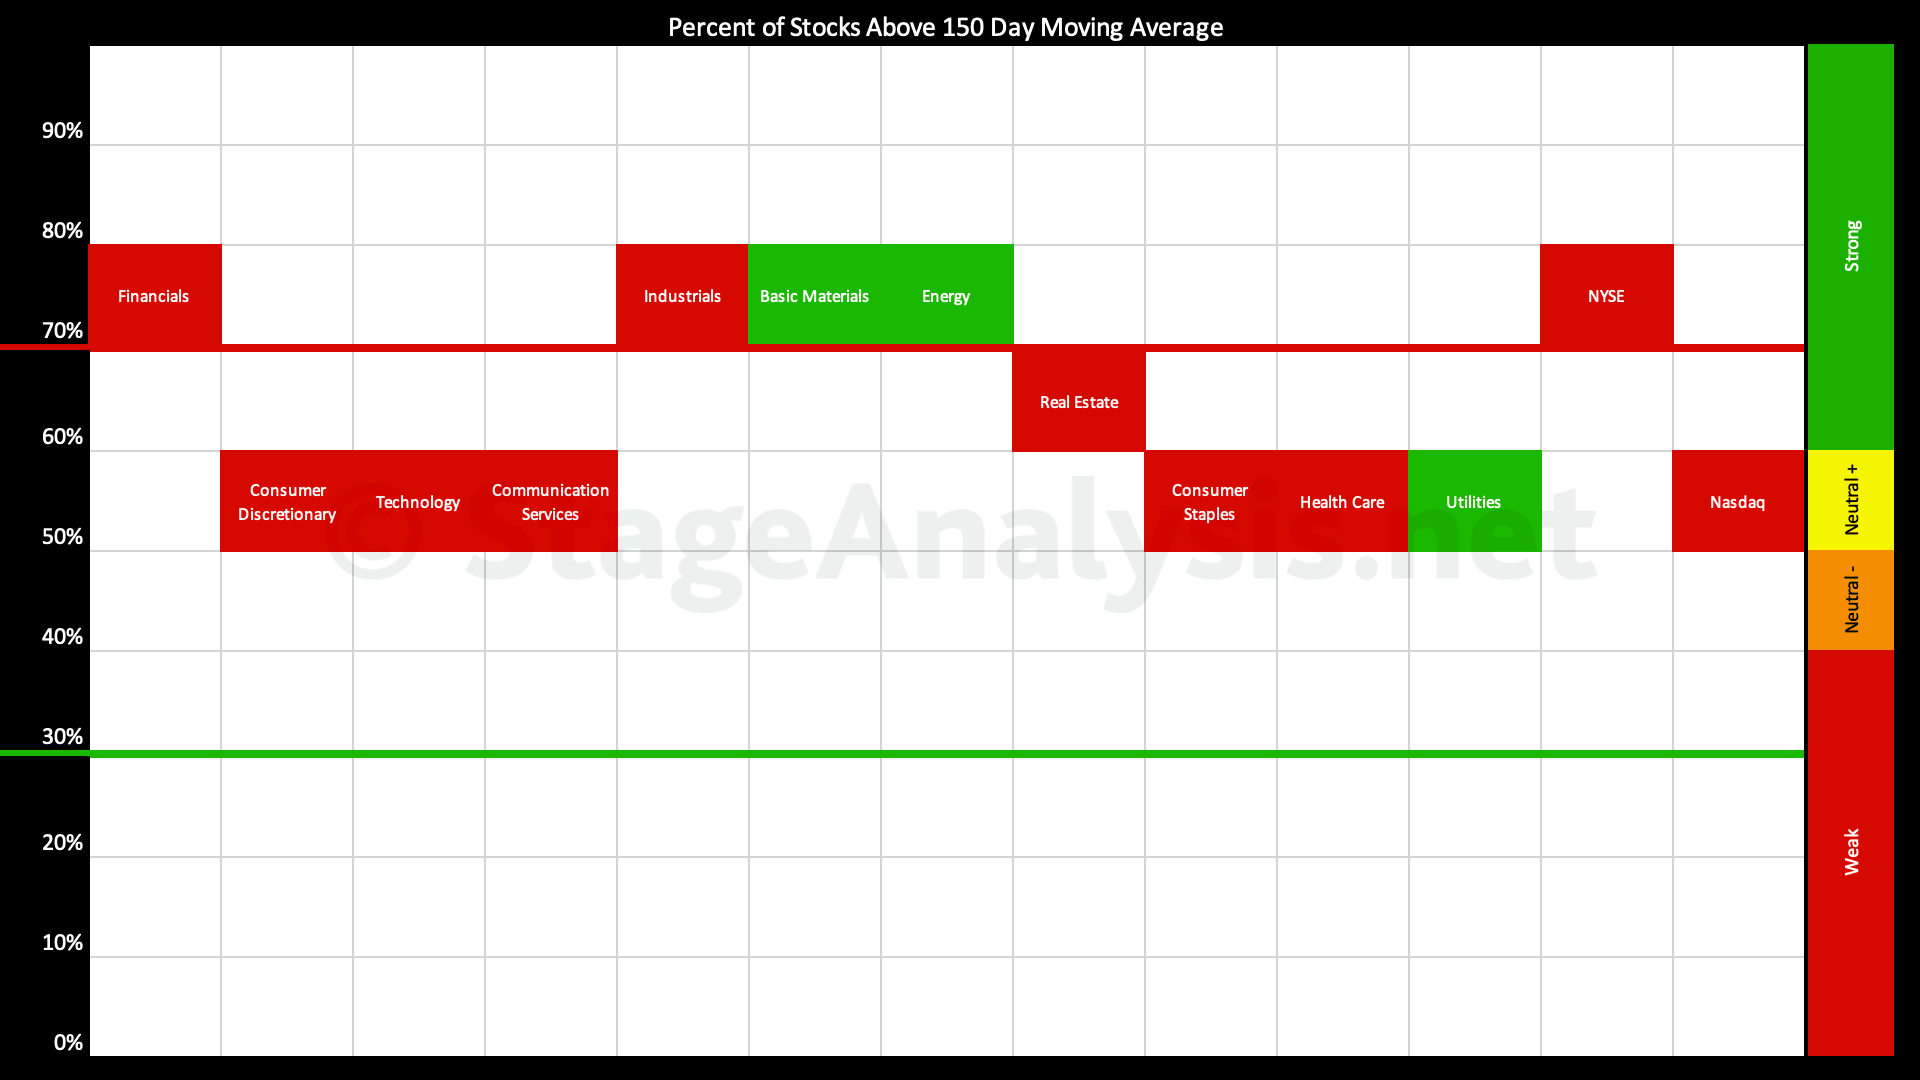
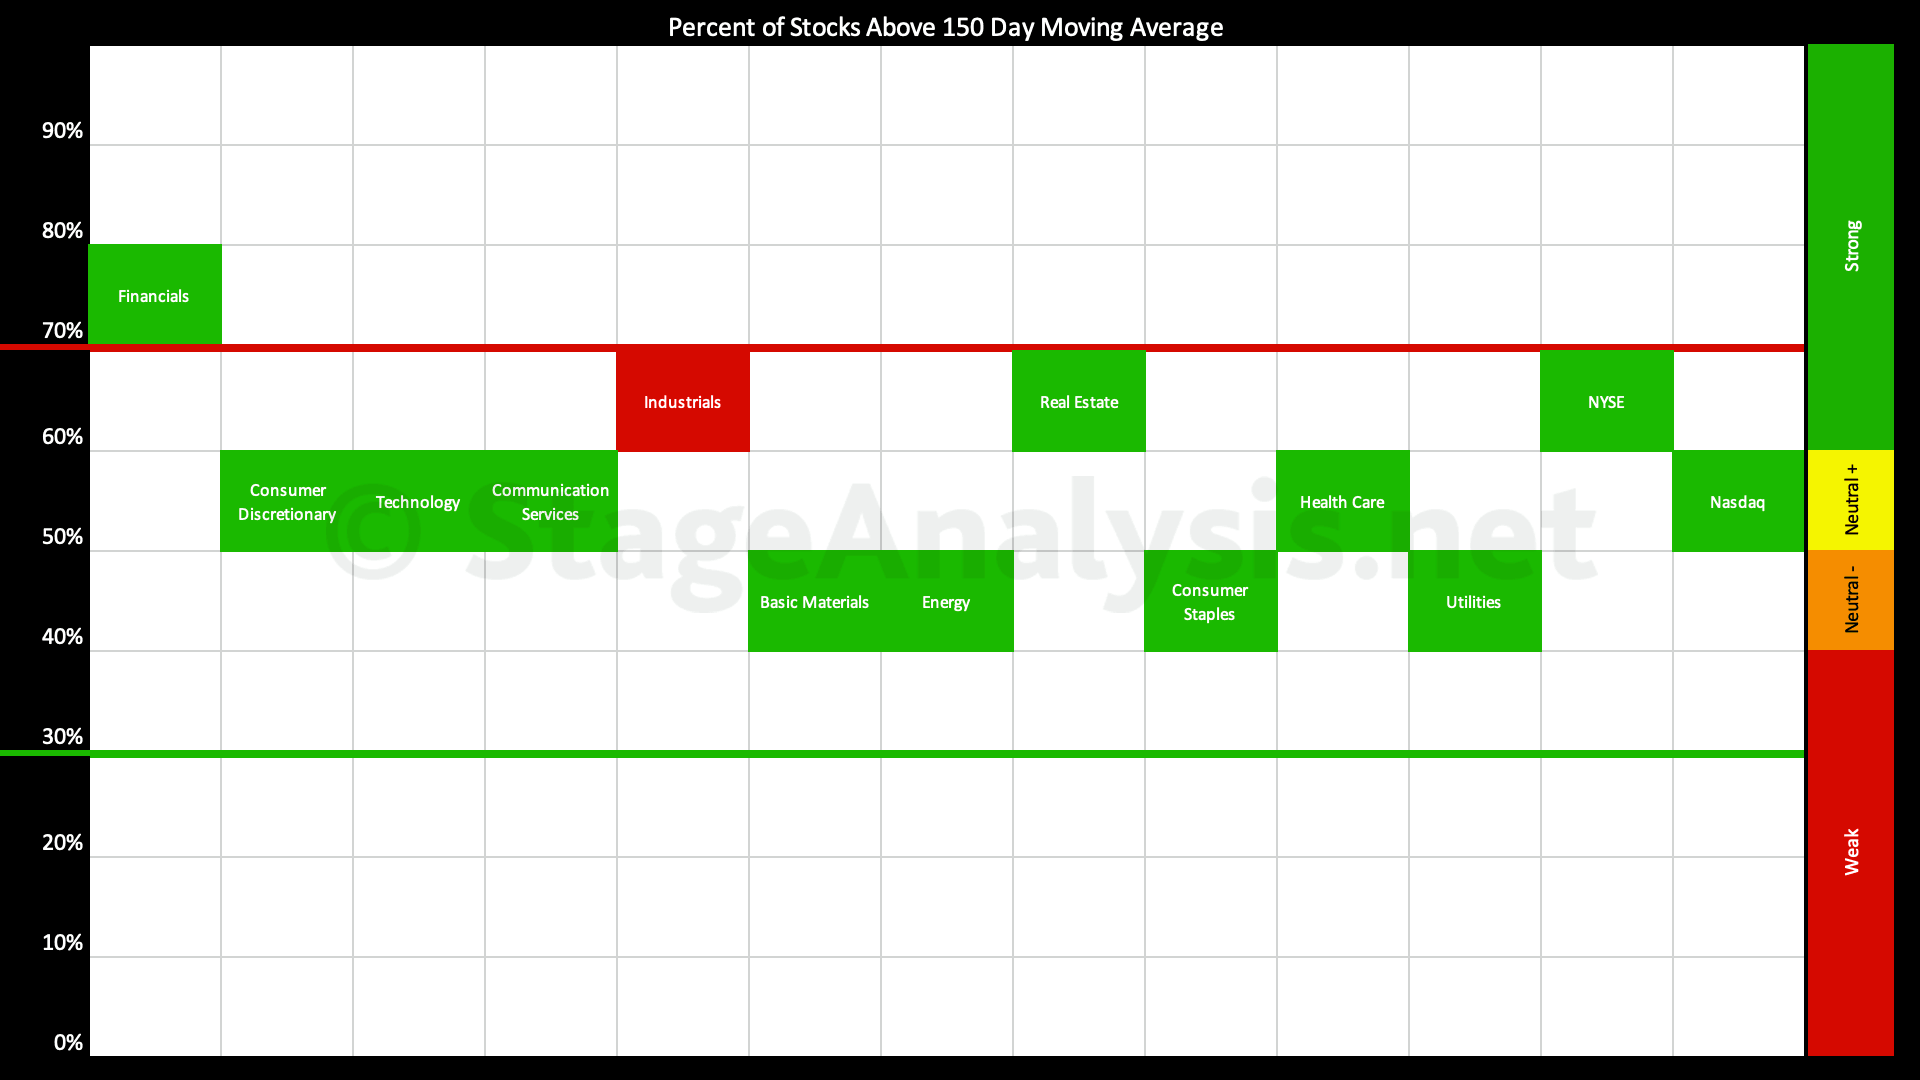
Sector Breadth: Percentage of US Stocks Above Their 150 day (30 Week) Moving Averages
The percentage of US stocks above their 150 day moving averages in the 11 major sectors decreased by -0.24% since the previous post, moving the overall average to 60.02%, which continues to hover around the borderline of the Strong zone (60%+ range).
Read More
11 March, 2024
Sector Breadth: Percentage of US Stocks Above Their 150 day (30 Week) Moving Averages
The percentage of US stocks above their 150 day moving averages in the 11 major sectors increased by +5.57% since the previous post on the 19th February 2024, moving the overall average to 60.26%, which is on the borderline of the Strong zone (60%+ range).
Read More
26 February, 2024
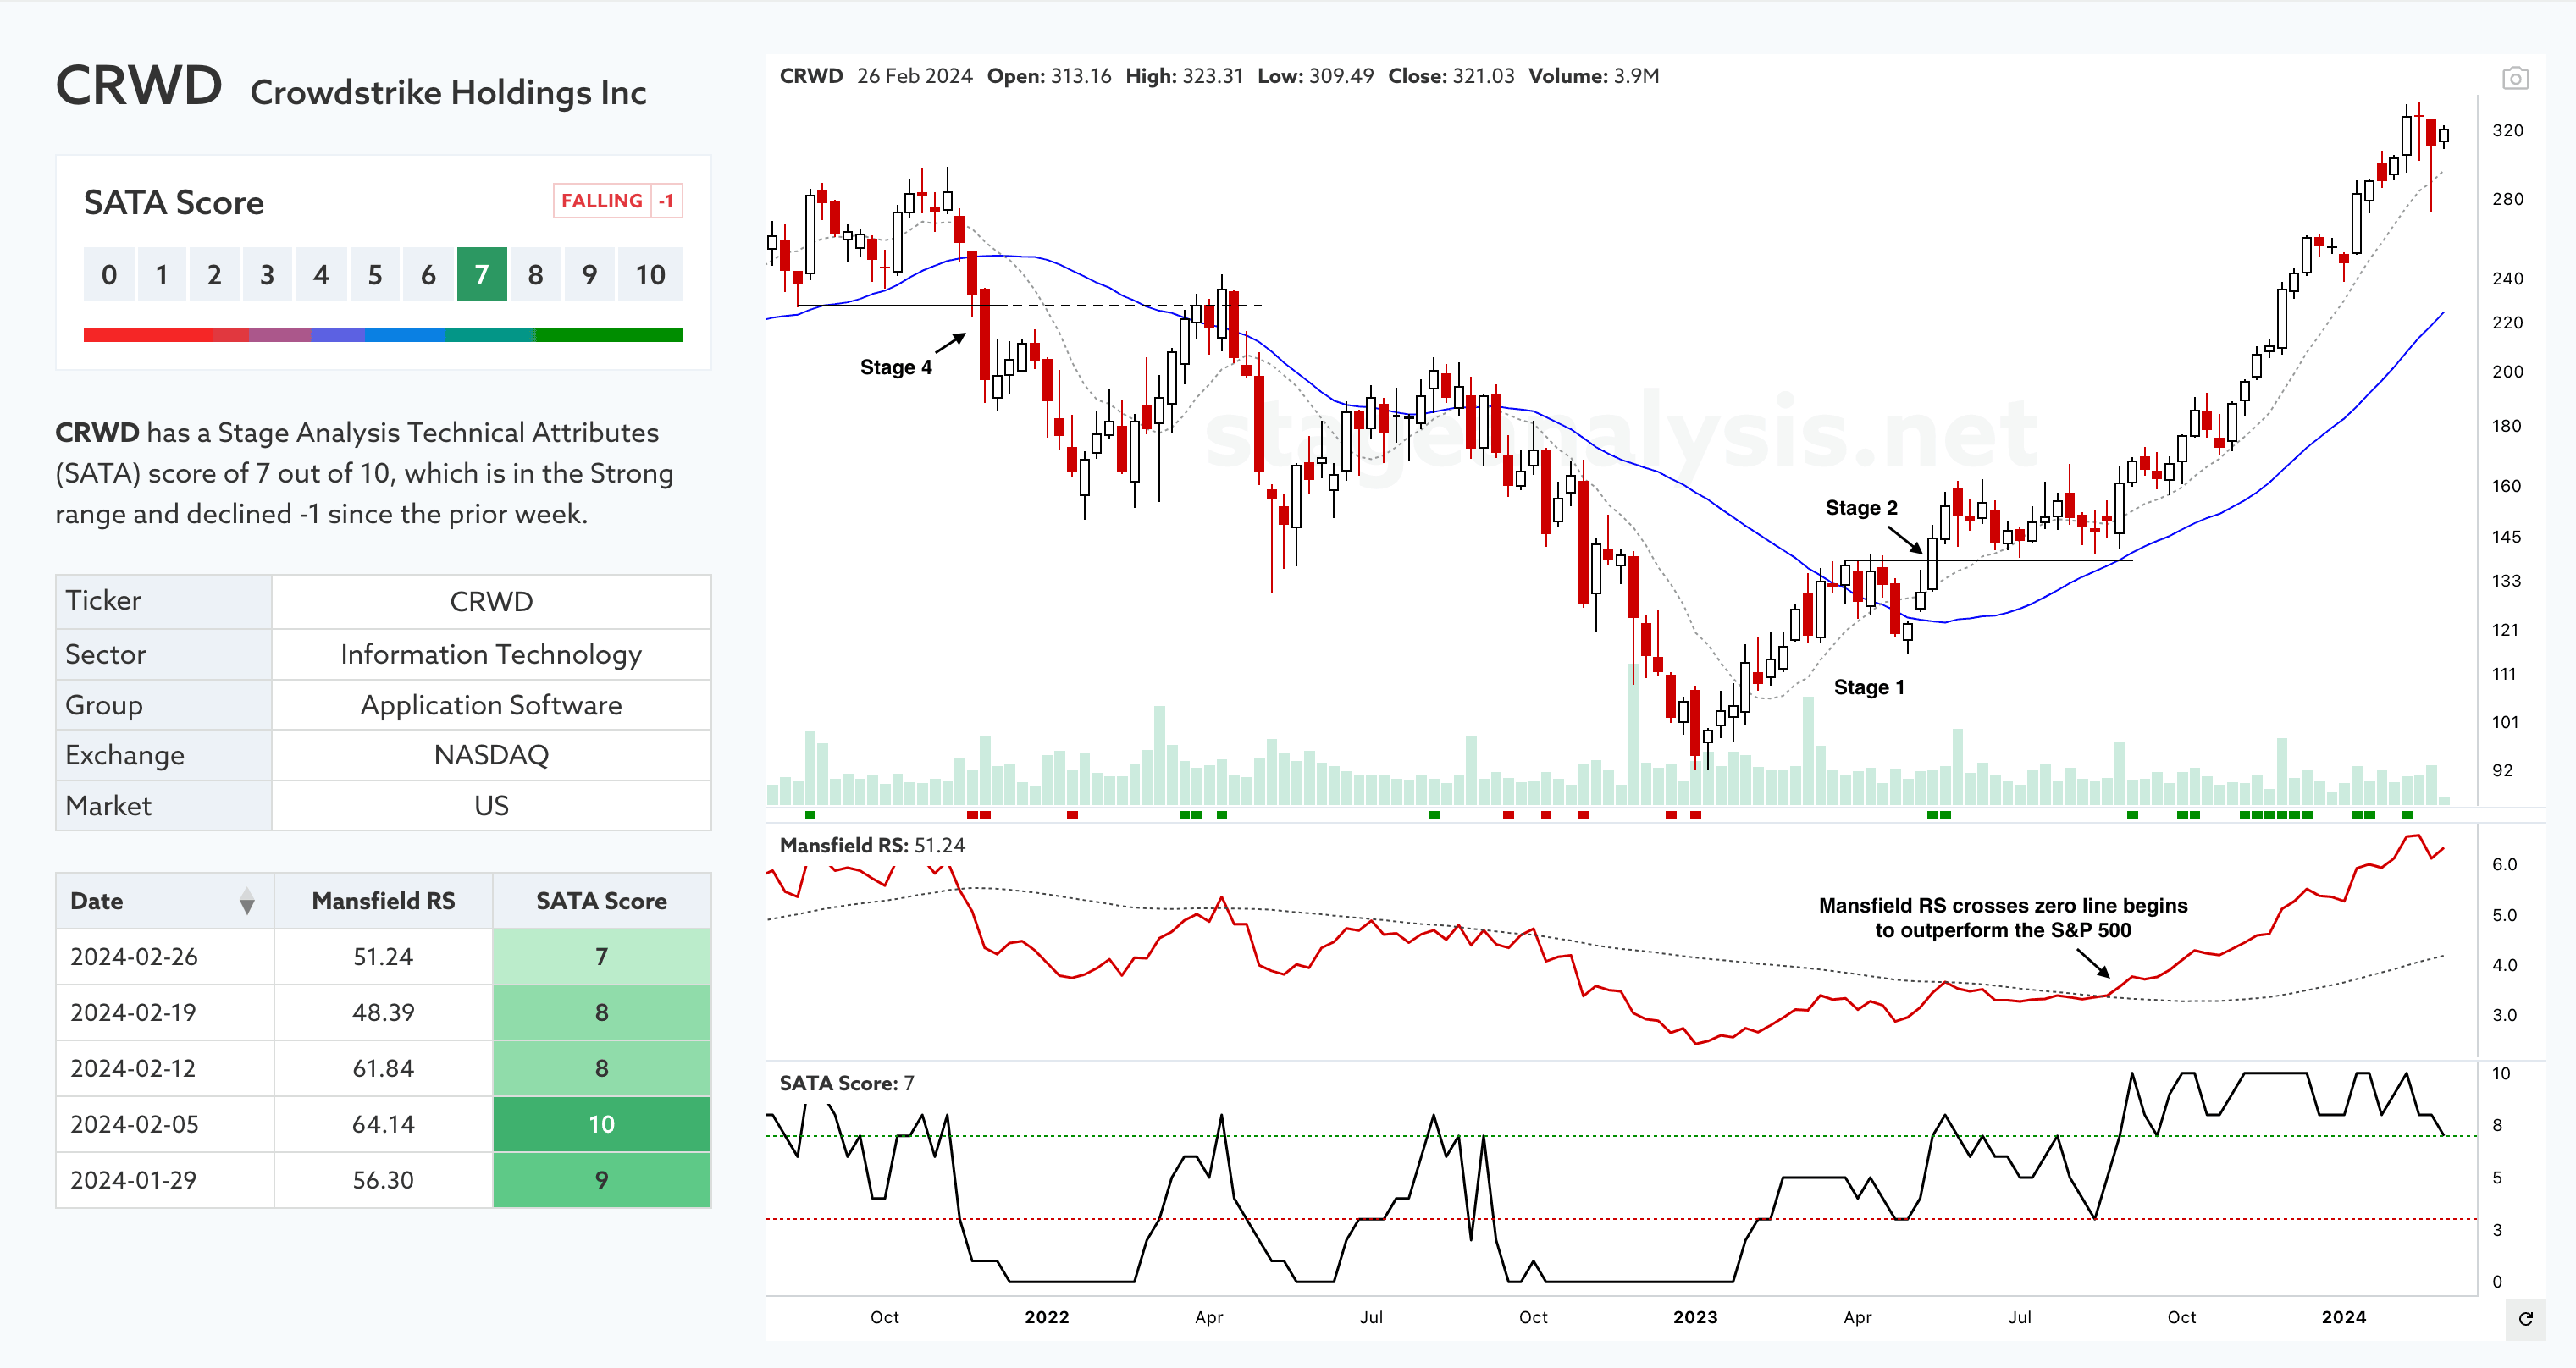
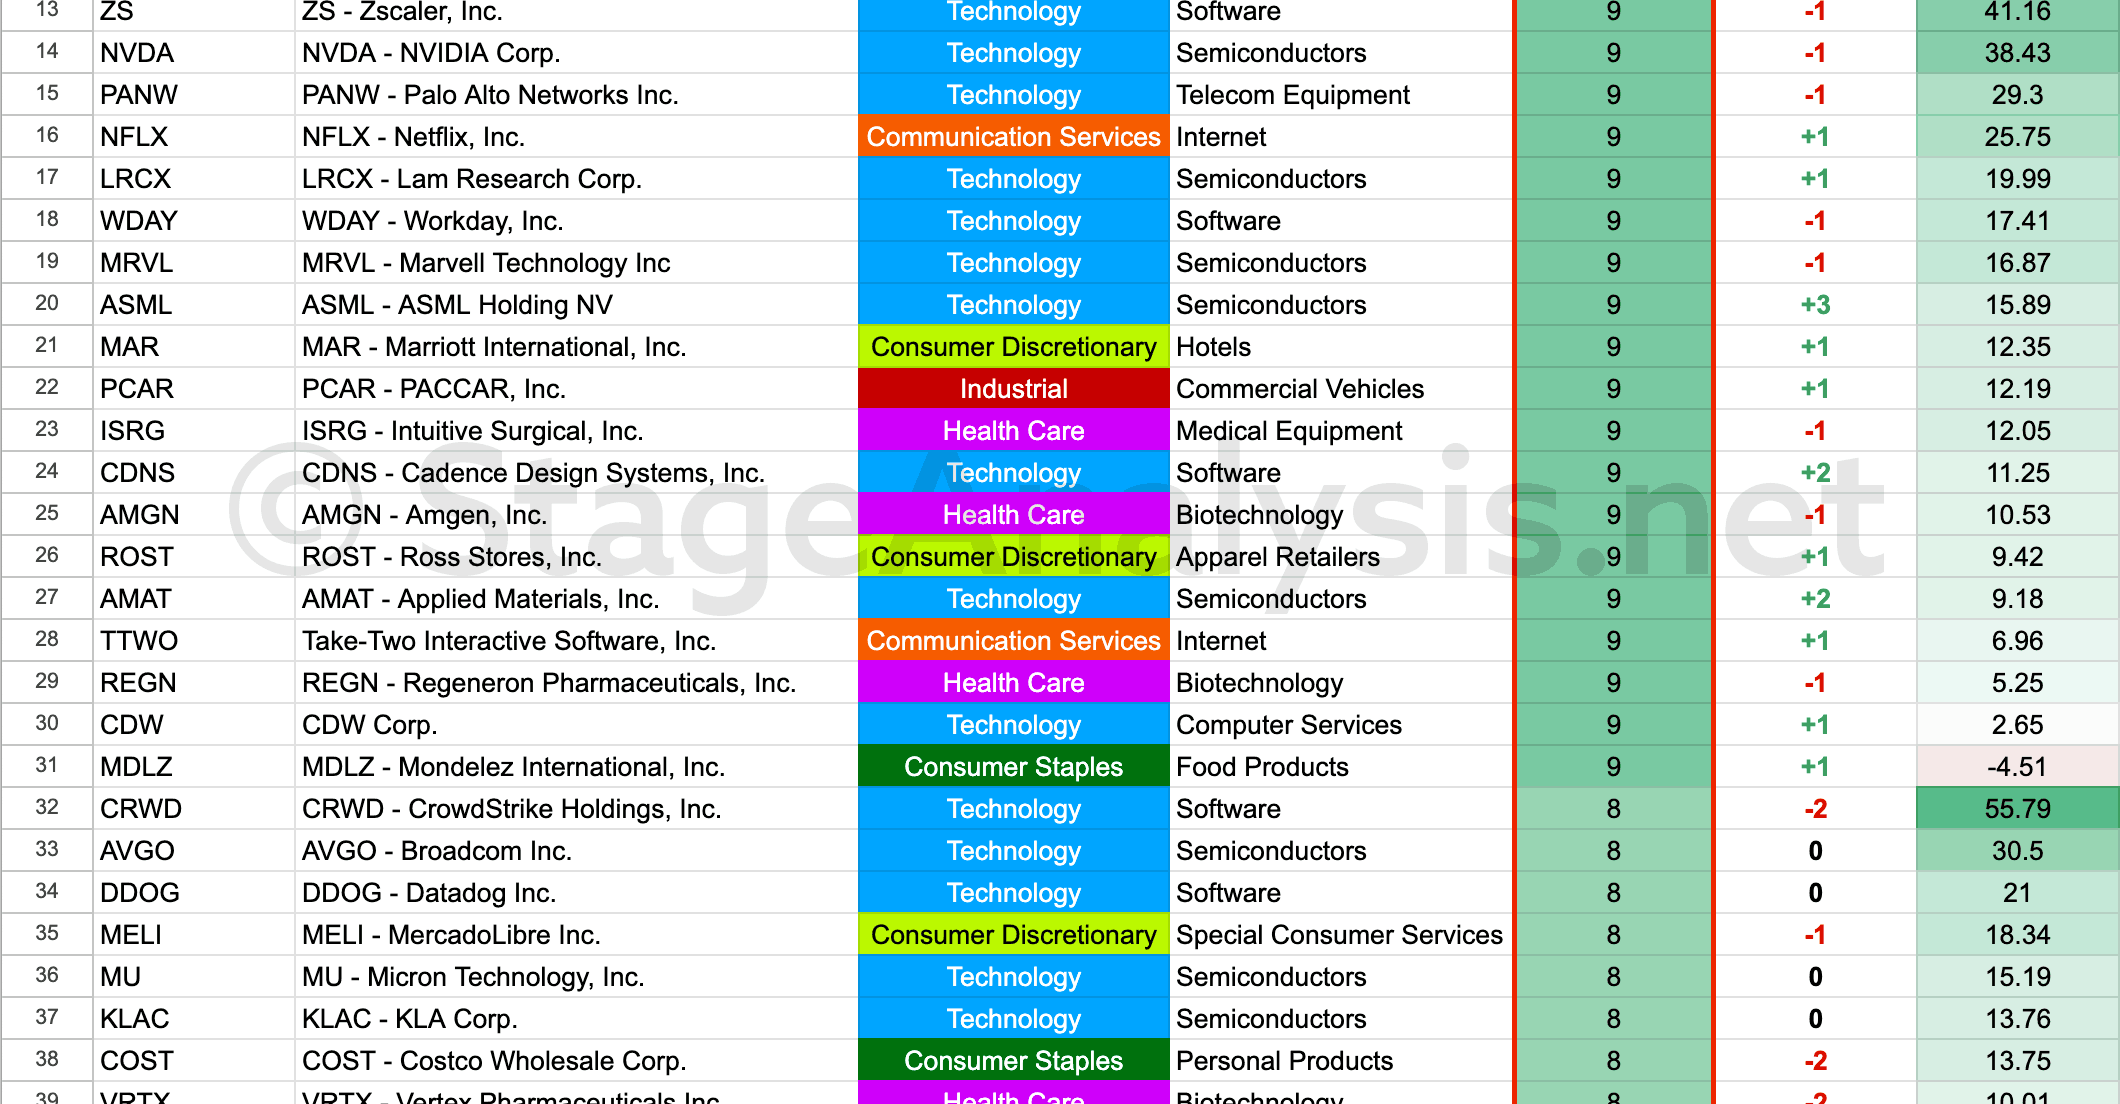
Stage Analysis Technical Attributes Scores – Nasdaq 100
The Stage Analysis Technical Attributes (SATA) score is our proprietary indicator that helps to identify the four stages from Stan Weinstein's Stage Analysis method, using a scoring system from 0 to 10 that rates key technical characteristics that we look for when analysing the weekly charts.
Read More
19 February, 2024
Sector Breadth: Percentage of US Stocks Above Their 150 day (30 Week) Moving Averages
The percentage of US stocks above their 150 day moving averages in the 11 major sectors increased by +7.28% since the previous post on the 5th February 2024, moving the overall average to 54.69%, which is in the Neutral+ zone (50% to 59.99% range)...
Read More
12 February, 2024
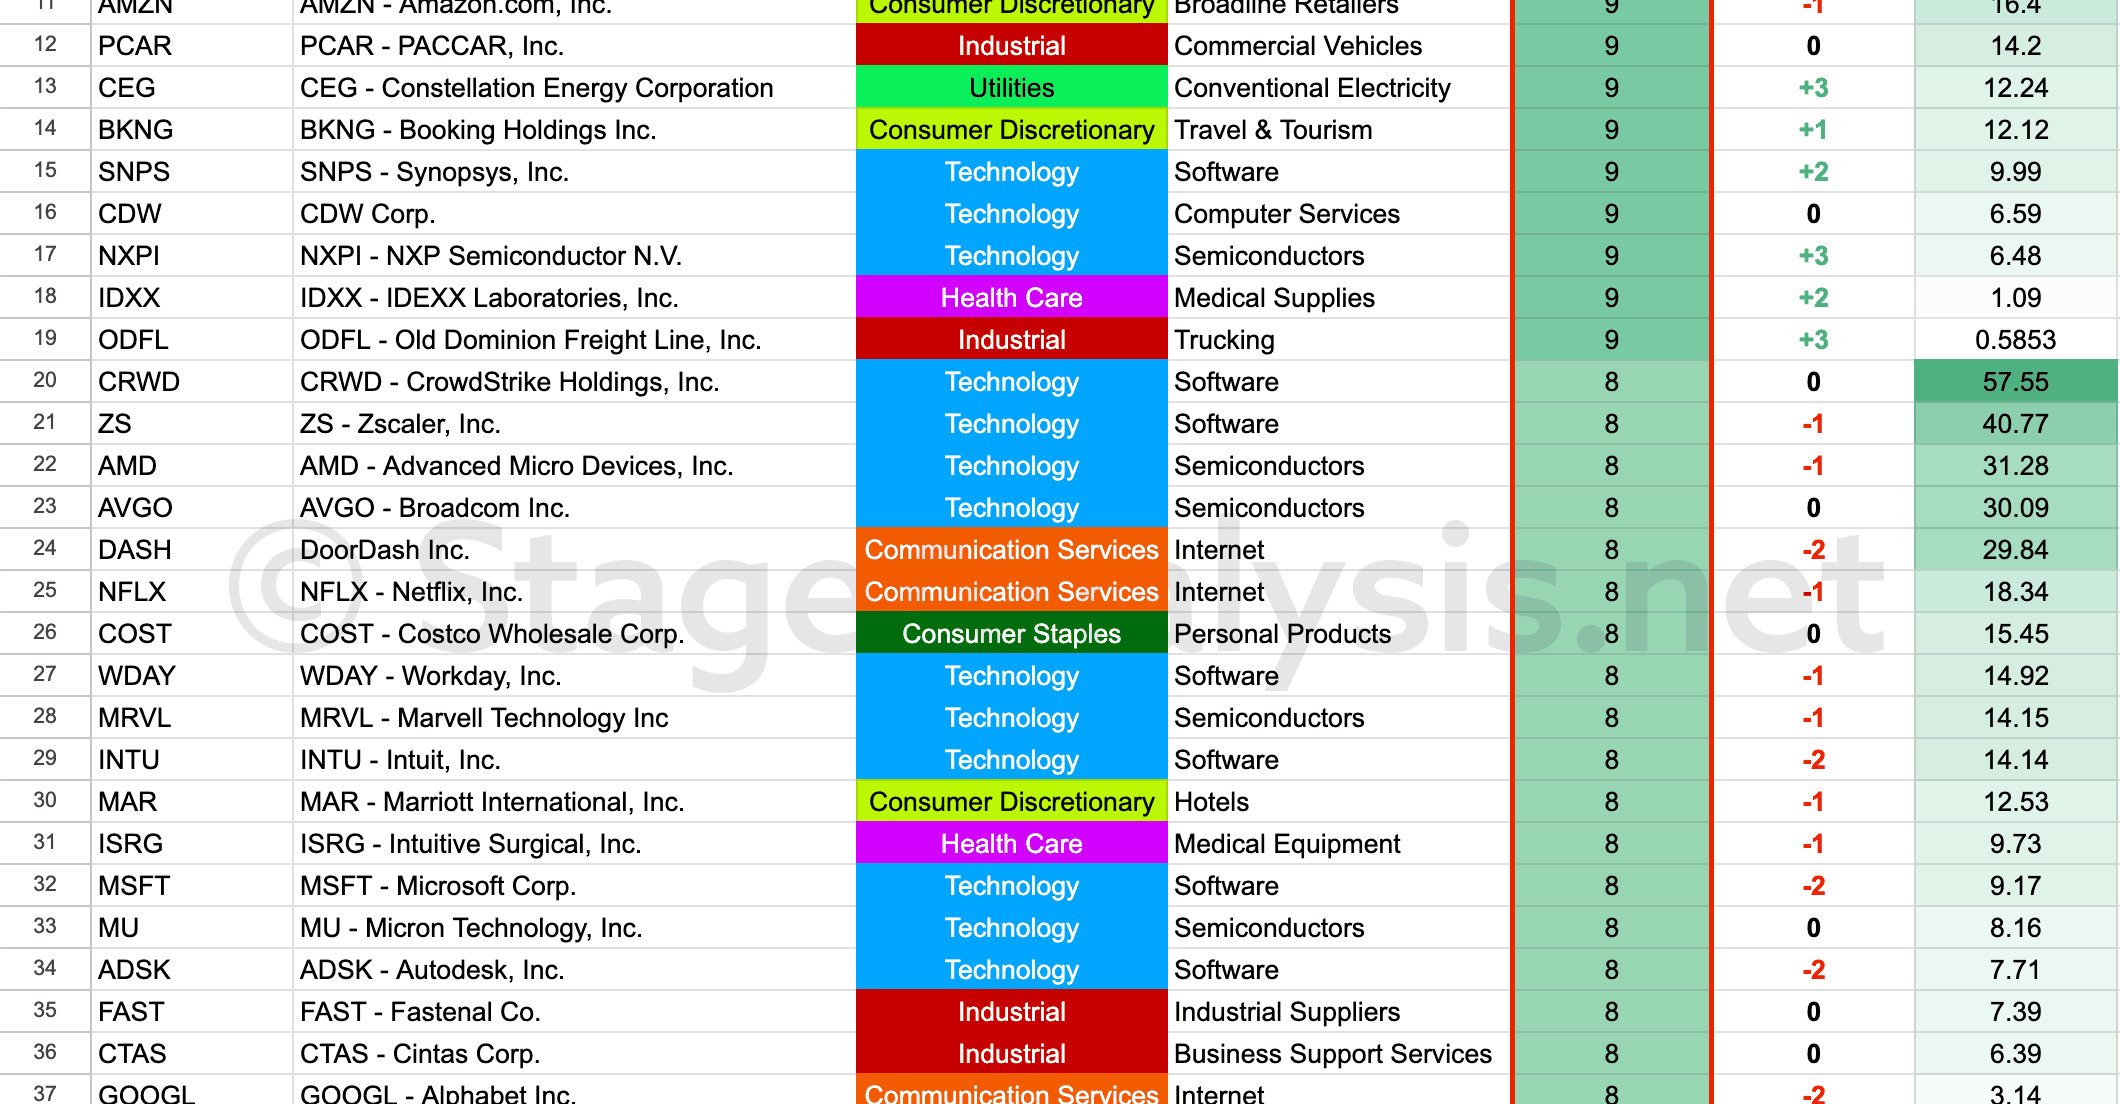
Stage Analysis Technical Attributes Scores – Nasdaq 100
The Stage Analysis Technical Attributes (SATA) score is our proprietary indicator that helps to identify the four stages from Stan Weinstein's Stage Analysis method, using a scoring system from 0 to 10 that rates key technical characteristics that we look for when analysing the weekly charts.
Read More
05 February, 2024
Sector Breadth: Percentage of US Stocks Above Their 150 day (30 Week) Moving Averages
The percentage of US stocks above their 150 day moving averages in the 11 major sectors decreased by -6.67% since the previous post, moving the overall average to 47.41%, which is in the Neutral- zone (40% to 49.99% range)...
Read More
29 January, 2024
Stage Analysis Technical Attributes Scores – Nasdaq 100
The Stage Analysis Technical Attributes (SATA) score is our proprietary indicator that helps to identify the four stages from Stan Weinstein's Stage Analysis method, using a scoring system from 0 to 10 that rates ten of the key technical characteristics that we look for when analysing the weekly charts.
Read More