Stage Analysis members weekend video with a discussion of the US Watchlist Stocks in detail on multiple timeframes, the NEW market breadth charts on the GICS Group, Industry and Sub-industry pages, the Industry Groups Relative Strength (RS) Rankings, the Bell Curves, the key Market Breadth Charts to determine the Weight of Evidence, Significant Weekly Bars, and the Major US Stock Market Indexes.
Read More

Blog
23 June, 2024
Stage Analysis Members Video – 23 June 2024 (55 mins)
09 June, 2024
Stage Analysis Members Video – 9 June 2024 (57 mins)
Stage Analysis members weekend video which this week starts with a discussion of the US Watchlist Stocks in detail on multiple timeframes, the continued improvements to the Stage Analysis Screener, the Industry Groups Relative Strength (RS) Rankings, the Bell Curves, the key Market Breadth Charts to determine the Weight of Evidence, Significant Weekly Bars, and the Major US Stock Market Indexes.
Read More
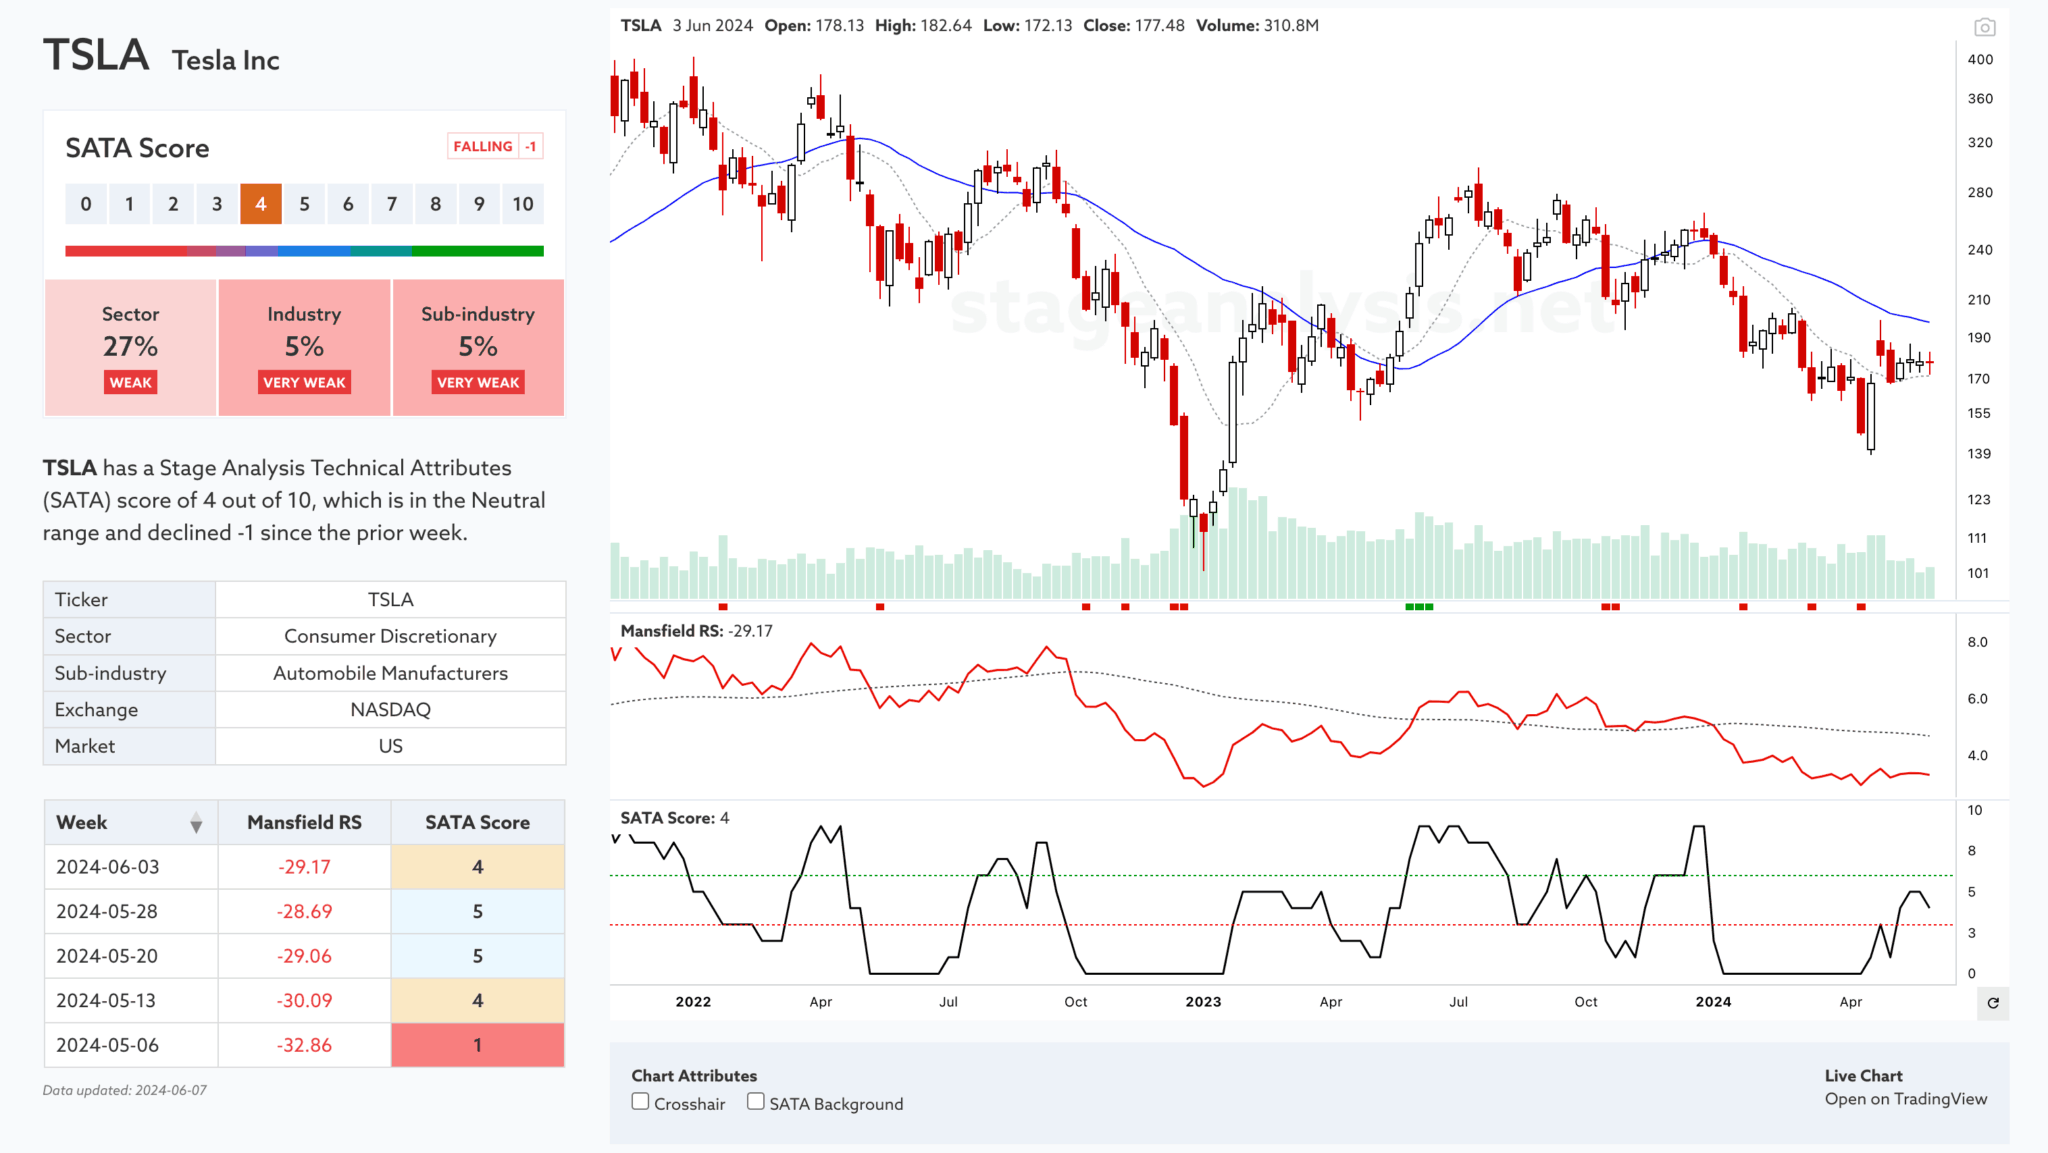
02 June, 2024
Stage Analysis Members Video – 2 June 2024 (56mins)
Stage Analysis members weekend video beginning with a discussion of the US Watchlist Stocks in detail on multiple timeframes, the new custom filter on the Stage Analysis Screener, the Industry Groups Relative Strength (RS) Rankings, the Sub-industries Bell Curve, the key Market Breadth Charts to determine the Weight of Evidence, Significant Weekly Bars, and the Major US Stock Market Indexes.
Read More
12 May, 2024
Stage Analysis Members Video – 12 May 2024 (1hr 3mins)
Stage Analysis members weekend video beginning with a look at some of this weeks Significant Bars, followed by the weekend US watchlist stocks, then the New Stage Analysis Screener options, the Industry Groups Relative Strength (RS) Rankings, the key Market Breadth Charts to determine the Weight of Evidence, and the Major US Stock Market Indexes.
Read More
08 May, 2024
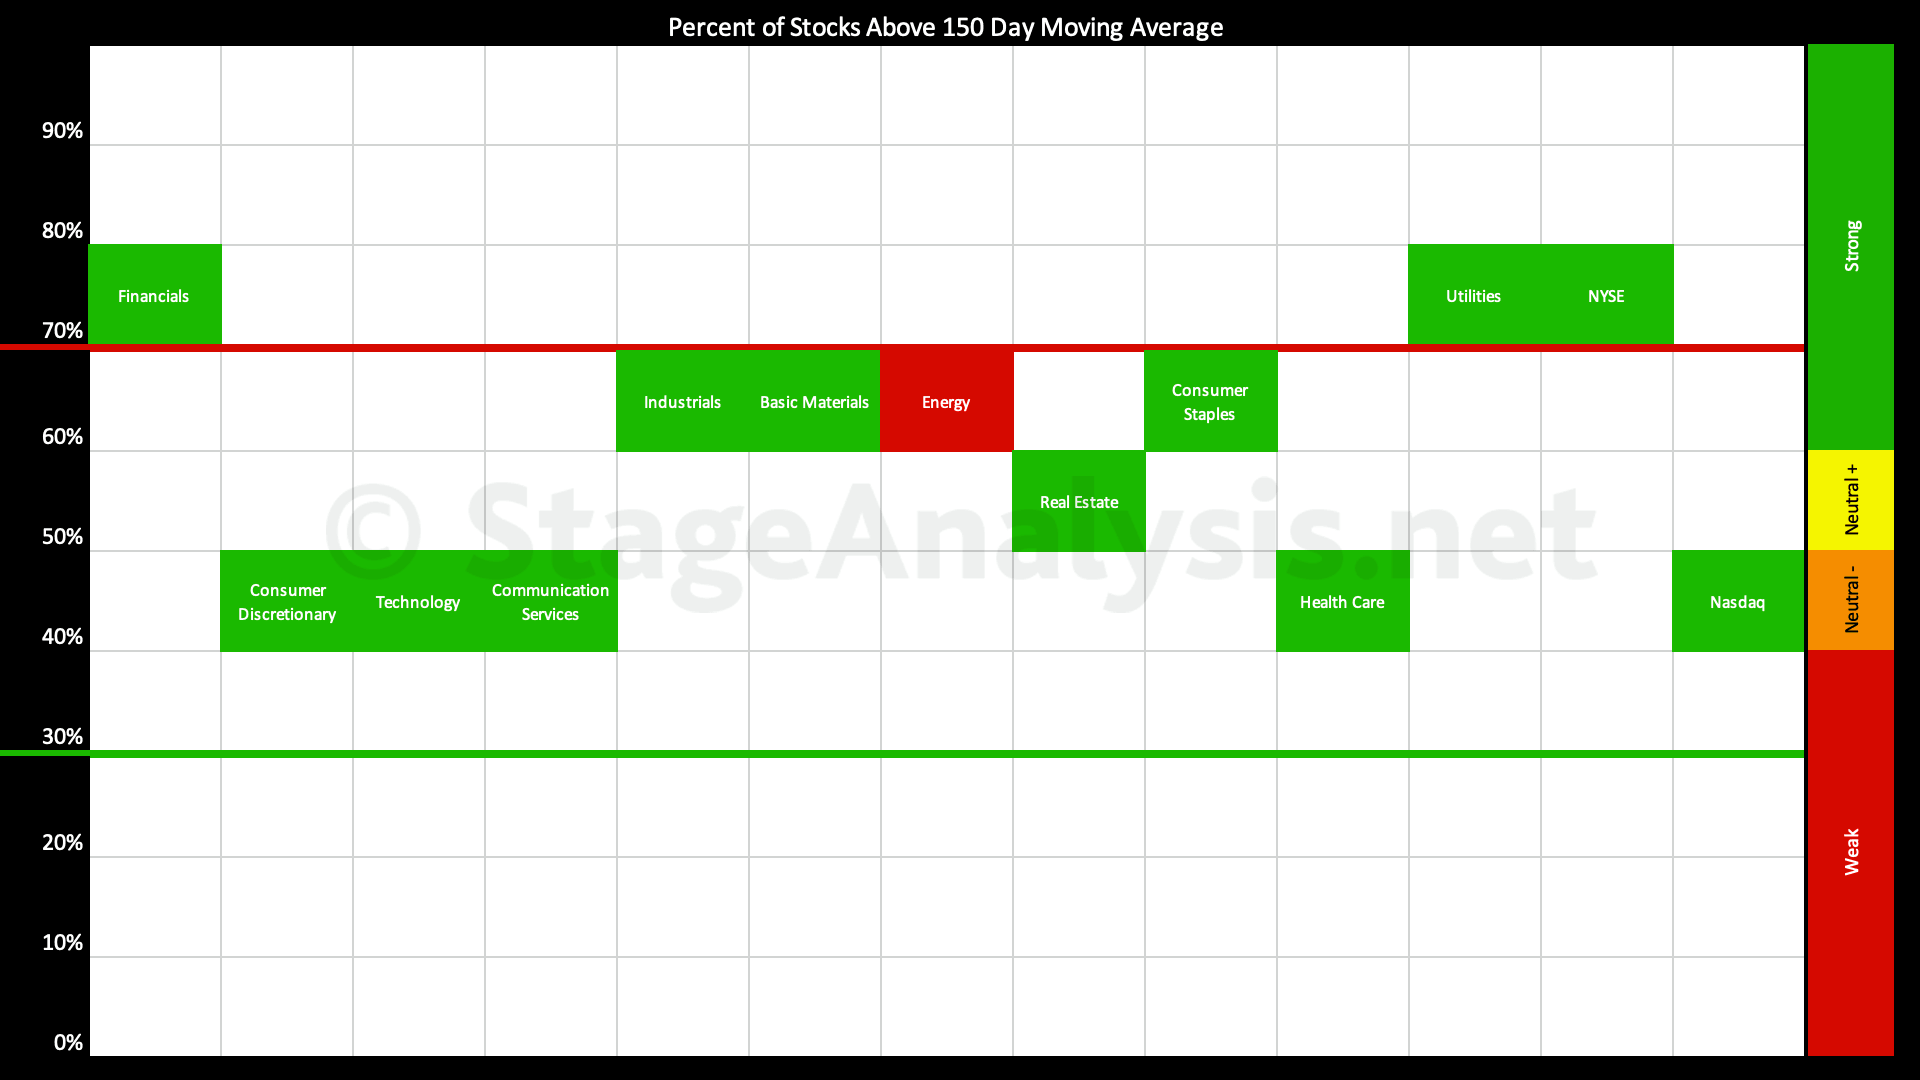
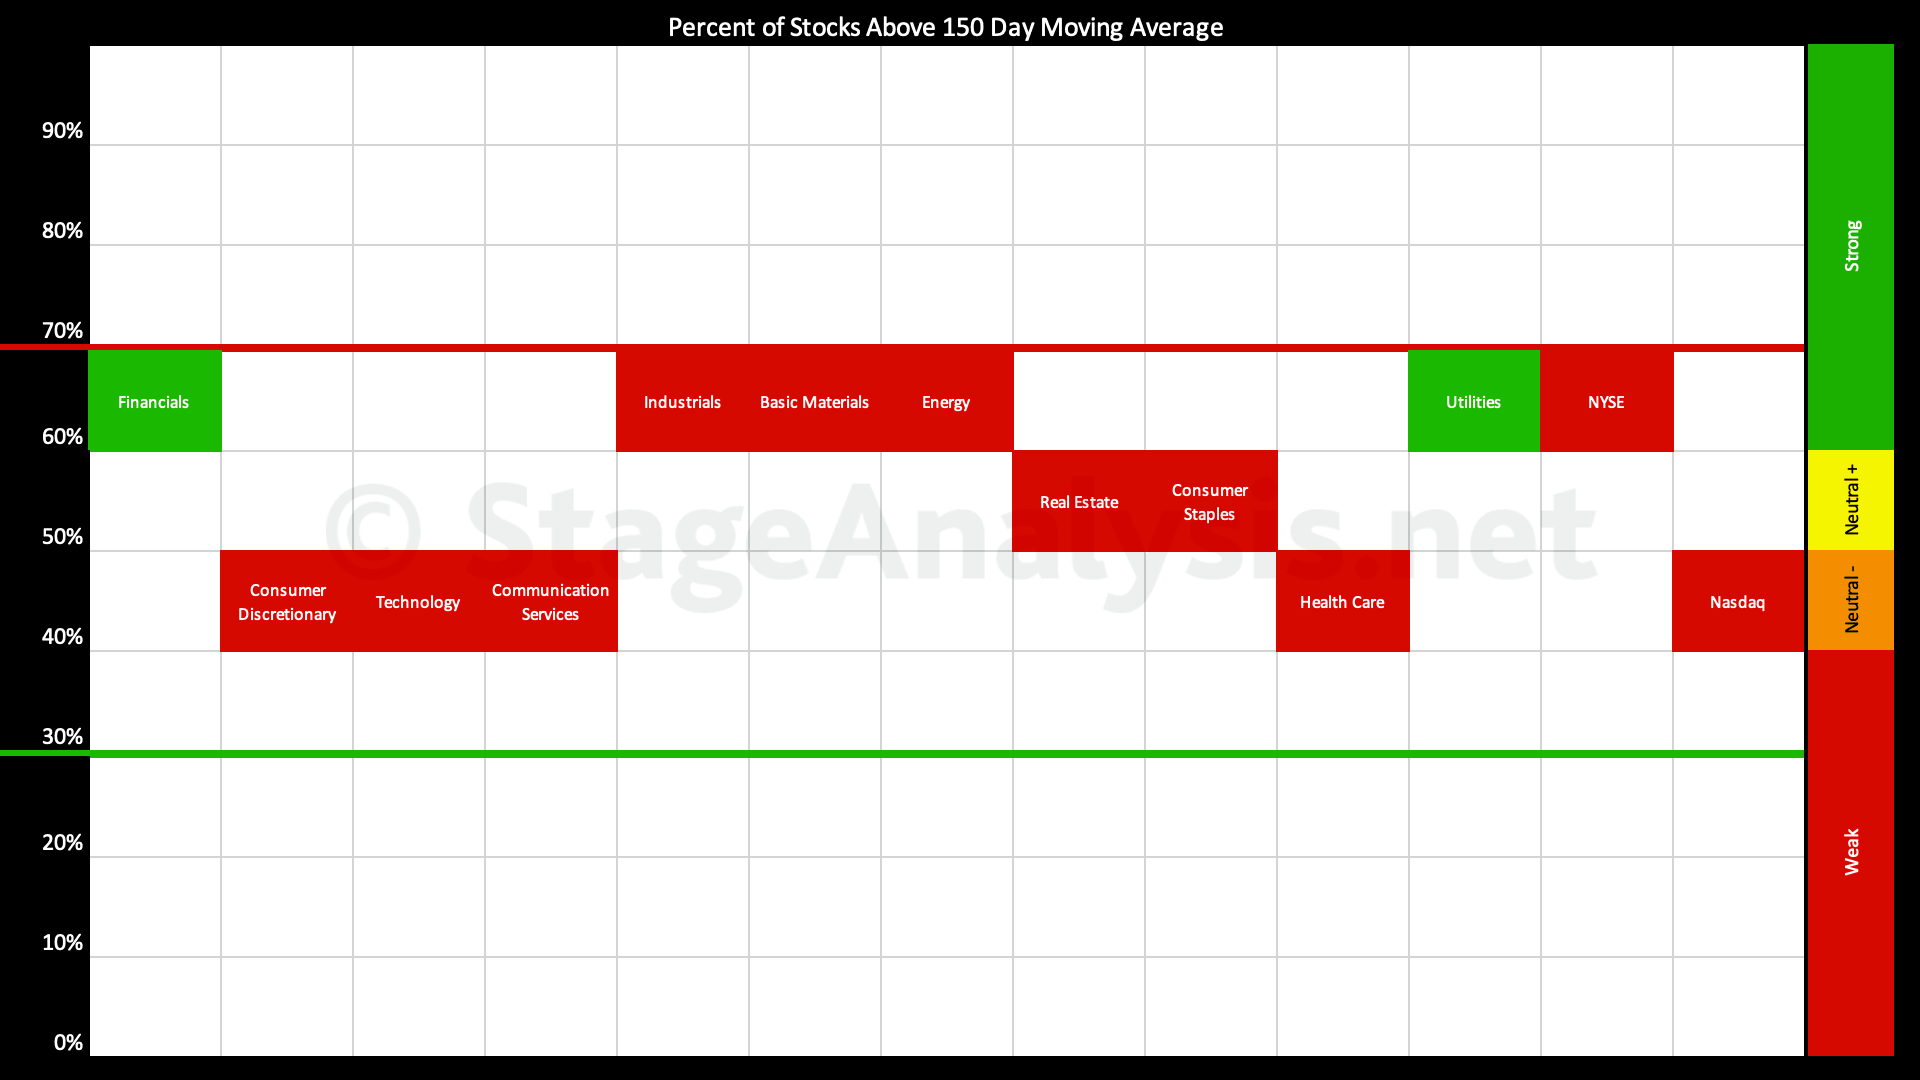
Sector Breadth: Percentage of US Stocks Above Their 150 day (30 Week) Moving Averages
The percentage of US stocks above their 150 day moving averages in the 11 major sectors increased by +5.93% since the previous post, moving the overall average to 60.00%, which is the lower edge of the Strong zone (60%+).
Read More
01 May, 2024
Video: New Features – 1 May 2024 (25mins)
Video discussing more of the new features added in the last week to the Stage Analysis website...
Read More
28 April, 2024
Stage Analysis Members Video – 28 April 2024 (1hr 4mins)
Stage Analysis members weekend video beginning with a look at the most recent US watchlist stocks, Significant Weekly Bars moving on volume, the new interactive GICS Sub-industries Bell Curve improvements, the Industry Groups Relative Strength (RS) Rankings, the key Market Breadth Charts to determine the Weight of Evidence, and the Major US Stock Market Indexes.
Read More
24 April, 2024
Video: New Features – 24 April 2024 (23mins)
Brief video discussing some of the new features added this week to the Stage Analysis website and a look at the current group and sector themes via the new interactive tools.
Read More
22 April, 2024
Sector Breadth: Percentage of US Stocks Above Their 150 day (30 Week) Moving Averages
The percentage of US stocks above their 150 day moving averages in the 11 major sectors decreased by -9.03% since the previous post, moving the overall average to 54.07%, which is the Neutral zone (40% to 60% range).
Read More
20 April, 2024
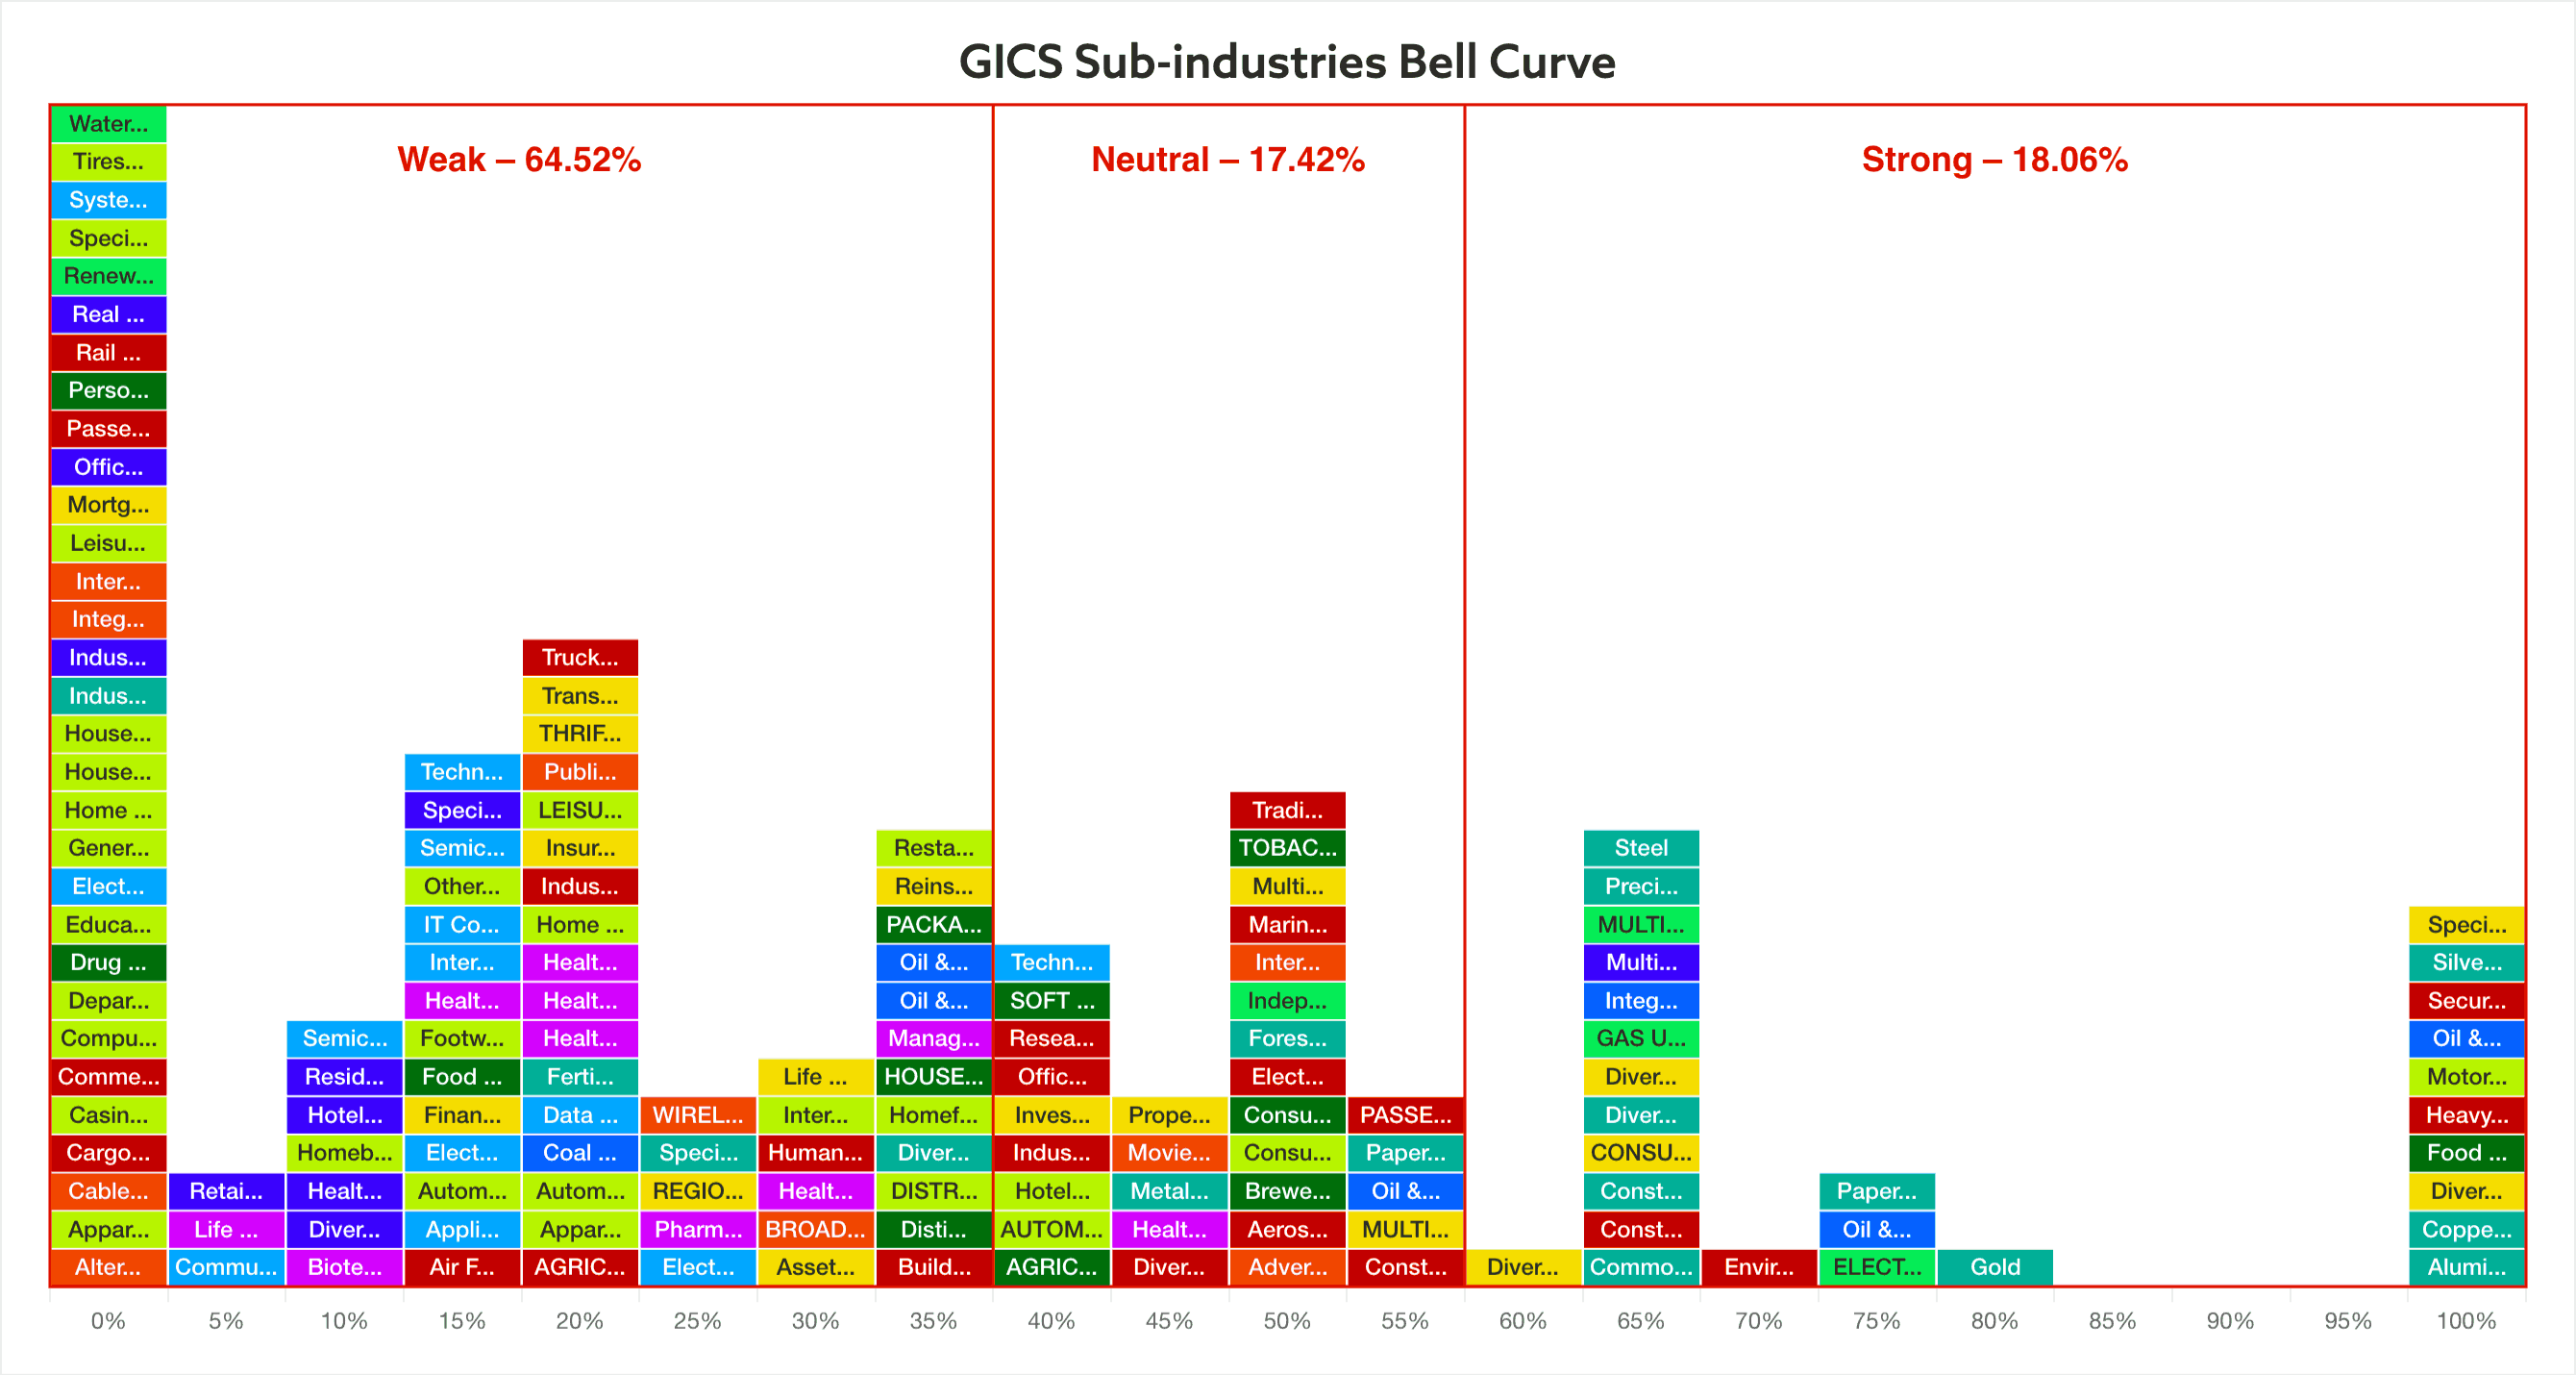
Video: GICS Sub-industries Bell Curve (10 mins)
Discussing the GICS Sub-industries on the move and explaining how to use Bell Curve interactive graphic and table.
Read More