Stage Analysis members weekend video starting with this weeks Significant Weekly Bars moving on volume, then a further look at new Stage Analysis Technical Attributes (SATA) tool, new features and how to use it, followed by the US watchlist stocks in detail on multiple timeframes, the Industry Groups Relative Strength (RS) Rankings, IBD Industry Group Bell Curve – Bullish Percent, the key Market Breadth Charts to determine the Weight of Evidence and the Major US Stock Market Indexes.
Read More

Blog
31 March, 2024
Stage Analysis Members Video – 31 March 2024 (1hr 6mins)
27 March, 2024
Video: New Features - Automated Industry Groups Bell Curve and Sector Breadth Charts - 27 March 2024
Brief video discussing more of the new features in development as well as a quick run through of the current market indexes and short-term breadth charts.
Read More
24 March, 2024
Stage Analysis Members Video – 24 March 2024 (56 mins)
Stage Analysis members weekend video starting with discussion of the US watchlist stocks in detail on multiple timeframes, then some of the weeks Significant Weekly Bars moving on volume, and a continued look at new Stage Analysis Technical Attributes (SATA) tool and how to use it, the Industry Groups Relative Strength (RS) Rankings, IBD Industry Group Bell Curve – Bullish Percent, the key Market Breadth Charts to determine the Weight of Evidence and the Major US Stock Market Indexes, and then finishing this week with analysis of the Bitcoin and Ethereum charts.
Read More
17 March, 2024
Stage Analysis Members Video – 17 March 2024 (1hr 1min)
Stage Analysis members weekend video beginning by discussing some of the weeks Significant Weekly Bars moving on volume, then US watchlist stocks in detail on multiple timeframes, a further look at new Stage Analysis Technical Attributes (SATA) tool and how to use it, the Industry Groups Relative Strength (RS) Rankings, IBD Industry Group Bell Curve – Bullish Percent, the key Market Breadth Charts to determine the Weight of Evidence and the Major US Stock Market Indexes.
Read More
10 March, 2024
Stage Analysis Members Video – 10 March 2024 (1hr 3mins)
Stage Analysis members weekend video discussing the Significant Weekly Bars moving on volume, the US watchlist stocks in detail on multiple timeframes, the new Stage Analysis Technical Attributes (SATA) tool and how to use it, the Industry Groups Relative Strength (RS) Rankings, IBD Industry Group Bell Curve – Bullish Percent, the key Market Breadth Charts to determine the Weight of Evidence, the Crypto Coins and the Major US Stock Market Indexes.
Read More
03 March, 2024
Stage Analysis Members Video – 3 March 2024 (1hr 13mins)
Stage Analysis members weekend video discussing the US watchlist stocks in detail on multiple timeframes, the new Stage Analysis Technical Attributes (SATA) tool added to the site, the Significant Weekly Bars moving on volume, Industry Groups Relative Strength (RS) Rankings, IBD Industry Group Bell Curve – Bullish Percent, the key Market Breadth Charts to determine the Weight of Evidence, and the Major US Stock Market Indexes.
Read More
25 February, 2024
Stage Analysis Members Video – 25 February 2024 (1hr 5mins)
Stage Analysis members weekend video discussing the Significant Weekly Bars moving on volume, the US watchlist stocks in detail on multiple timeframes, Industry Groups Relative Strength (RS) Rankings, IBD Industry Group Bell Curve – Bullish Percent, the key Market Breadth Charts to determine the Weight of Evidence, and the Major US Stock Market Indexes...
Read More
11 February, 2024
Stage Analysis Members Video – 11 February 2024 (1hr 15mins)
Stage Analysis members weekend video discussing the Significant Weekly Bars, the US watchlist stocks in detail on multiple timeframes, Industry Groups Relative Strength (RS) Rankings, IBD Industry Group Bell Curve – Bullish Percent, the key Market Breadth Charts to determine the Weight of Evidence, the Futures charts and finishing with the Stages of the Major US Stock Market Indexes...
Read More
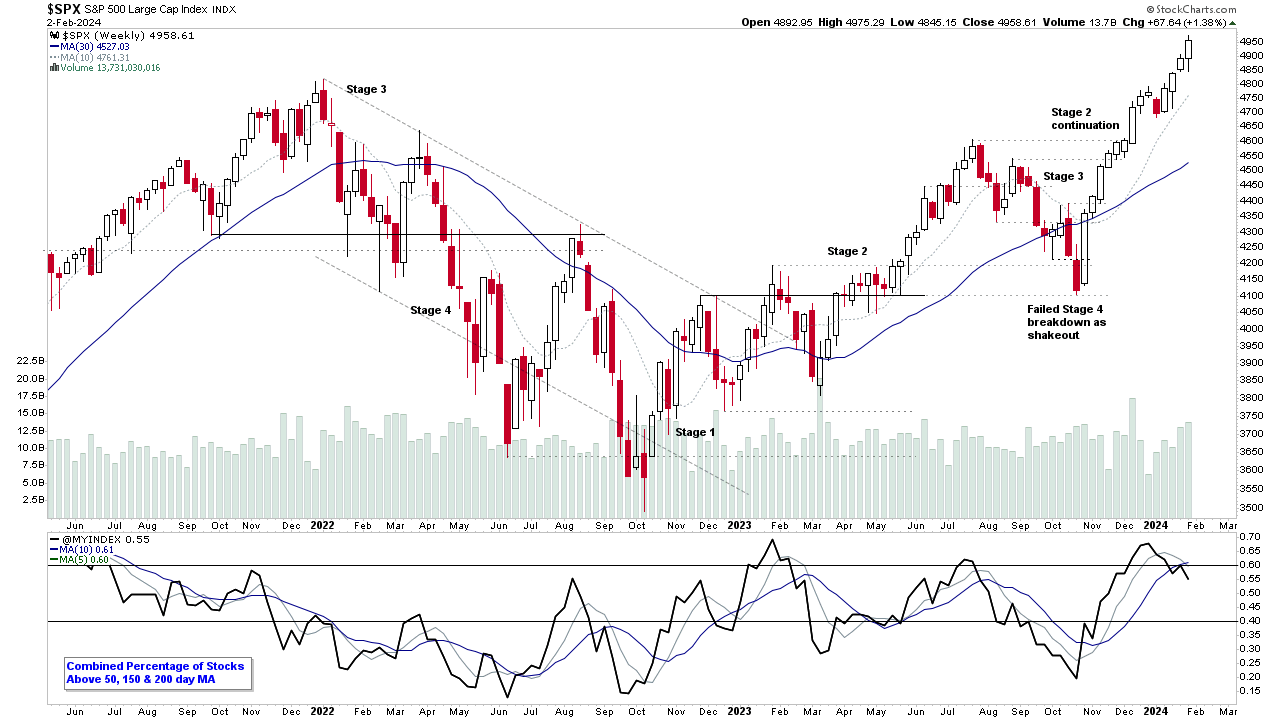
04 February, 2024
Stage Analysis Members Video – 4 February 2024 (1hr 7mins)
Stage Analysis members weekend video discussing the Stages of the Major US Stock Market Indexes, the Futures charts, Industry Groups Relative Strength (RS) Rankings, IBD Industry Group Bell Curve – Bullish Percent, the key Market Breadth Charts to determine the Weight of Evidence, Significant Weekly Bars and the most recent US watchlist stocks in detail on multiple timeframes...
Read More
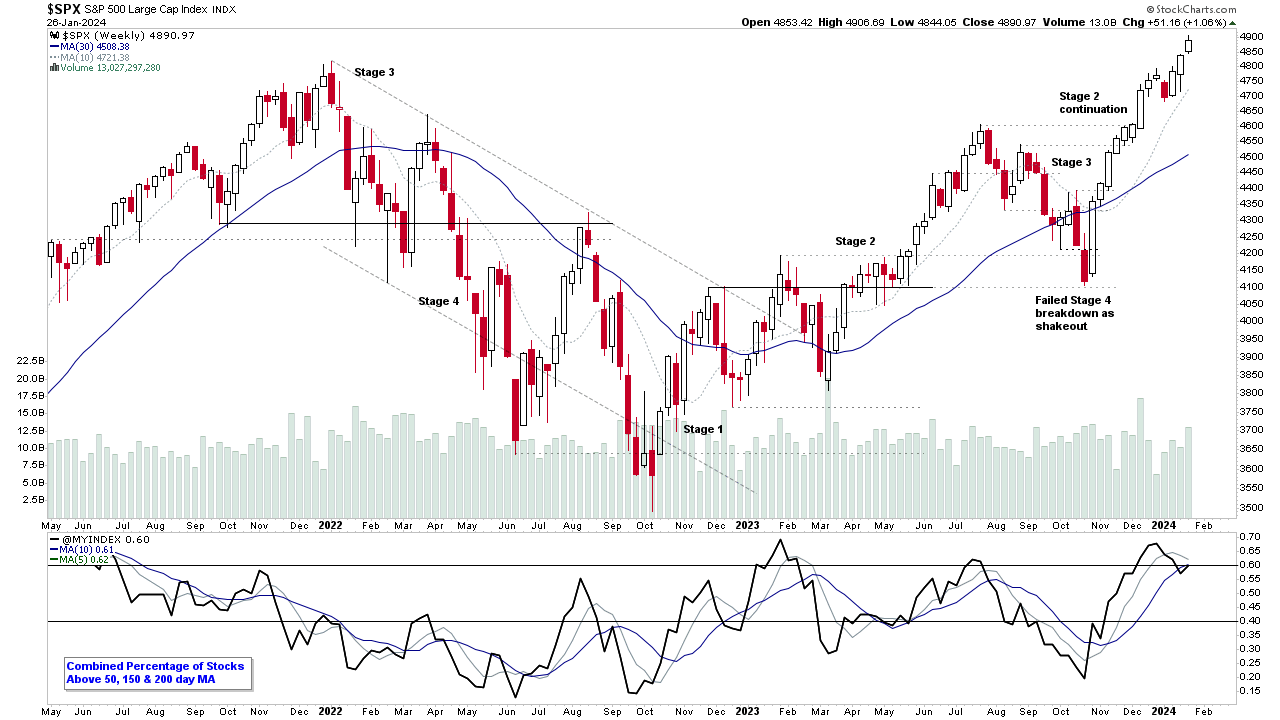
28 January, 2024
Stage Analysis Members Video – 28 January 2024 (1hr 15mins)
Stage Analysis members video discussing the Major US Stock Market Indexes, the Futures charts, Industry Groups Relative Strength (RS) Rankings, IBD Industry Group Bell Curve – Bullish Percent, the key Market Breadth Charts to determine the Weight of Evidence, Significant Weekly Bars and the most recent US watchlist stocks in detail on multiple timeframes.
Read More