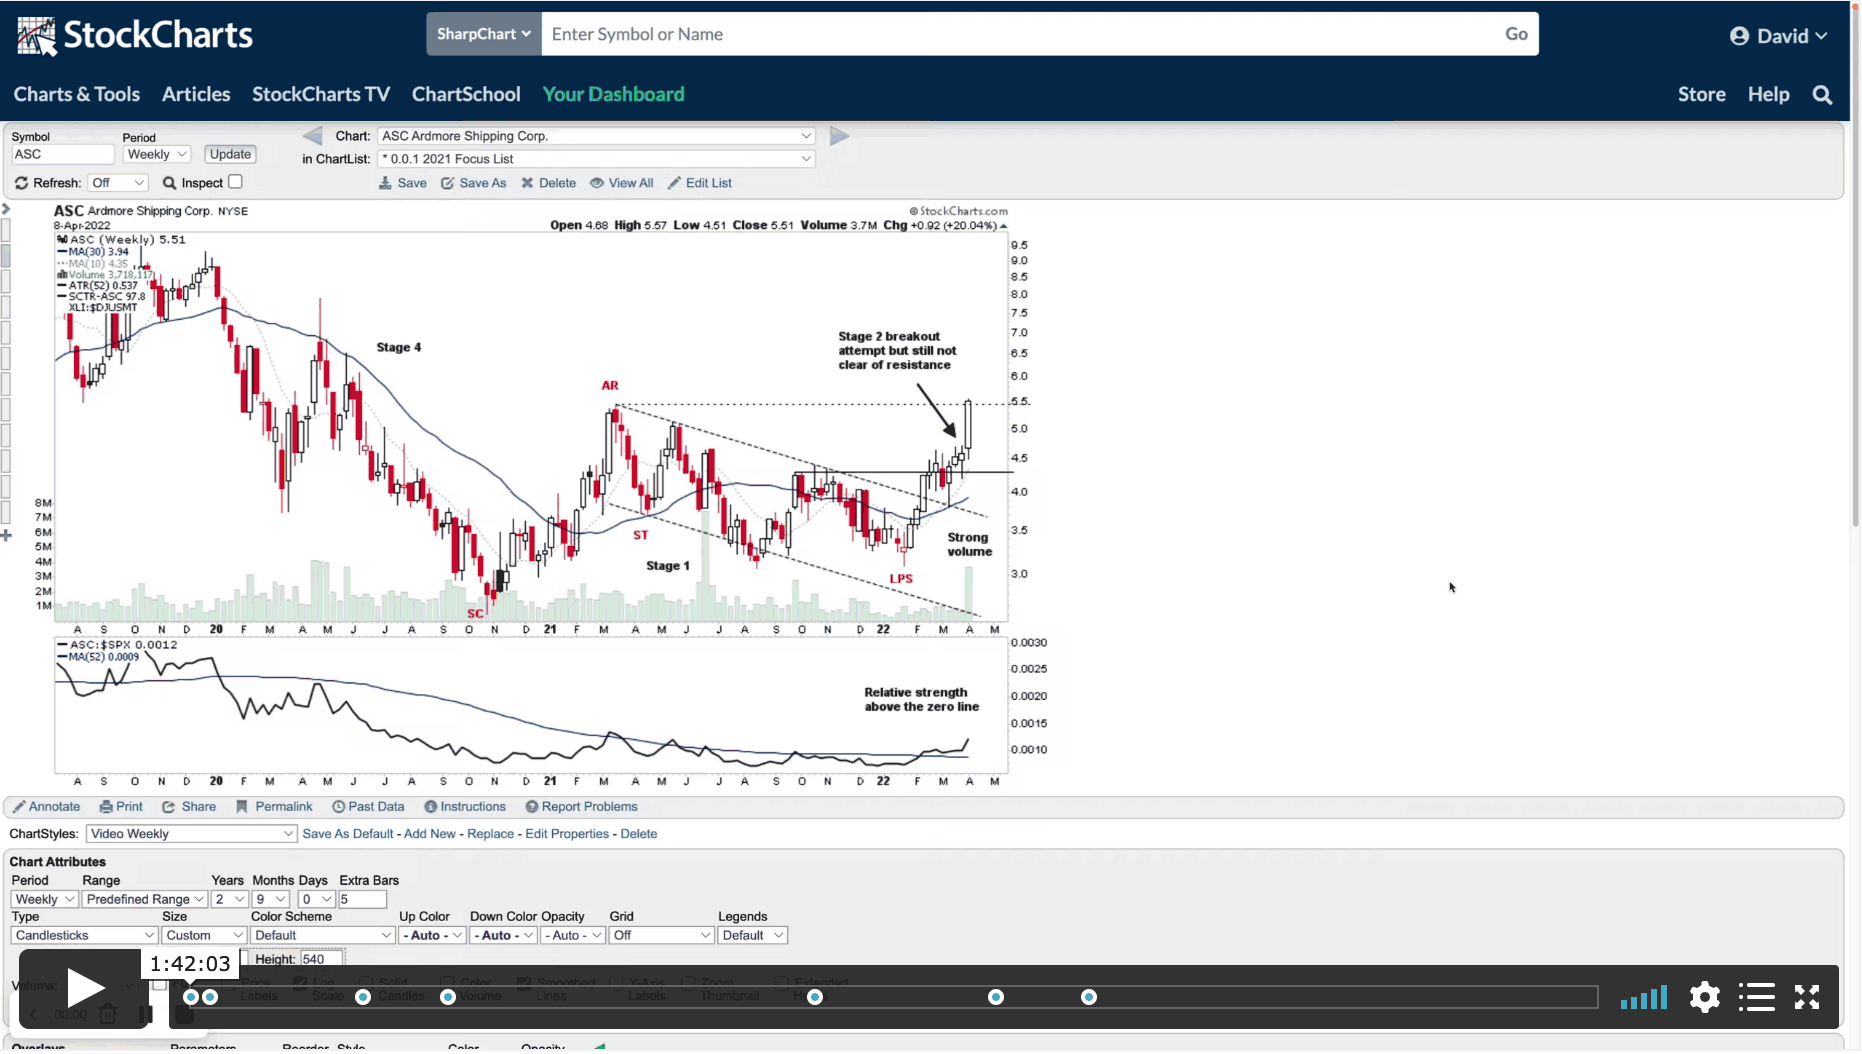
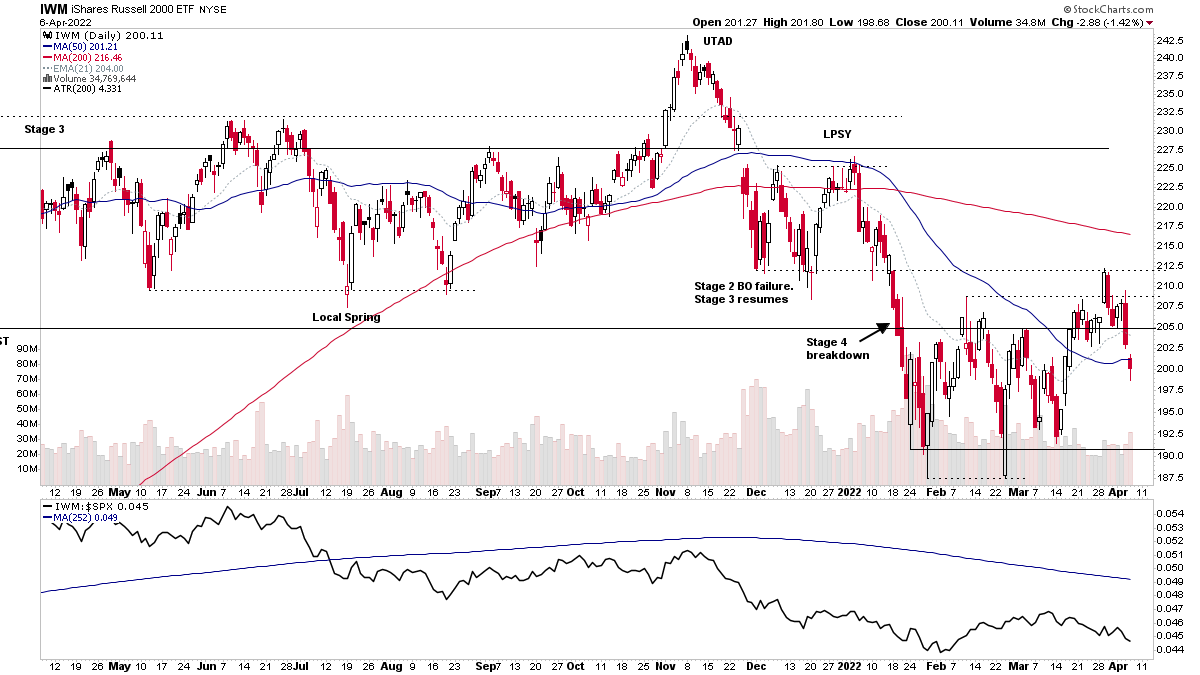
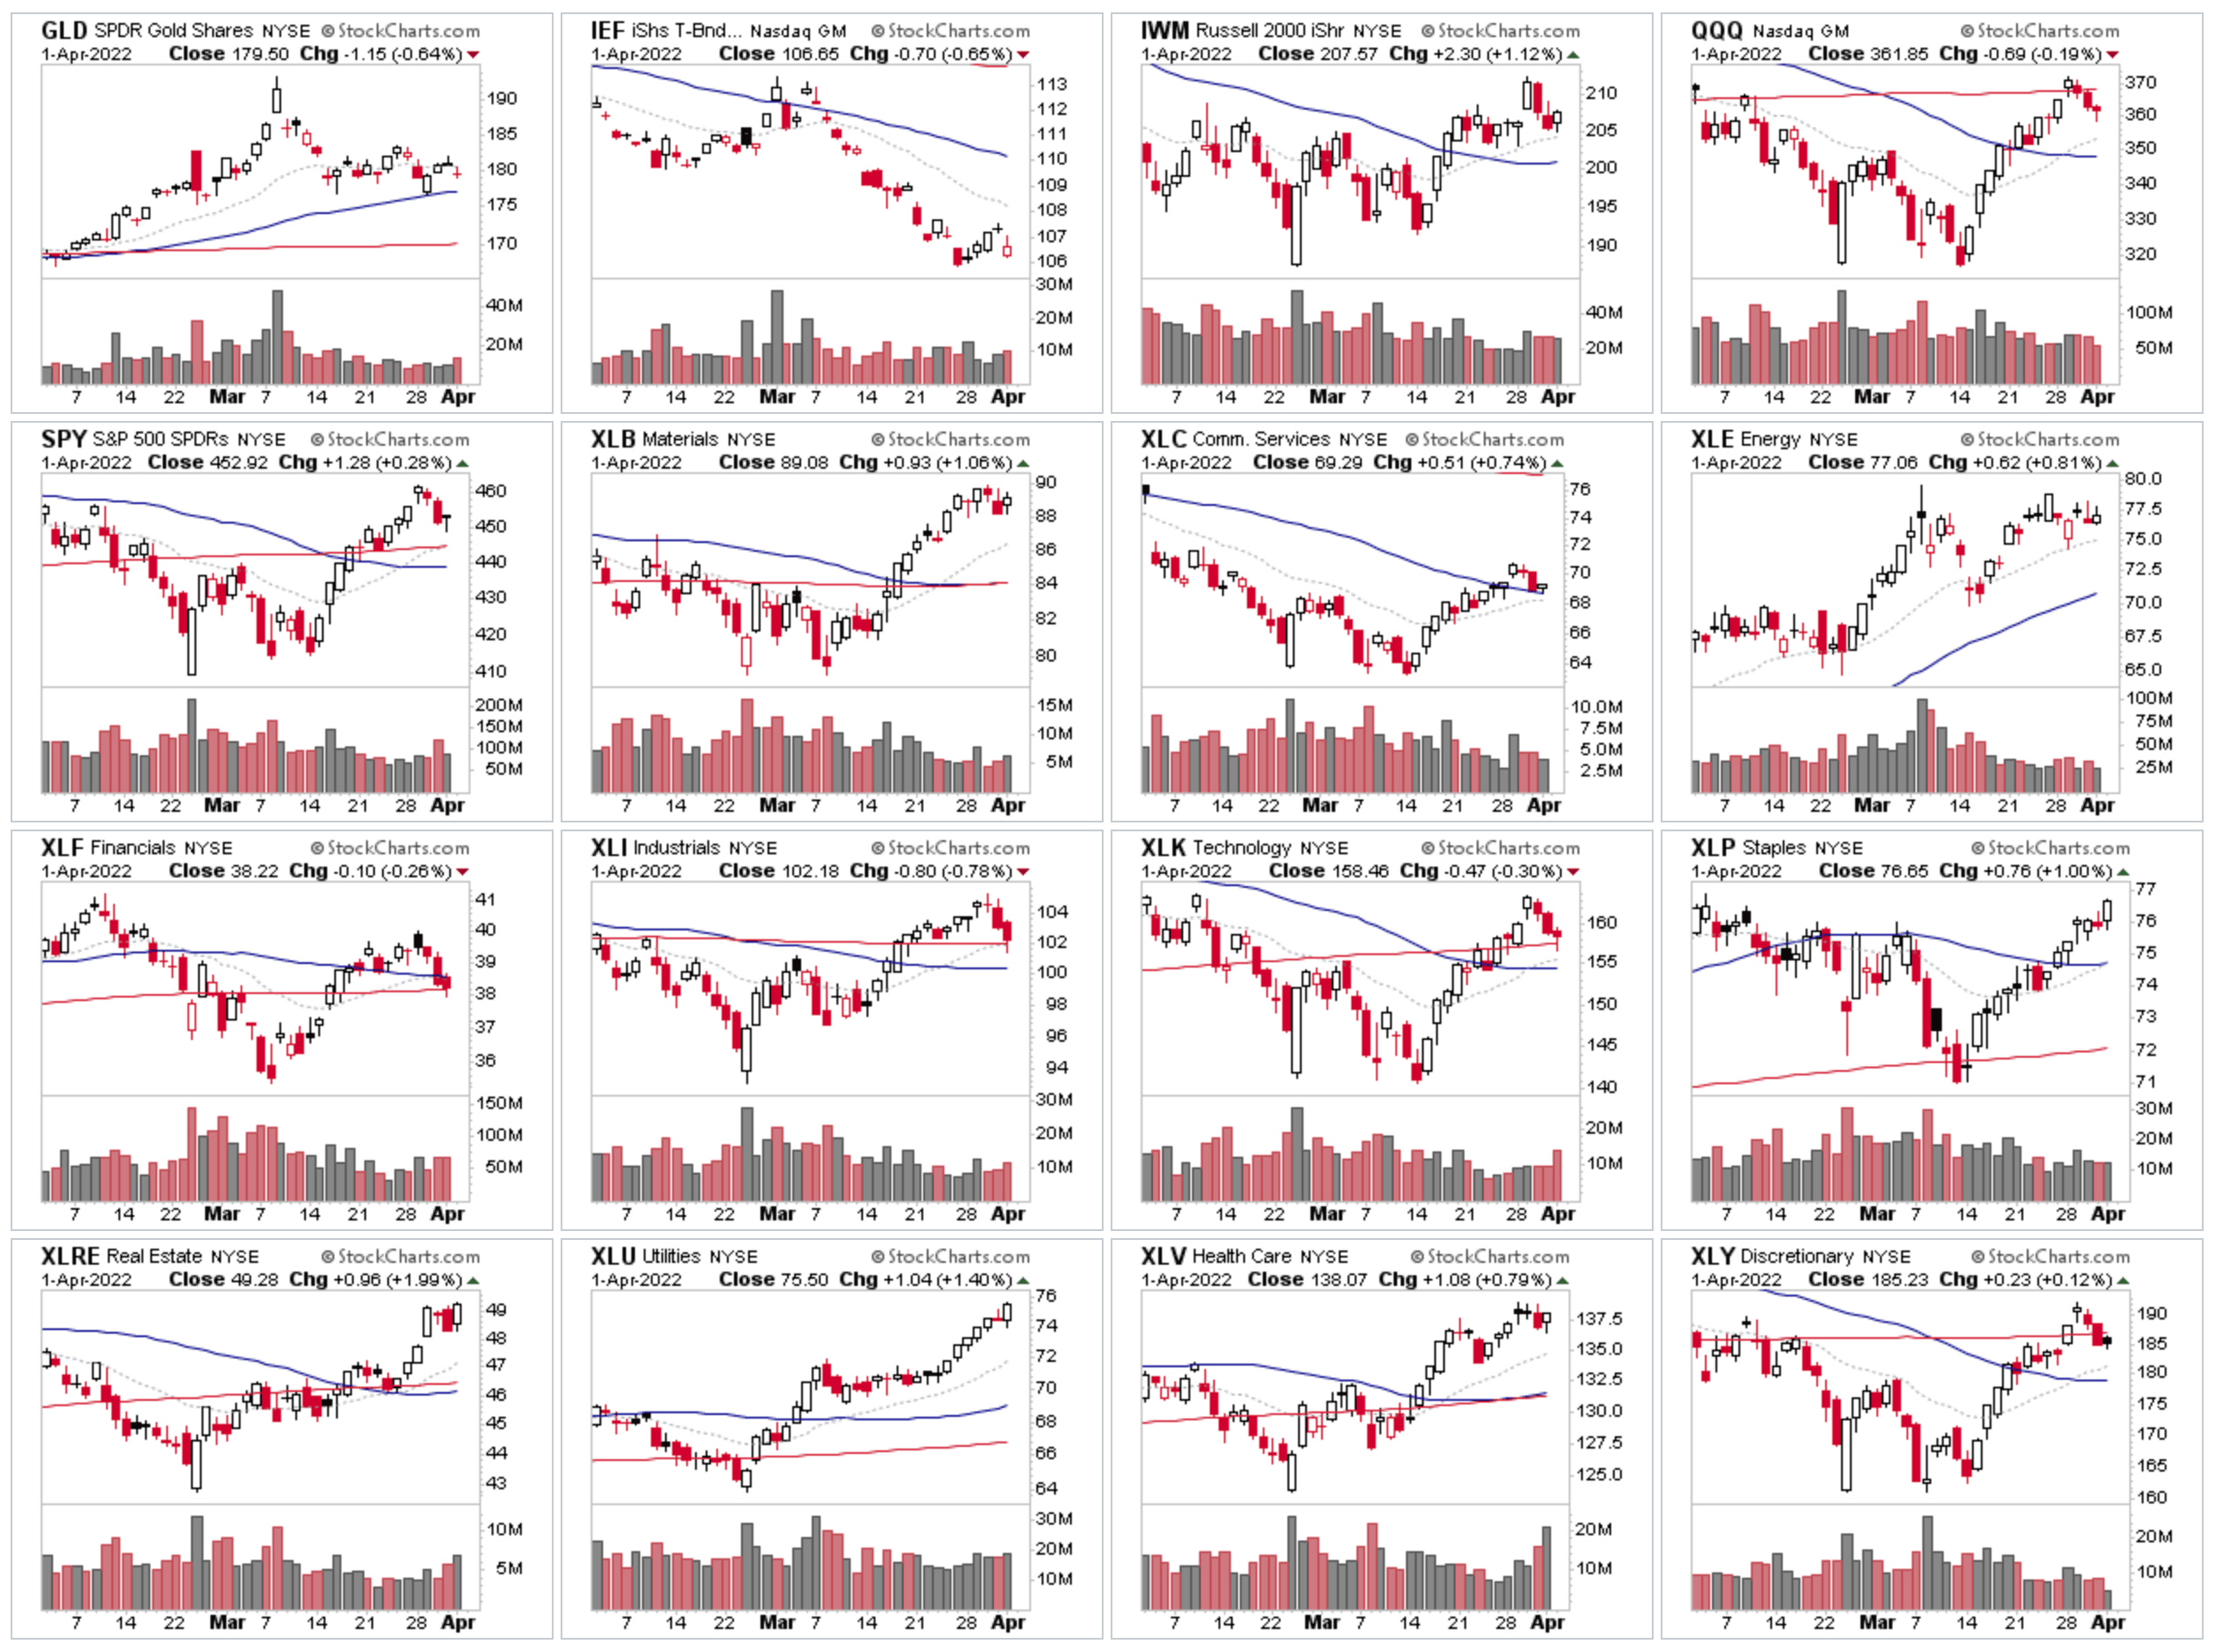
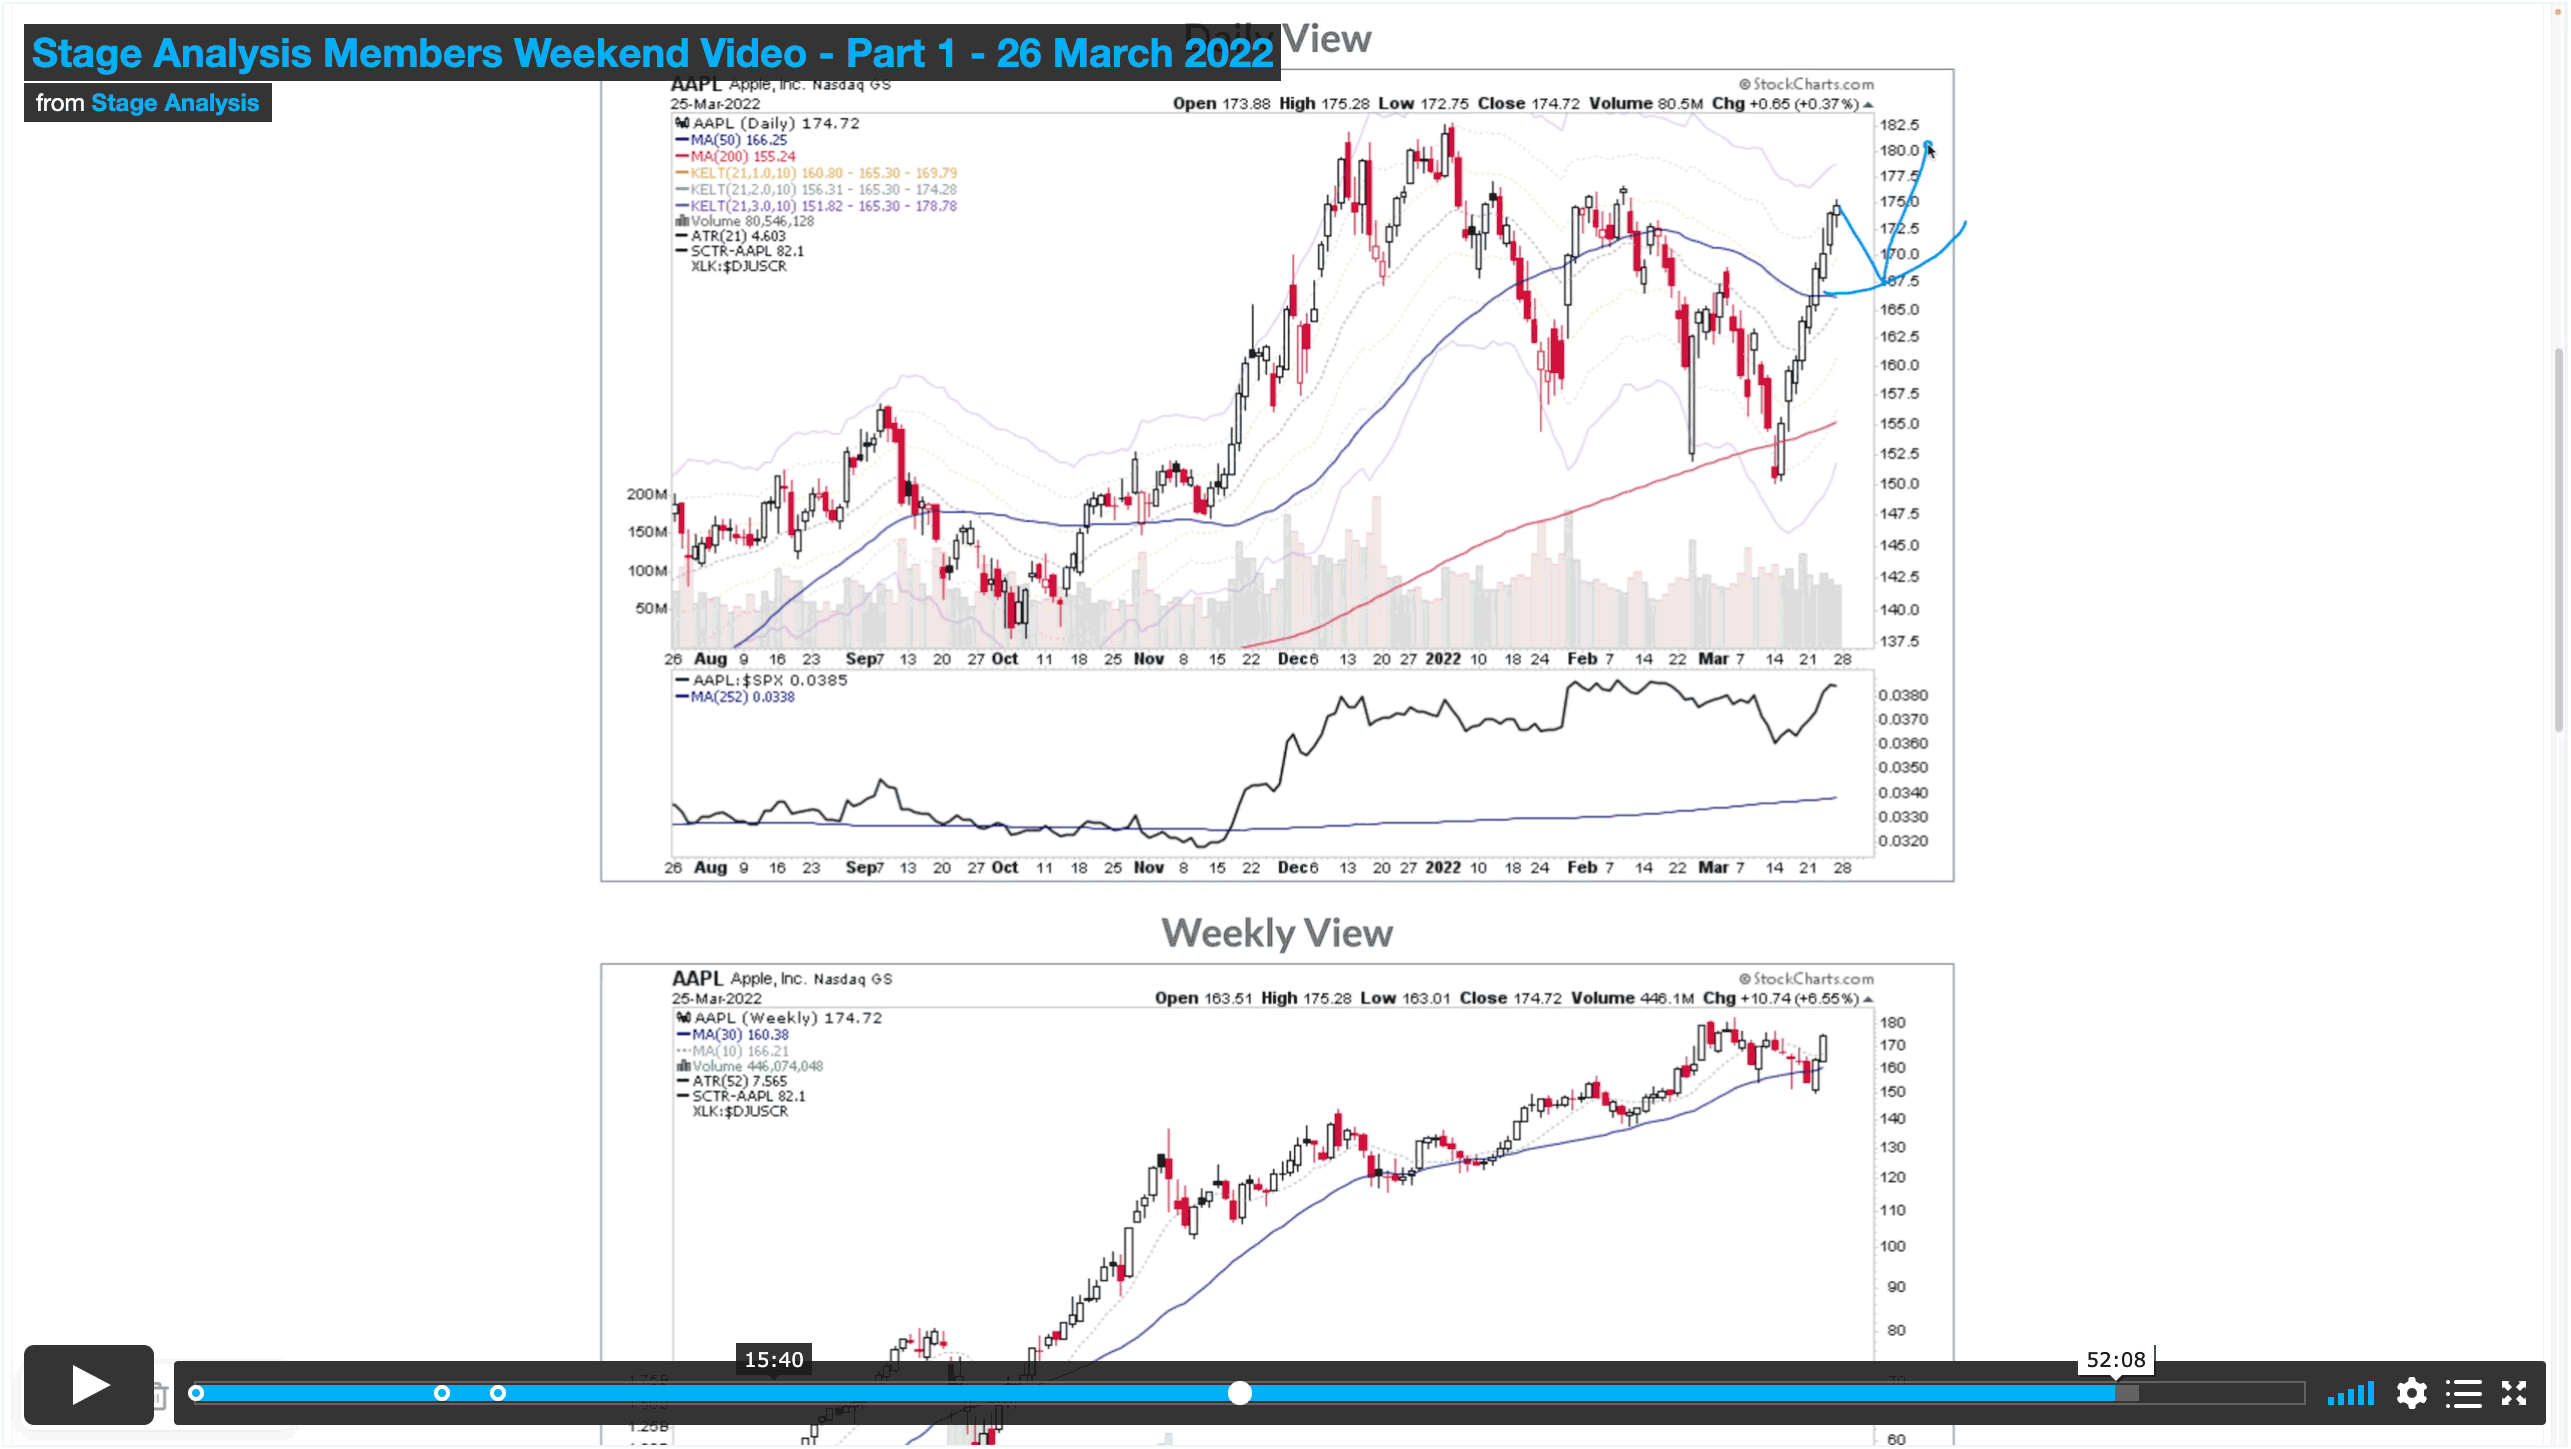
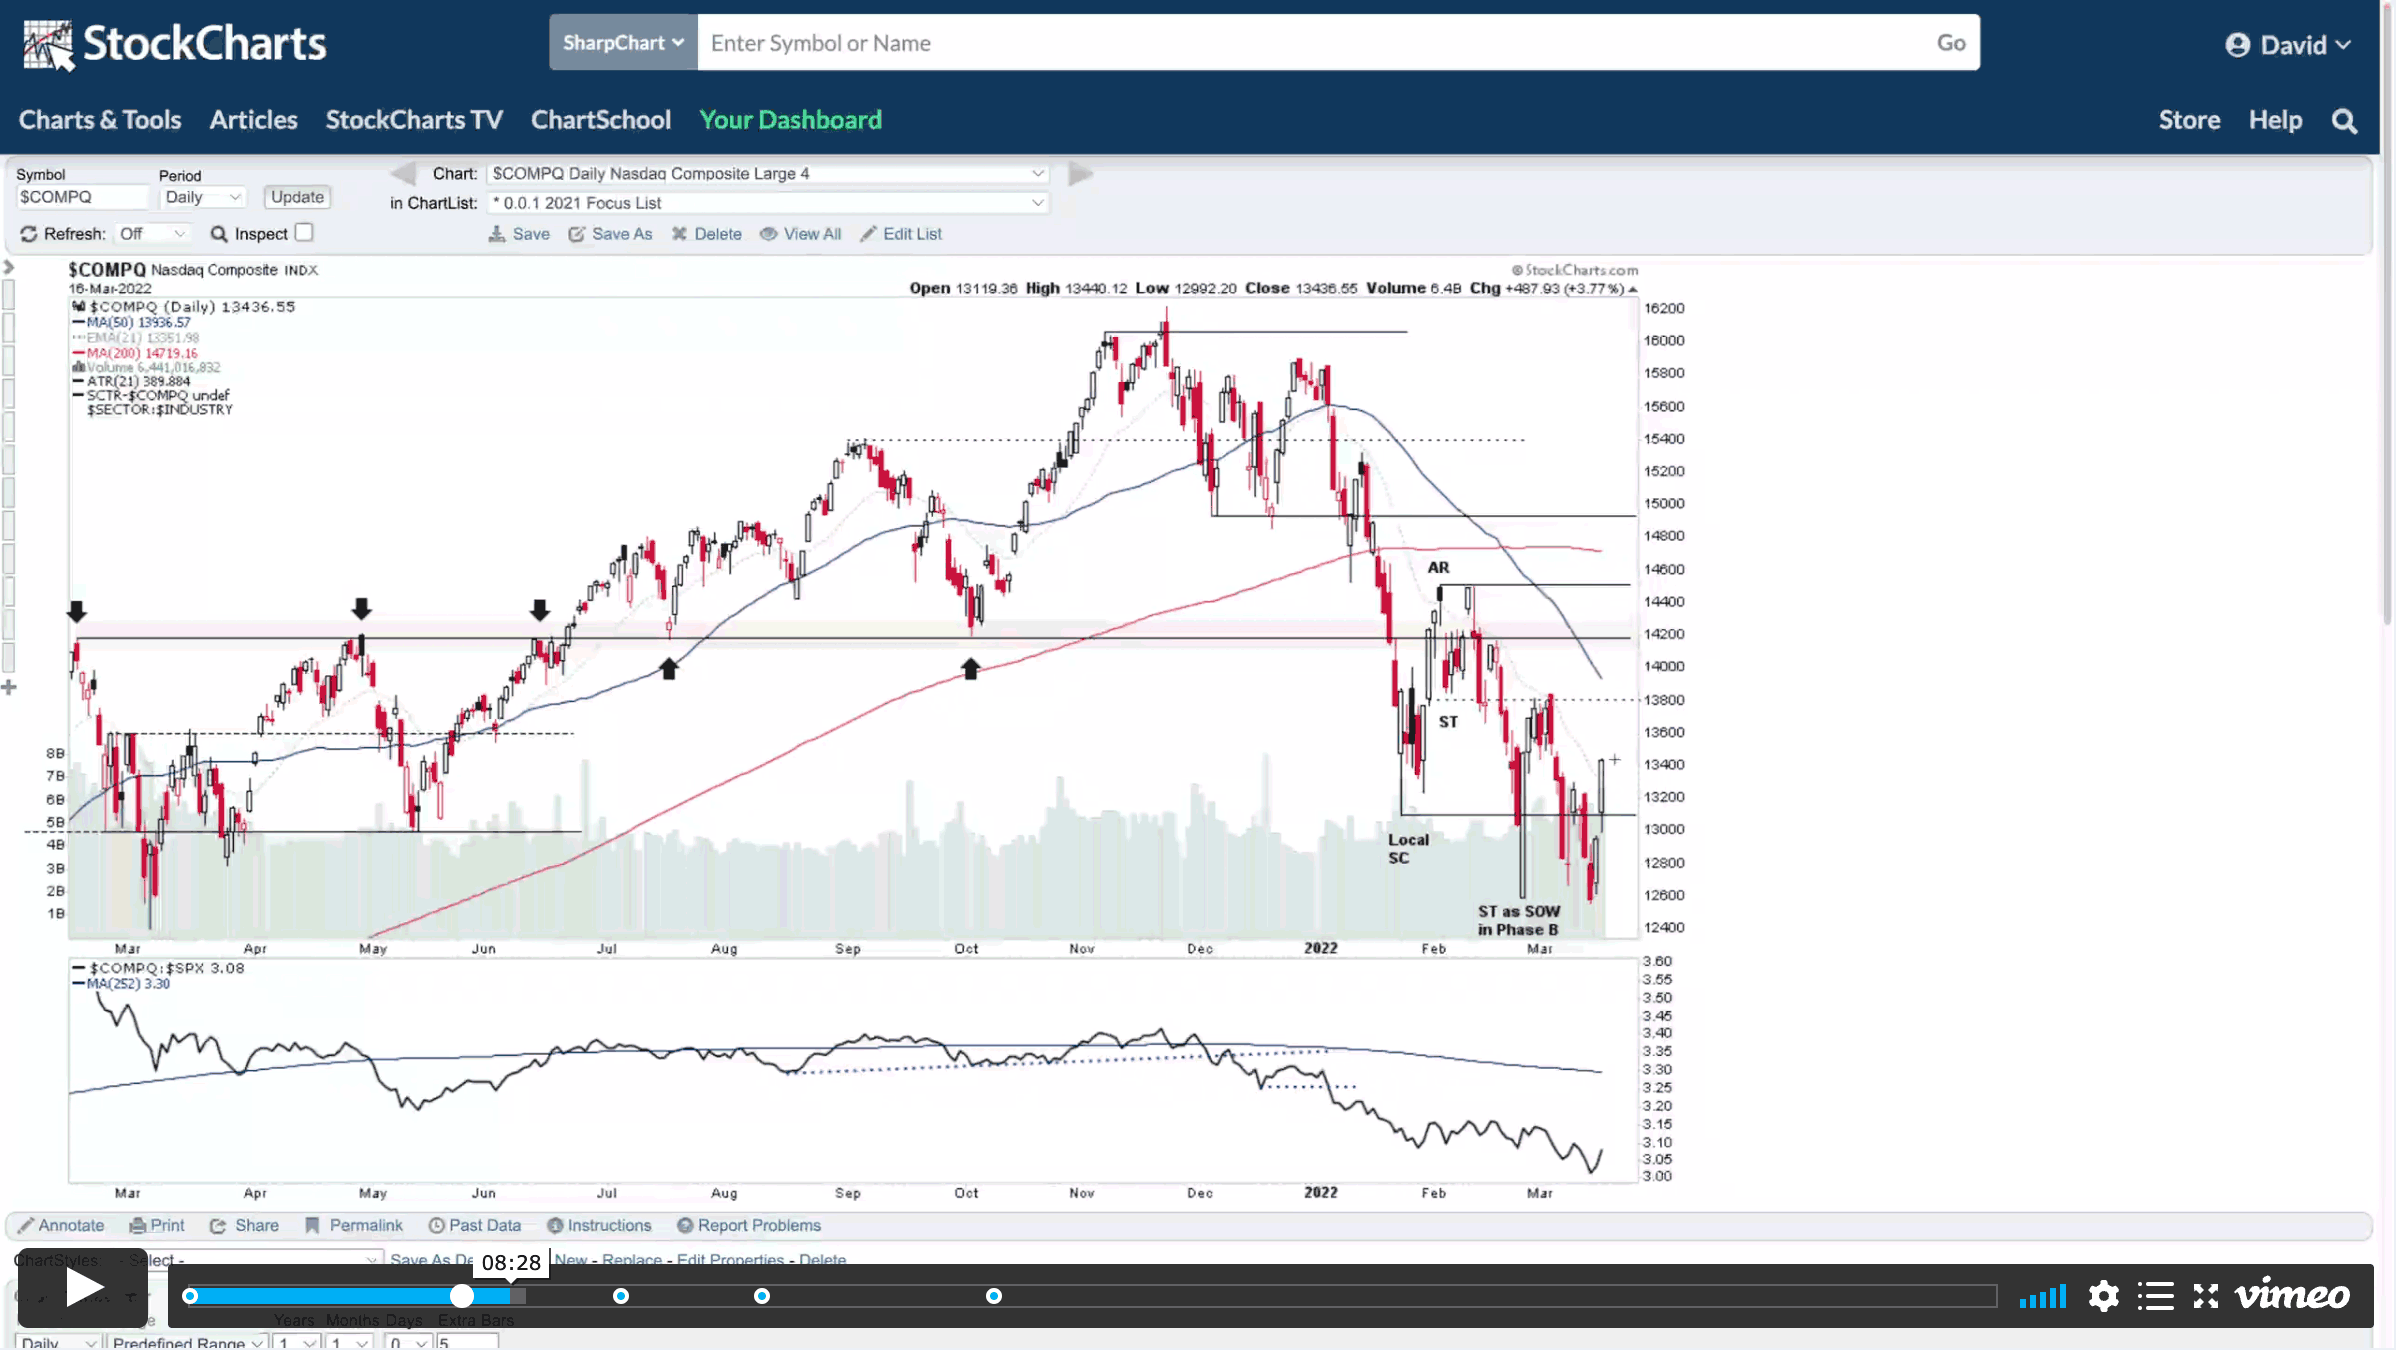
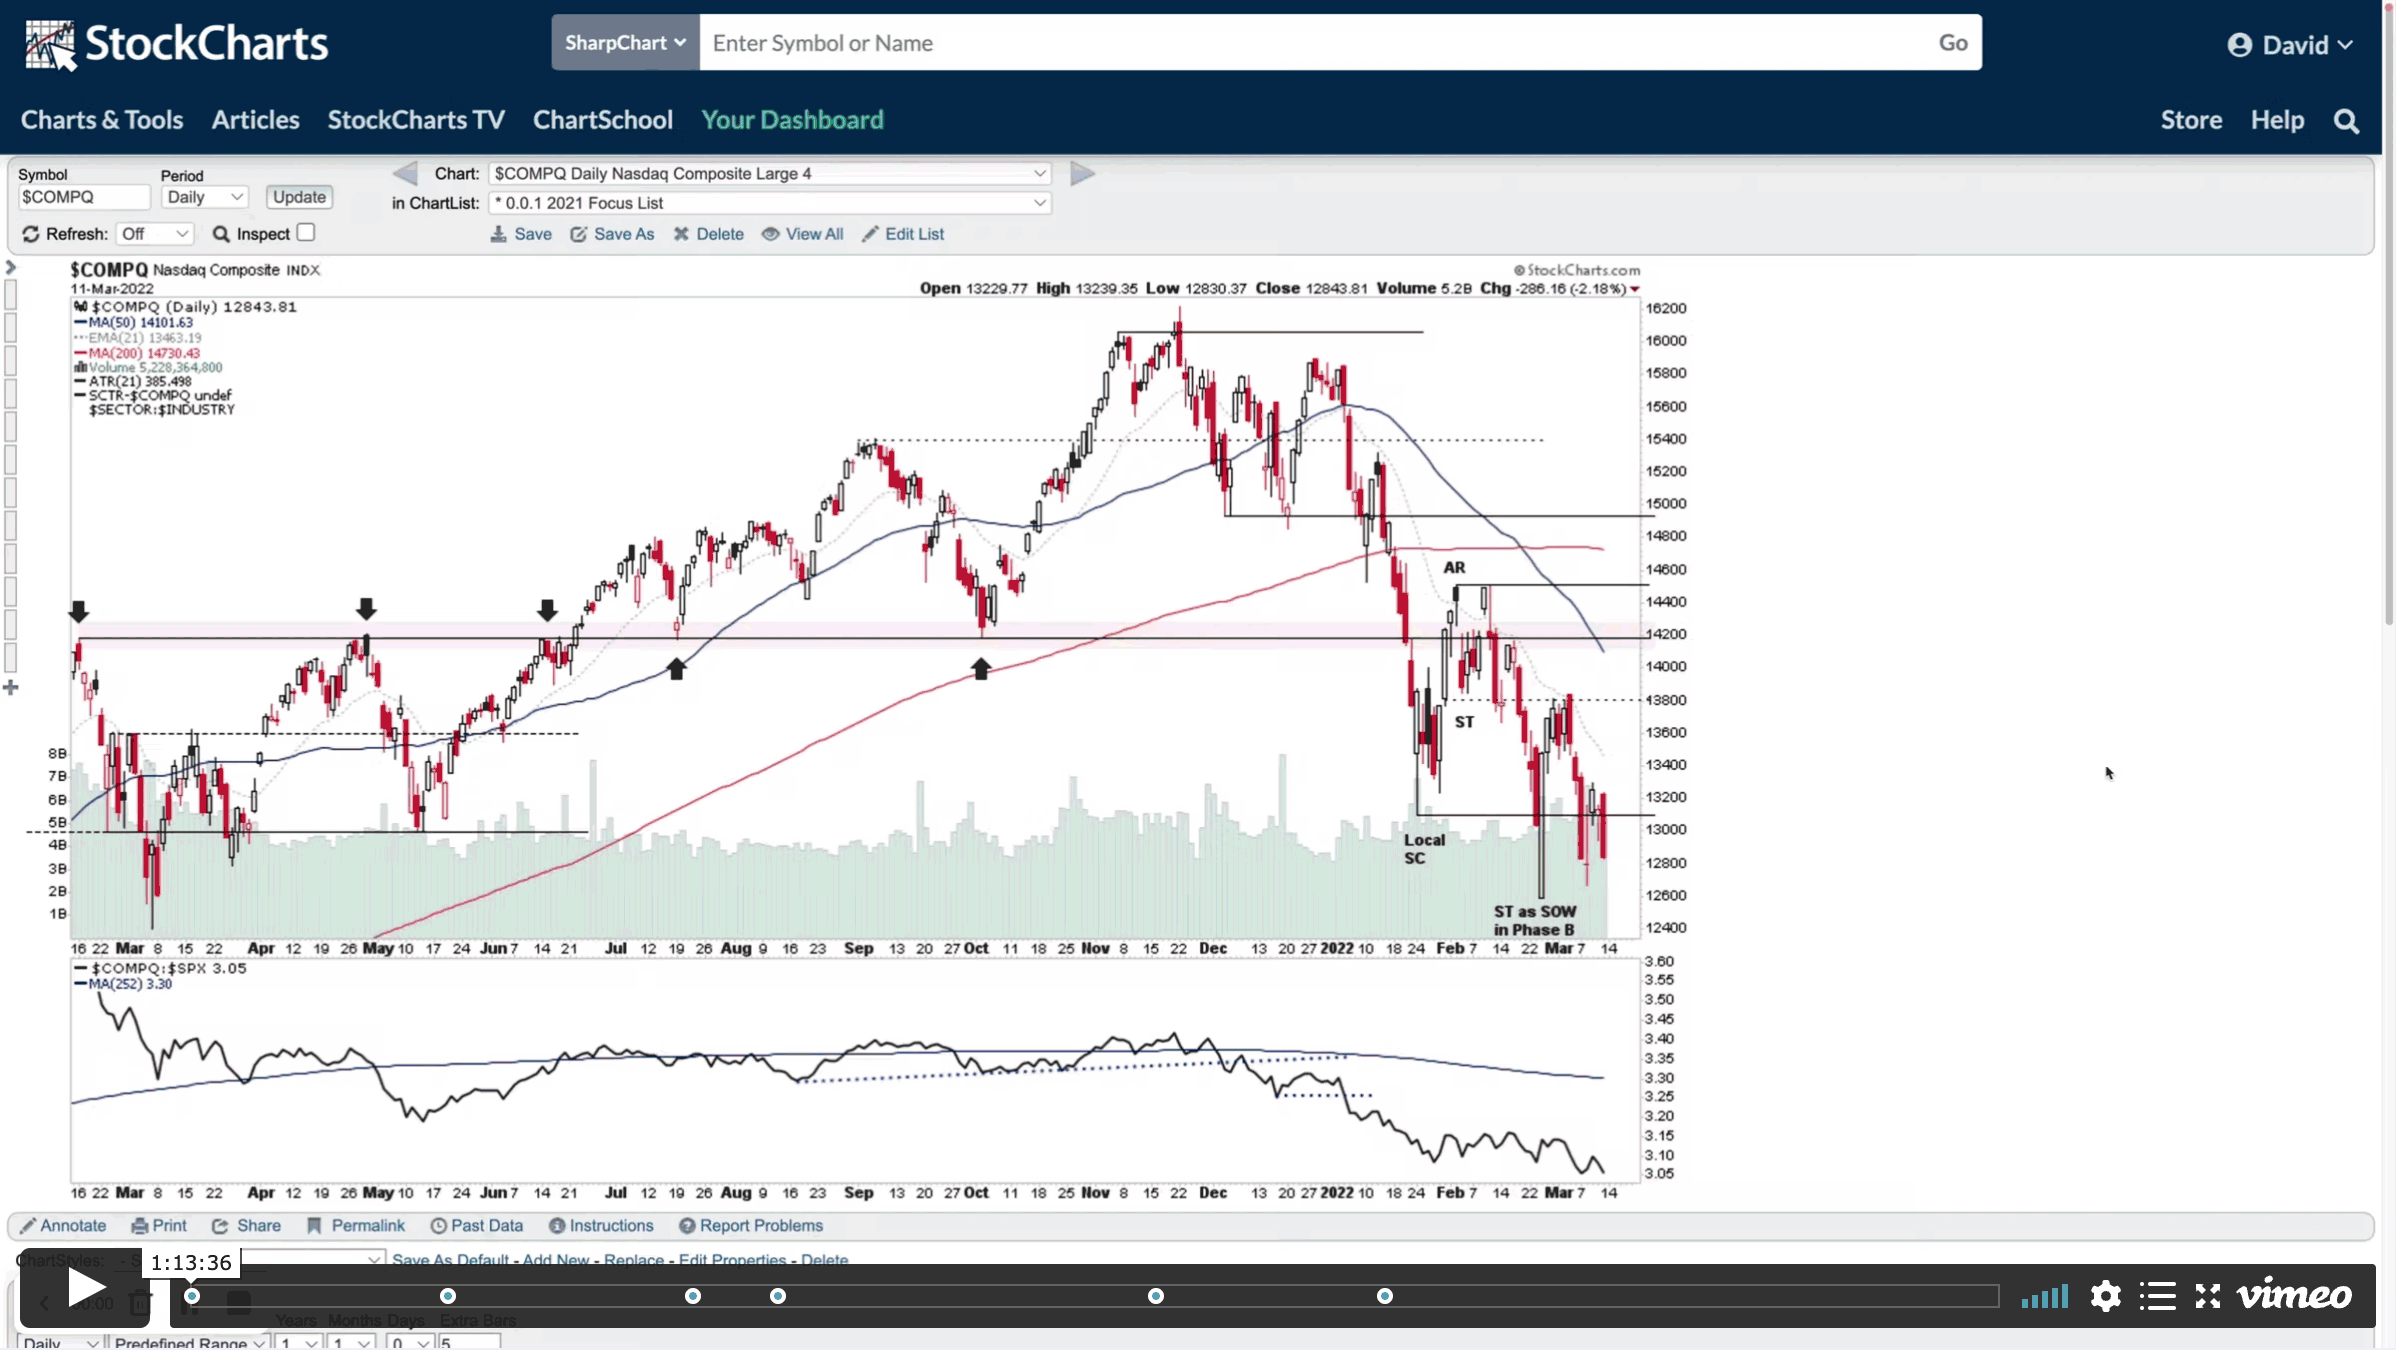
This weekends Stage Analysis Members Video features the Major Indexes – Nasdaq, S&P 500, Russell 2000, Sector Relative Strength, Market Breadth charts to determine the Weight of Evidence, Industry Group Relative Strength. A Group Focus on the Uranium Stocks and the US Stocks Watchlist in detail with marked up charts and explanations of the group themes and what I'm looking for in various stocks.
Read More
Blog
07 April, 2022
Stage Analysis Members Midweek Video - 6 April 2022
This weeks Members Midweek Video focuses on some of the recent areas of weakness, like the Semiconductors groups, plus brief reviews of some of other featured groups in the last few months – as well as the regular midweek features on the indexes, short term market breadth charts and the watchlist stocks in focus.
Read More
03 April, 2022
Stage Analysis Members Weekend Video - 3 April 2022 (1hr 24mins)
In this weekends members video I discuss the Stan Weinstein Interview on Twitter Spaces, as well as the regular content of the Major Indexes, Sectors Relative Strength Tables & Charts, Industry Group RS Tables and Themes, Market Breadth: Weight of Evidence, 2x Weekly Volume Stocks and the US Watchlist Stocks in detail.
Read More
26 March, 2022
Stage Analysis Members Weekend Video – Part 1 – 26 March 2022 (57 mins)
In Part 1 of the Stage Analysis Members Video I cover the Major Indexes (i.e. S&P 500, Nasdaq Composite, Russell 2000 and the VIX etc), US Sectors Relative Strength Rankings and charts, Market Breadth charts to determine the Weight of Evidence, and the US Stocks Industry Group Relative Strength Tables and the Groups in focus this week.
Read More
17 March, 2022
Stage Analysis Members Midweek Video - 16 March 2022 (47mins)
Members midweek video covering the market indexes, market breadth and US watchlist stocks in detail.
Read More
15 March, 2022
US Stocks Watchlist - 15 March 2022
There were 12 stocks for the US stocks watchlist today. Here's a small sample from the list: TMST, ATSG, JNPR, + 9 more...
Read More
14 March, 2022
Nasdaq February Lows Tested and the US Stocks Watchlist - 14 March 2022
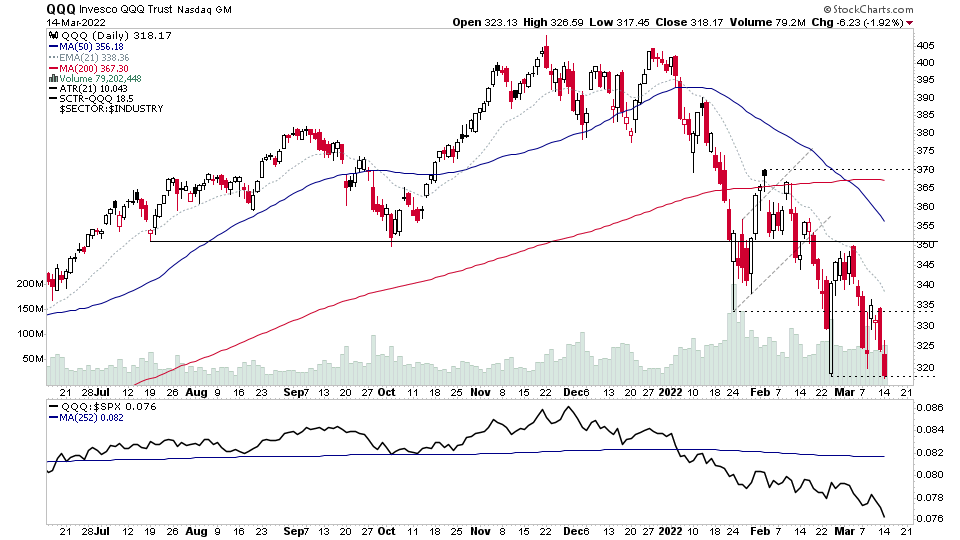
I talked about the Major Indexes Attempting to Breakdown into Stage 4 in a previous post. Today we saw some further weakness in the market, such as the Nasdaq 100 (attached) as the recent leading groups that had been running strongly in Stage 2, started to unwind, following short term climatic action in a number of areas such as Oil, Commodities and Precious Metals last week.
Read More
13 March, 2022
Stage Analysis Members Weekend Video - 13 March 2022
Weekend Stage Analysis Members Video covering the Major Indexes, Commodities, ETFs in focus, the Sectors and Industry Group Relative Strength, Market Breadth Update and finally the US Stocks Watchlist in detail where I mark up the price and volume action that I'm looking for in and the developing themes from the watchlist.
Read More
12 March, 2022
Major US Indexes and Sectors RS
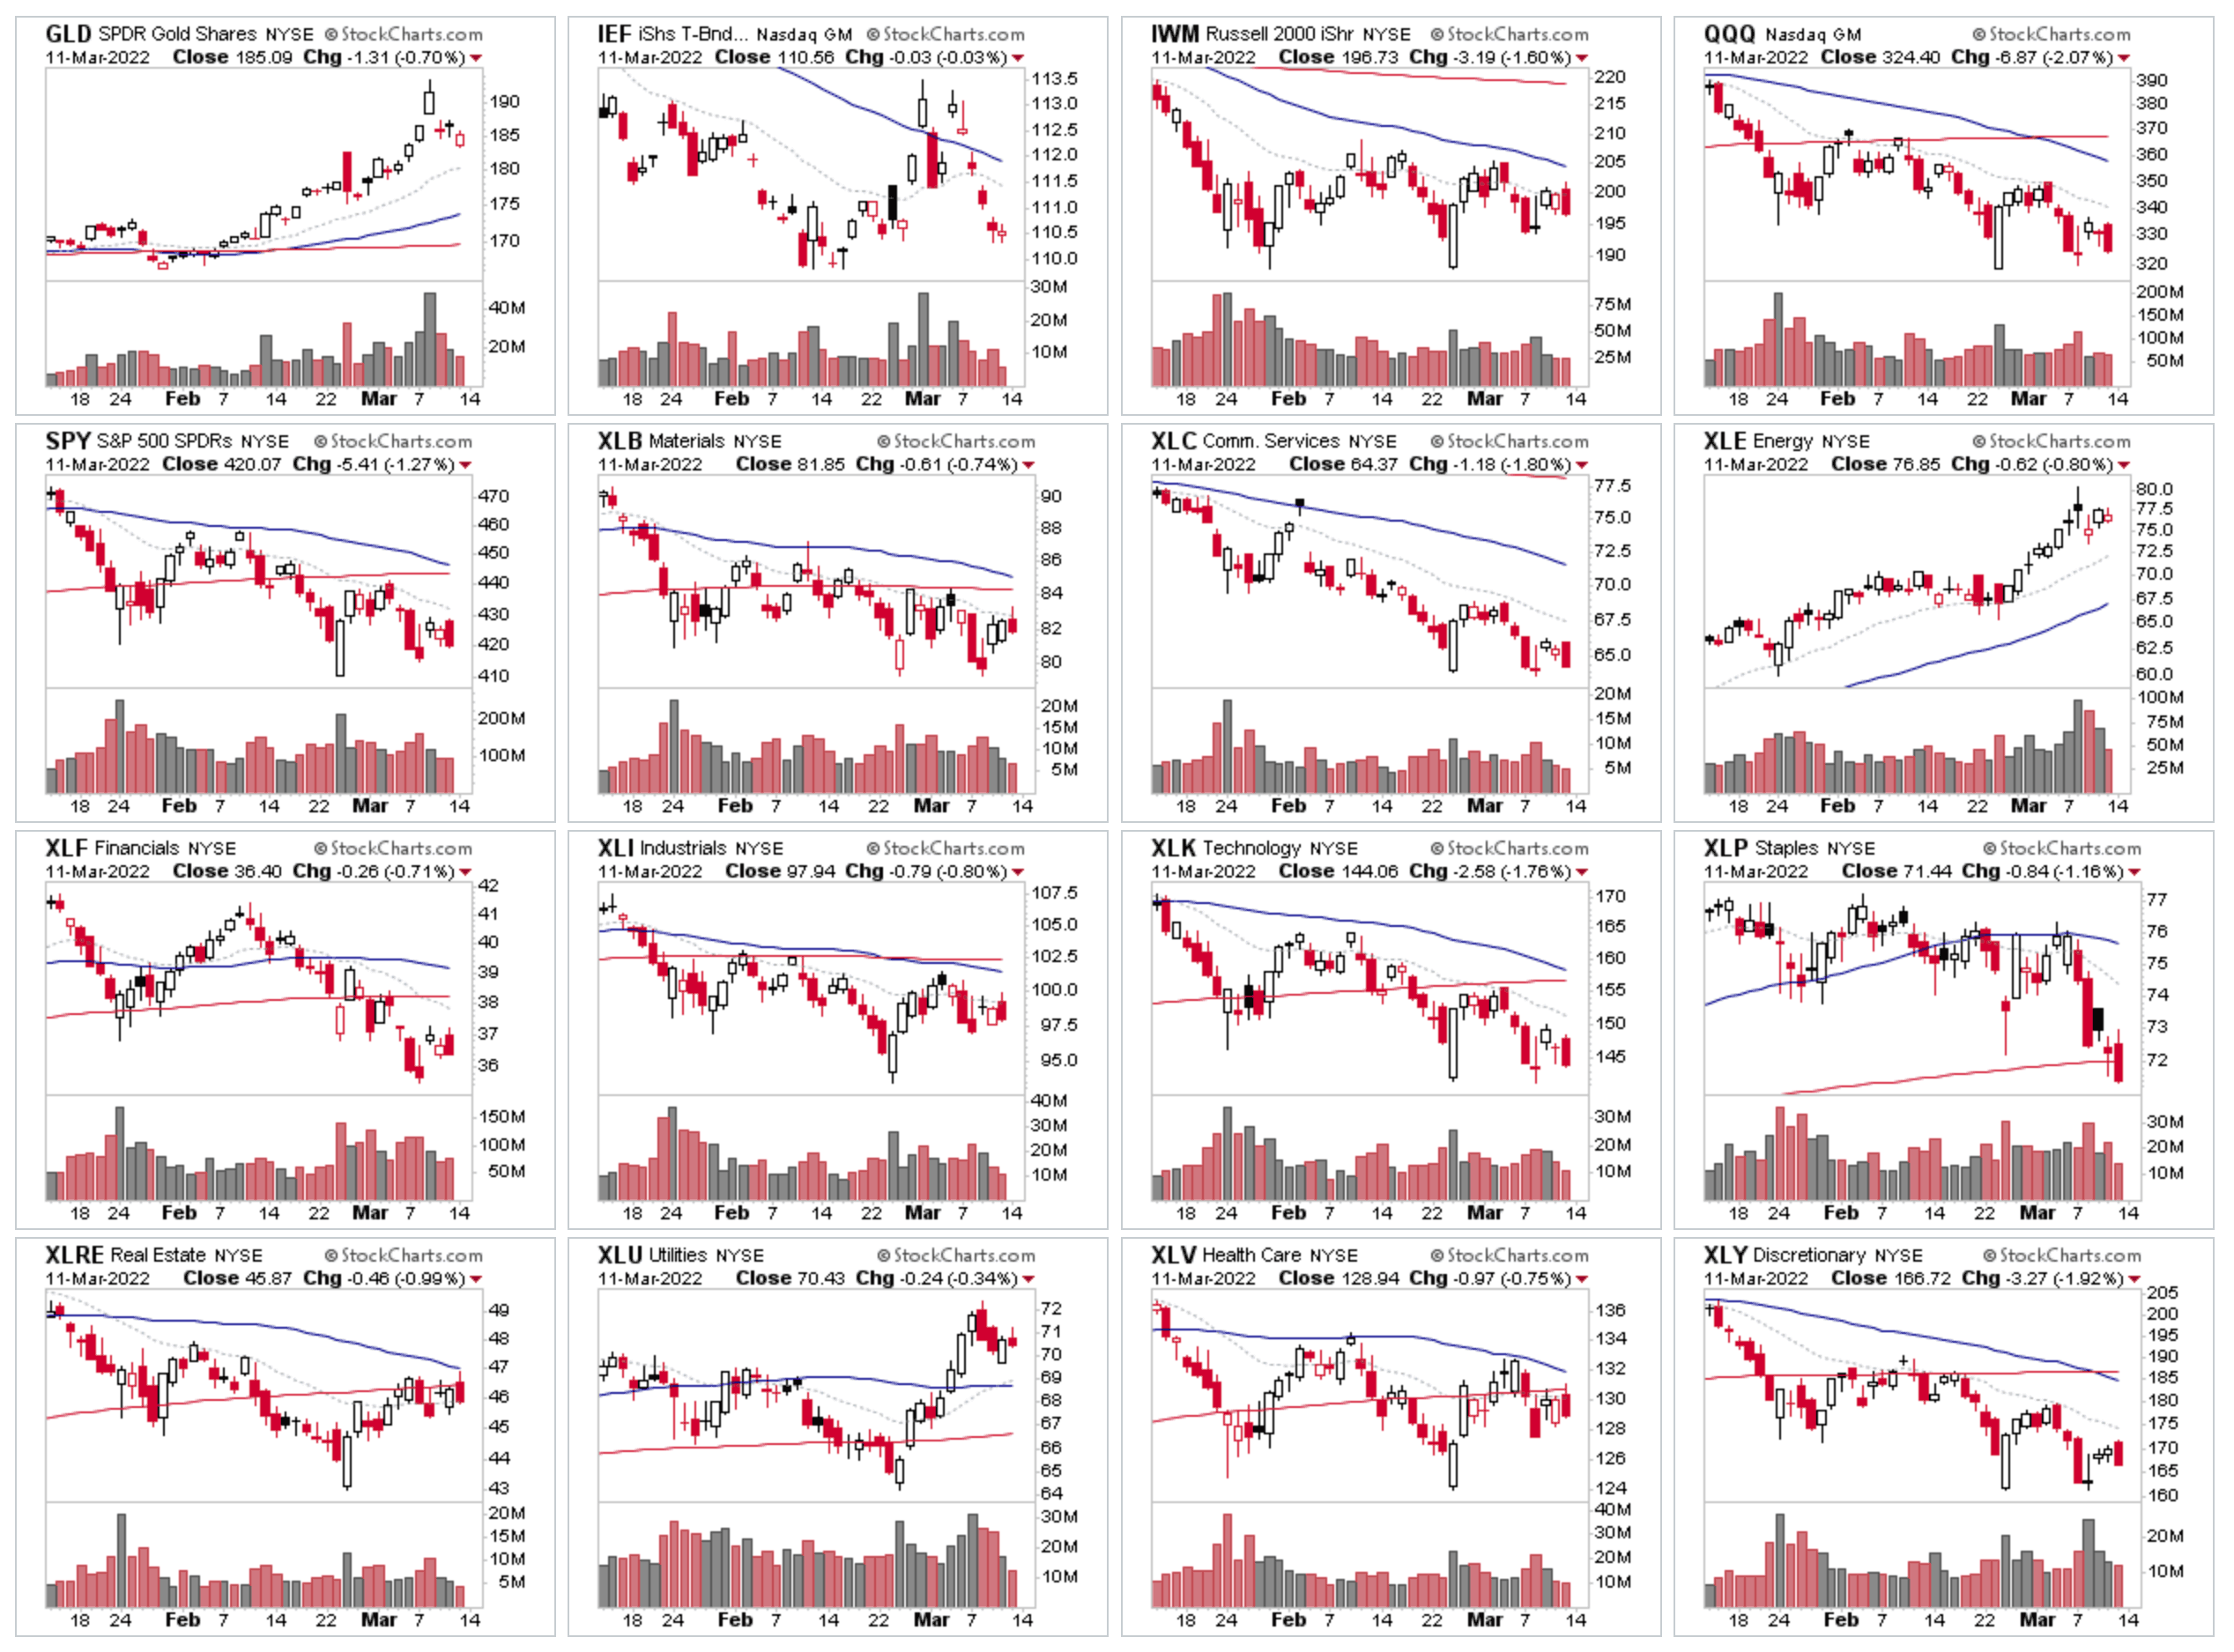
Energy and Gold were the only positive areas this week with Consumer Staples sector down the most on the week followed by the Nasdaq 100 and the Technology sector - both of which are on the edge of tipping into Stage 4.
Read More
06 March, 2022
Stage Analysis Members Weekend Video - Part 1 - 6 March 2022
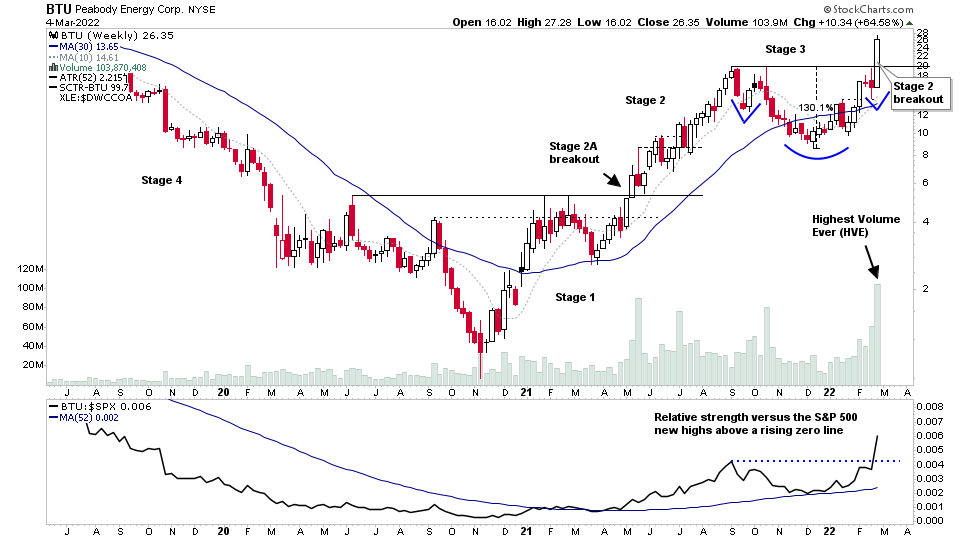
Stage Analysis Members Video covering - BTU Stage 2 Breakout Analysis and Targets. Group Focus on Coal, Defense, Cybersecurity. Major Indexes review: i.e. S&P 500, Nasdaq, Russell 2000 and more Market Breadth Update to Determine the Current Weight of Evidence
Read More

