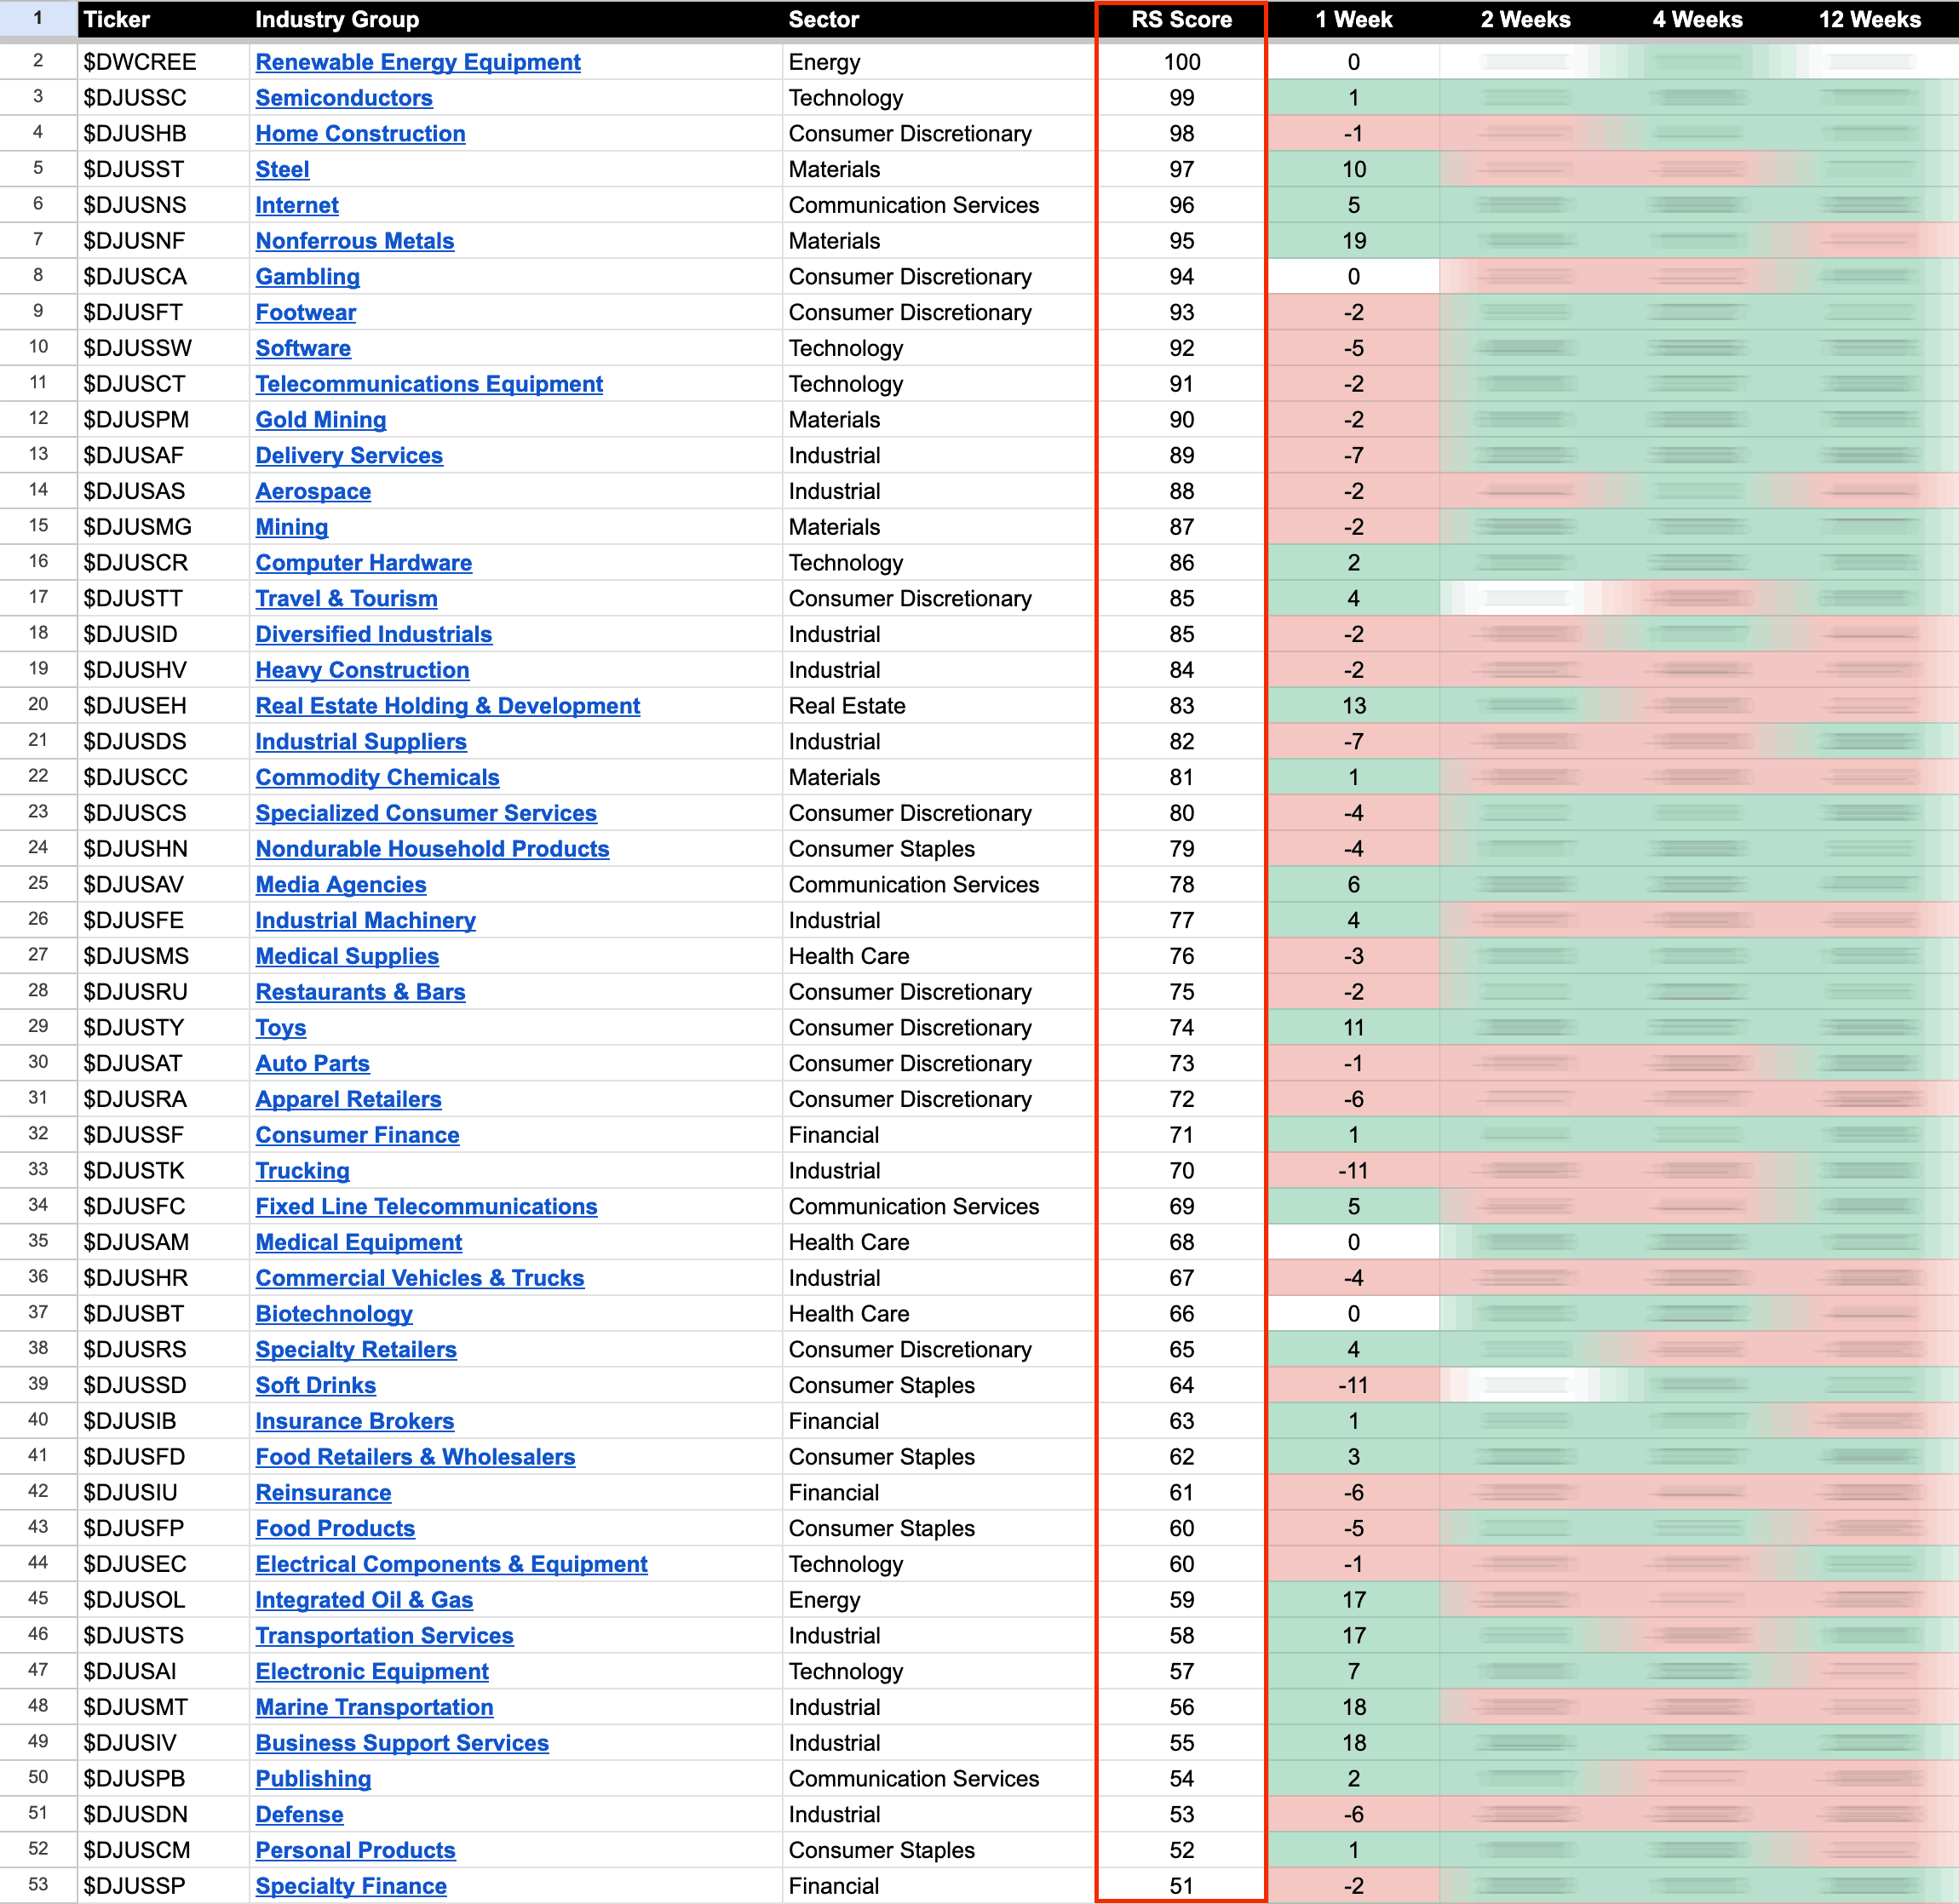
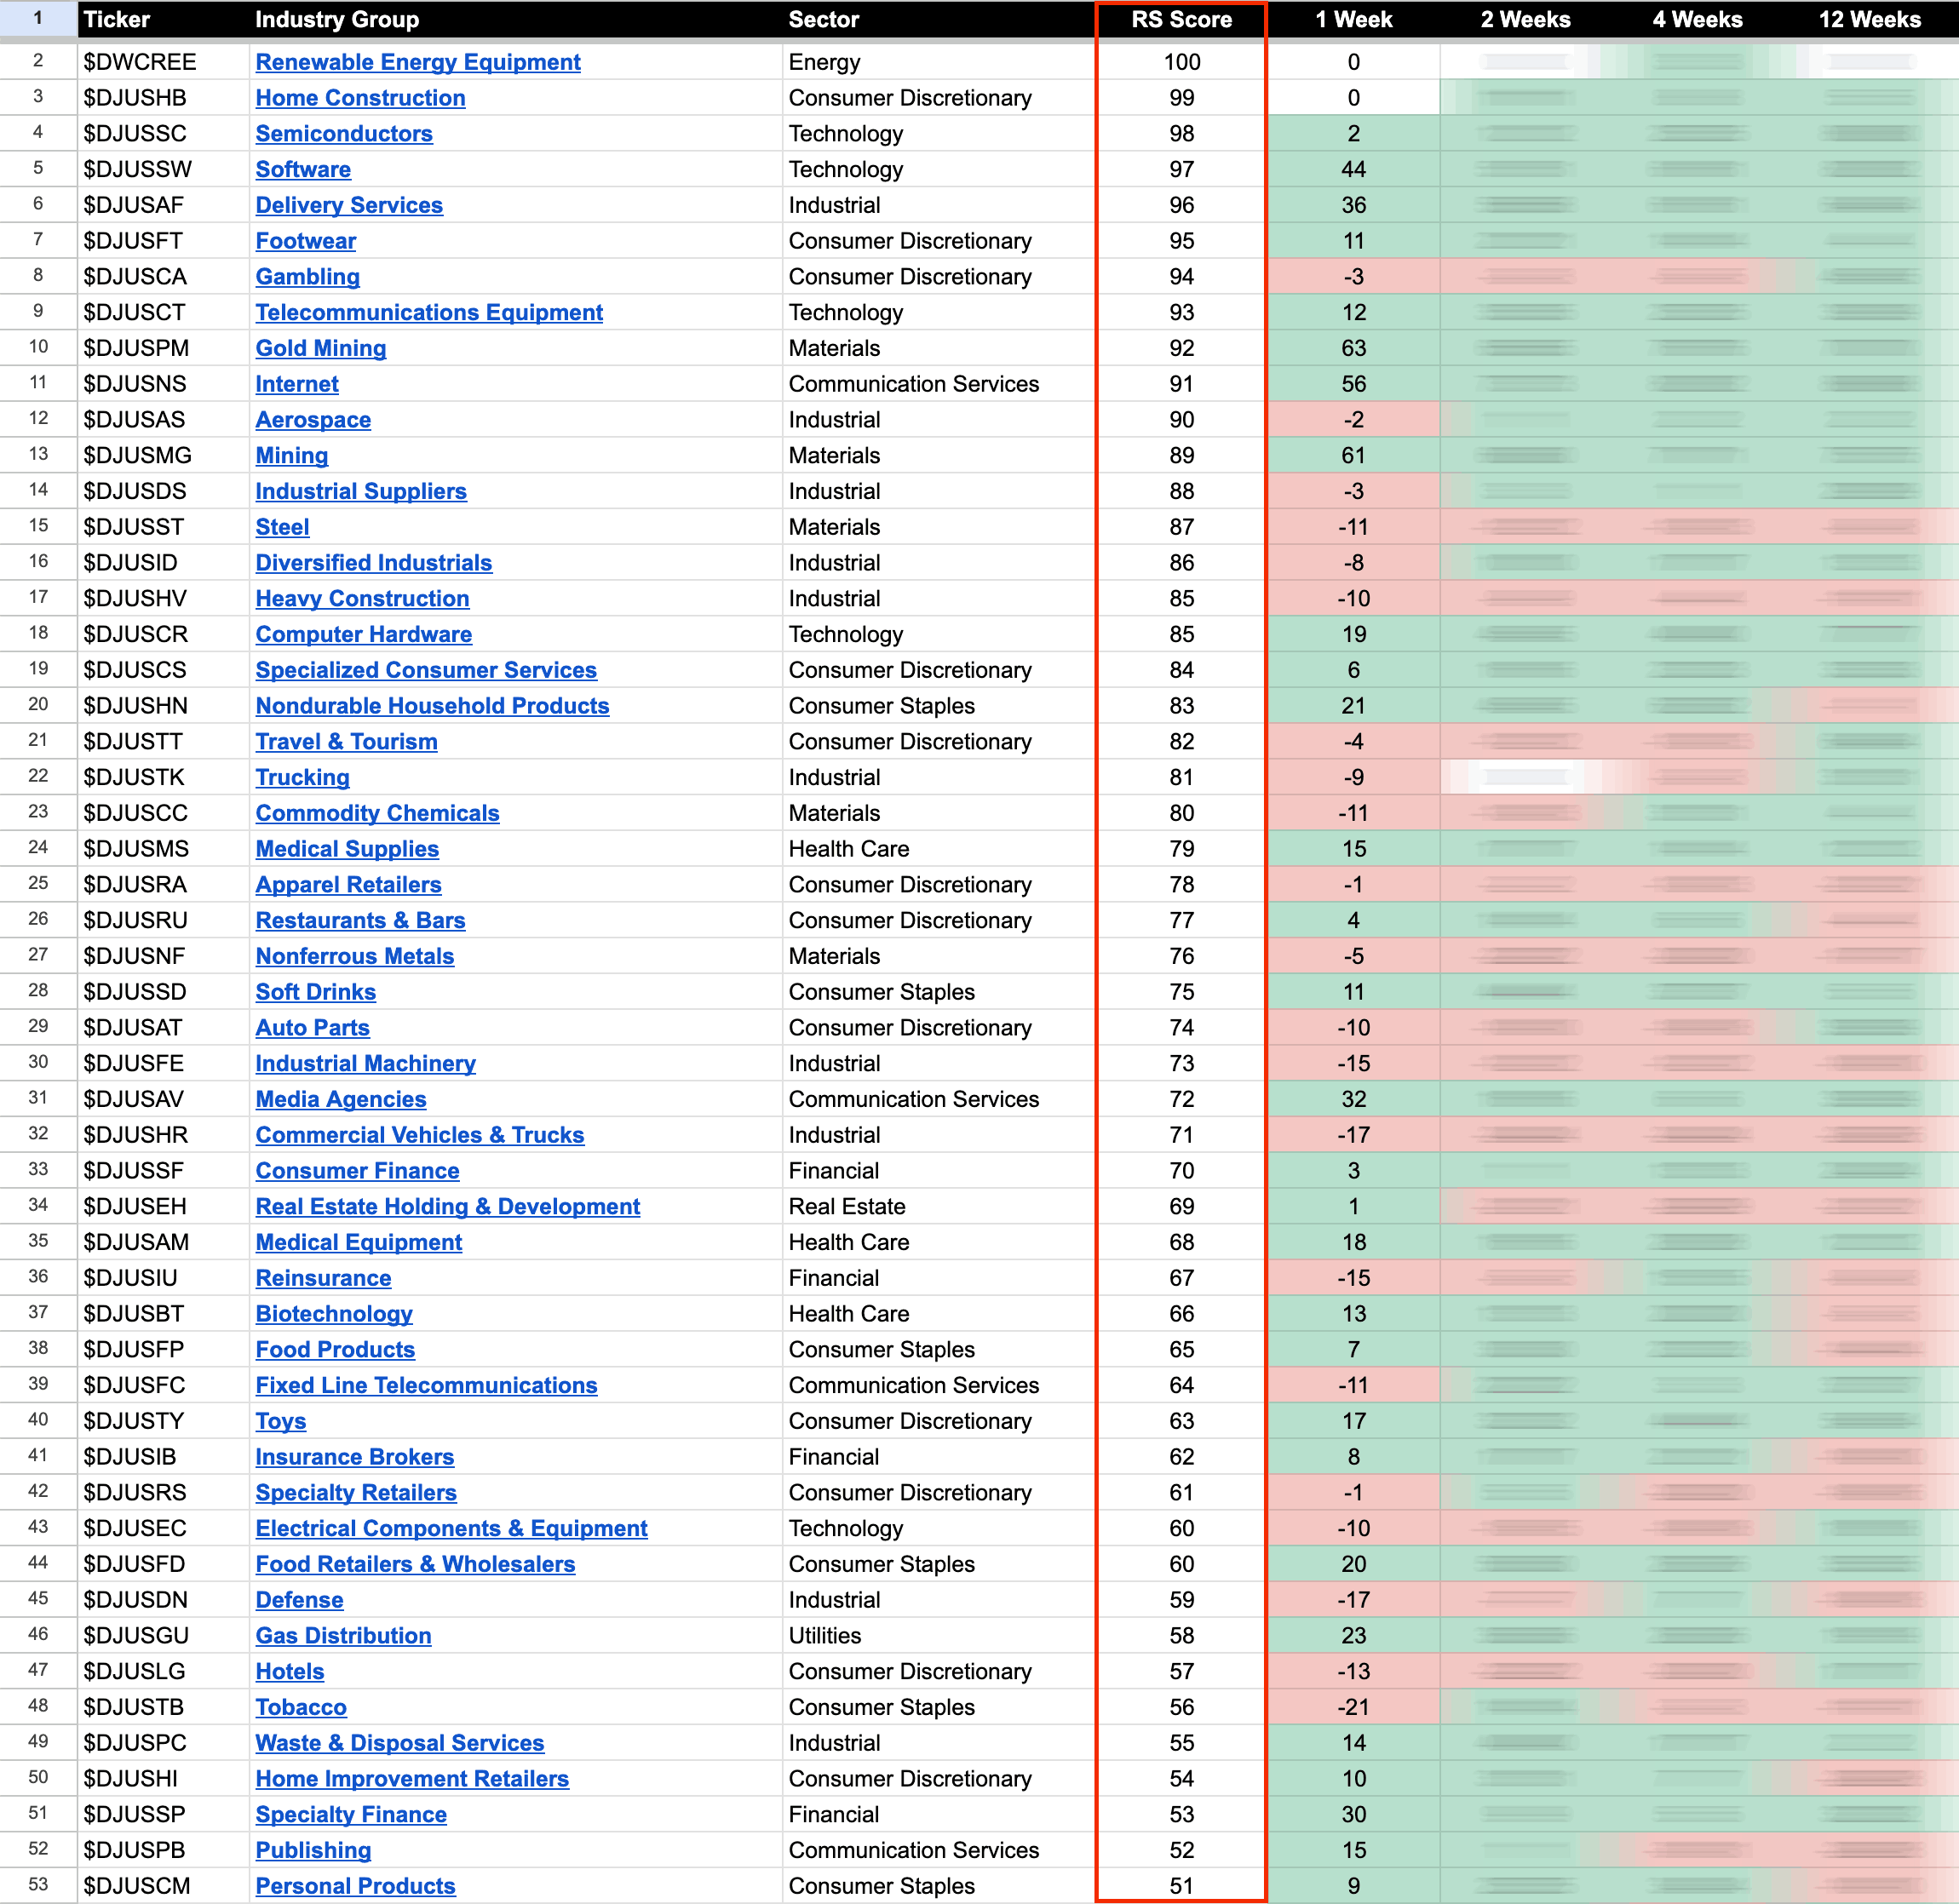
The purpose of the Relative Strength (RS) tables is to track the short, medium and long term RS changes of the individual groups to find the new leadership earlier than the crowd...
Read More
Blog
24 March, 2023
US Stocks Industry Groups Relative Strength Rankings
23 March, 2023
US Stocks Watchlist – 23 March 2023
One of the primary purposes of the daily watchlist scans is as alternative form of market breadth, as by scanning the market daily and looking for stocks displaying the characteristics of Stage 1 and Stage 2. It gives a really good idea of the overall market health...
Read More
21 March, 2023
S&P 500 Divergence and the US Stocks Watchlist – 21 March 2023
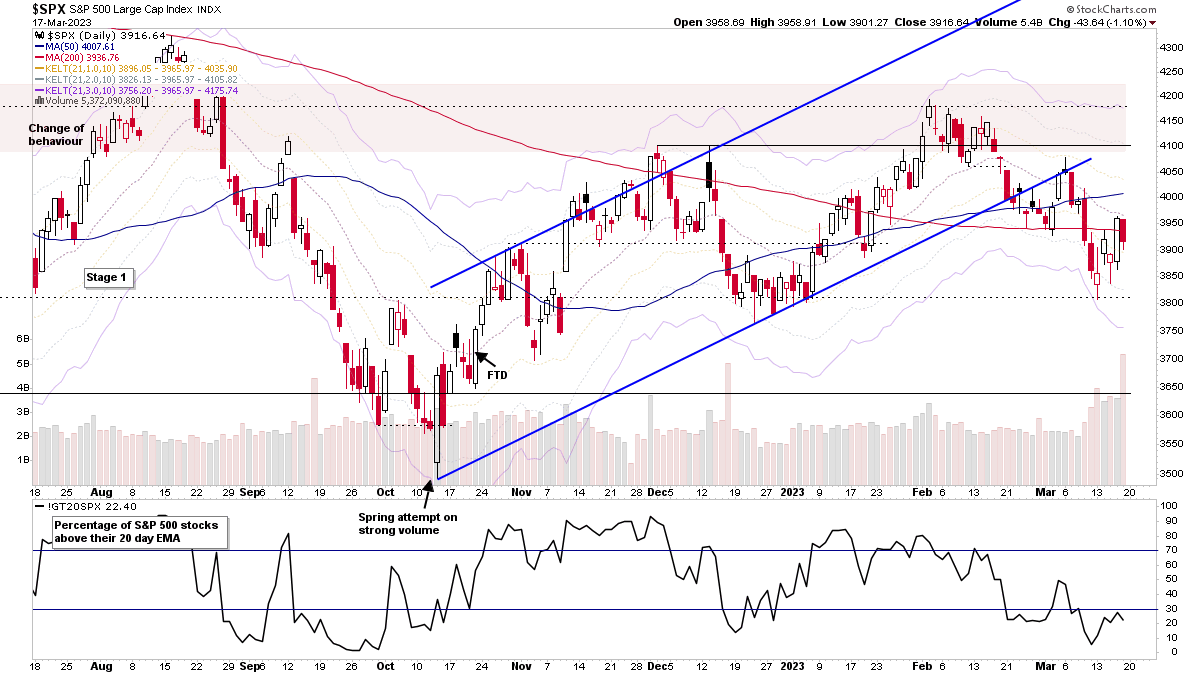
The S&P 500 moved strongly back above its 20 day EMA today. But as you can see in the above chart, there's a notable difference with the S&P 500 percentage of stocks above their 20 day EMA (middle indicator) which is at 36.60%, as with the S&P 500 index above its 20 day MA by almost 1%, you would expect at least 50% of S&P 500 to be doing the same...
Read More
20 March, 2023
Sector Breadth: Percentage of US Stocks Above Their 150 day (30 Week) Moving Averages
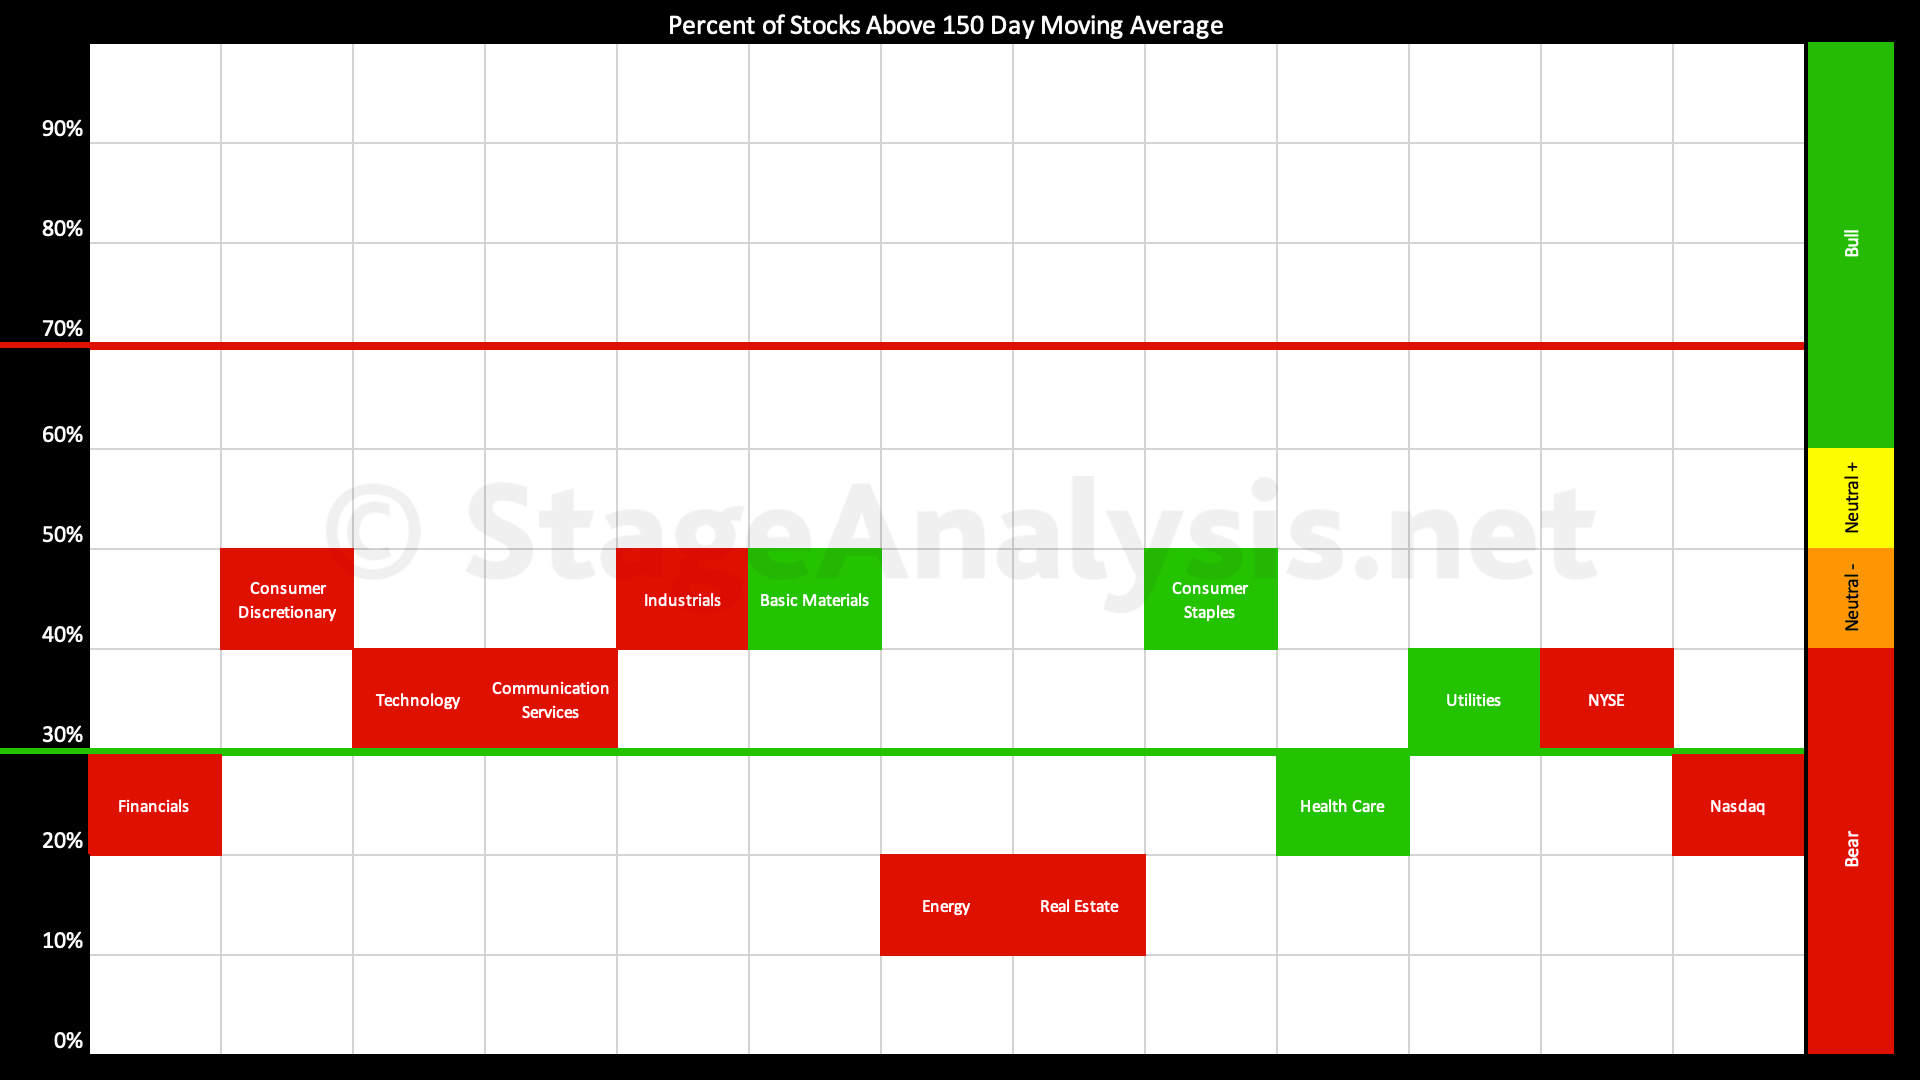
The Percentage of US Stocks Above Their 150 day Moving Averages in the 11 major sectors has dropped significantly since the previous post of the 6th March 2023, decreasing by -16.88% to 34.31% overall, which moves the overall average into the lower third, which is the Stage 4 zone...
Read More
19 March, 2023
Stage Analysis Members Video – 19 March 2023 (1hr 20mins)
This weekends video begins with a detailed discussion of the IBD Industry Groups Bell Curve – Bullish Percent and the Market Breadth Indicators, in order to help to determine the weight of evidence, which is the most crucial aspect of Stan Weinstein's Stage Analysis method. The changes in the US Stocks Industry Groups RS Rankings are then discussed, as well as the Major Indexes Update and Futures, including the S&P 500, Nasdaq 100, Russell 2000, US Dollar Index, Gold etc. Followed by a review of the watchlist stocks from the weekend scans.
Read More
19 March, 2023
Underlying Weakness and the US Stocks Watchlist – 19 March 2023
For the watchlist from the weekend scans...
Read More
18 March, 2023
IBD Industry Groups Bell Curve – Bullish Percent
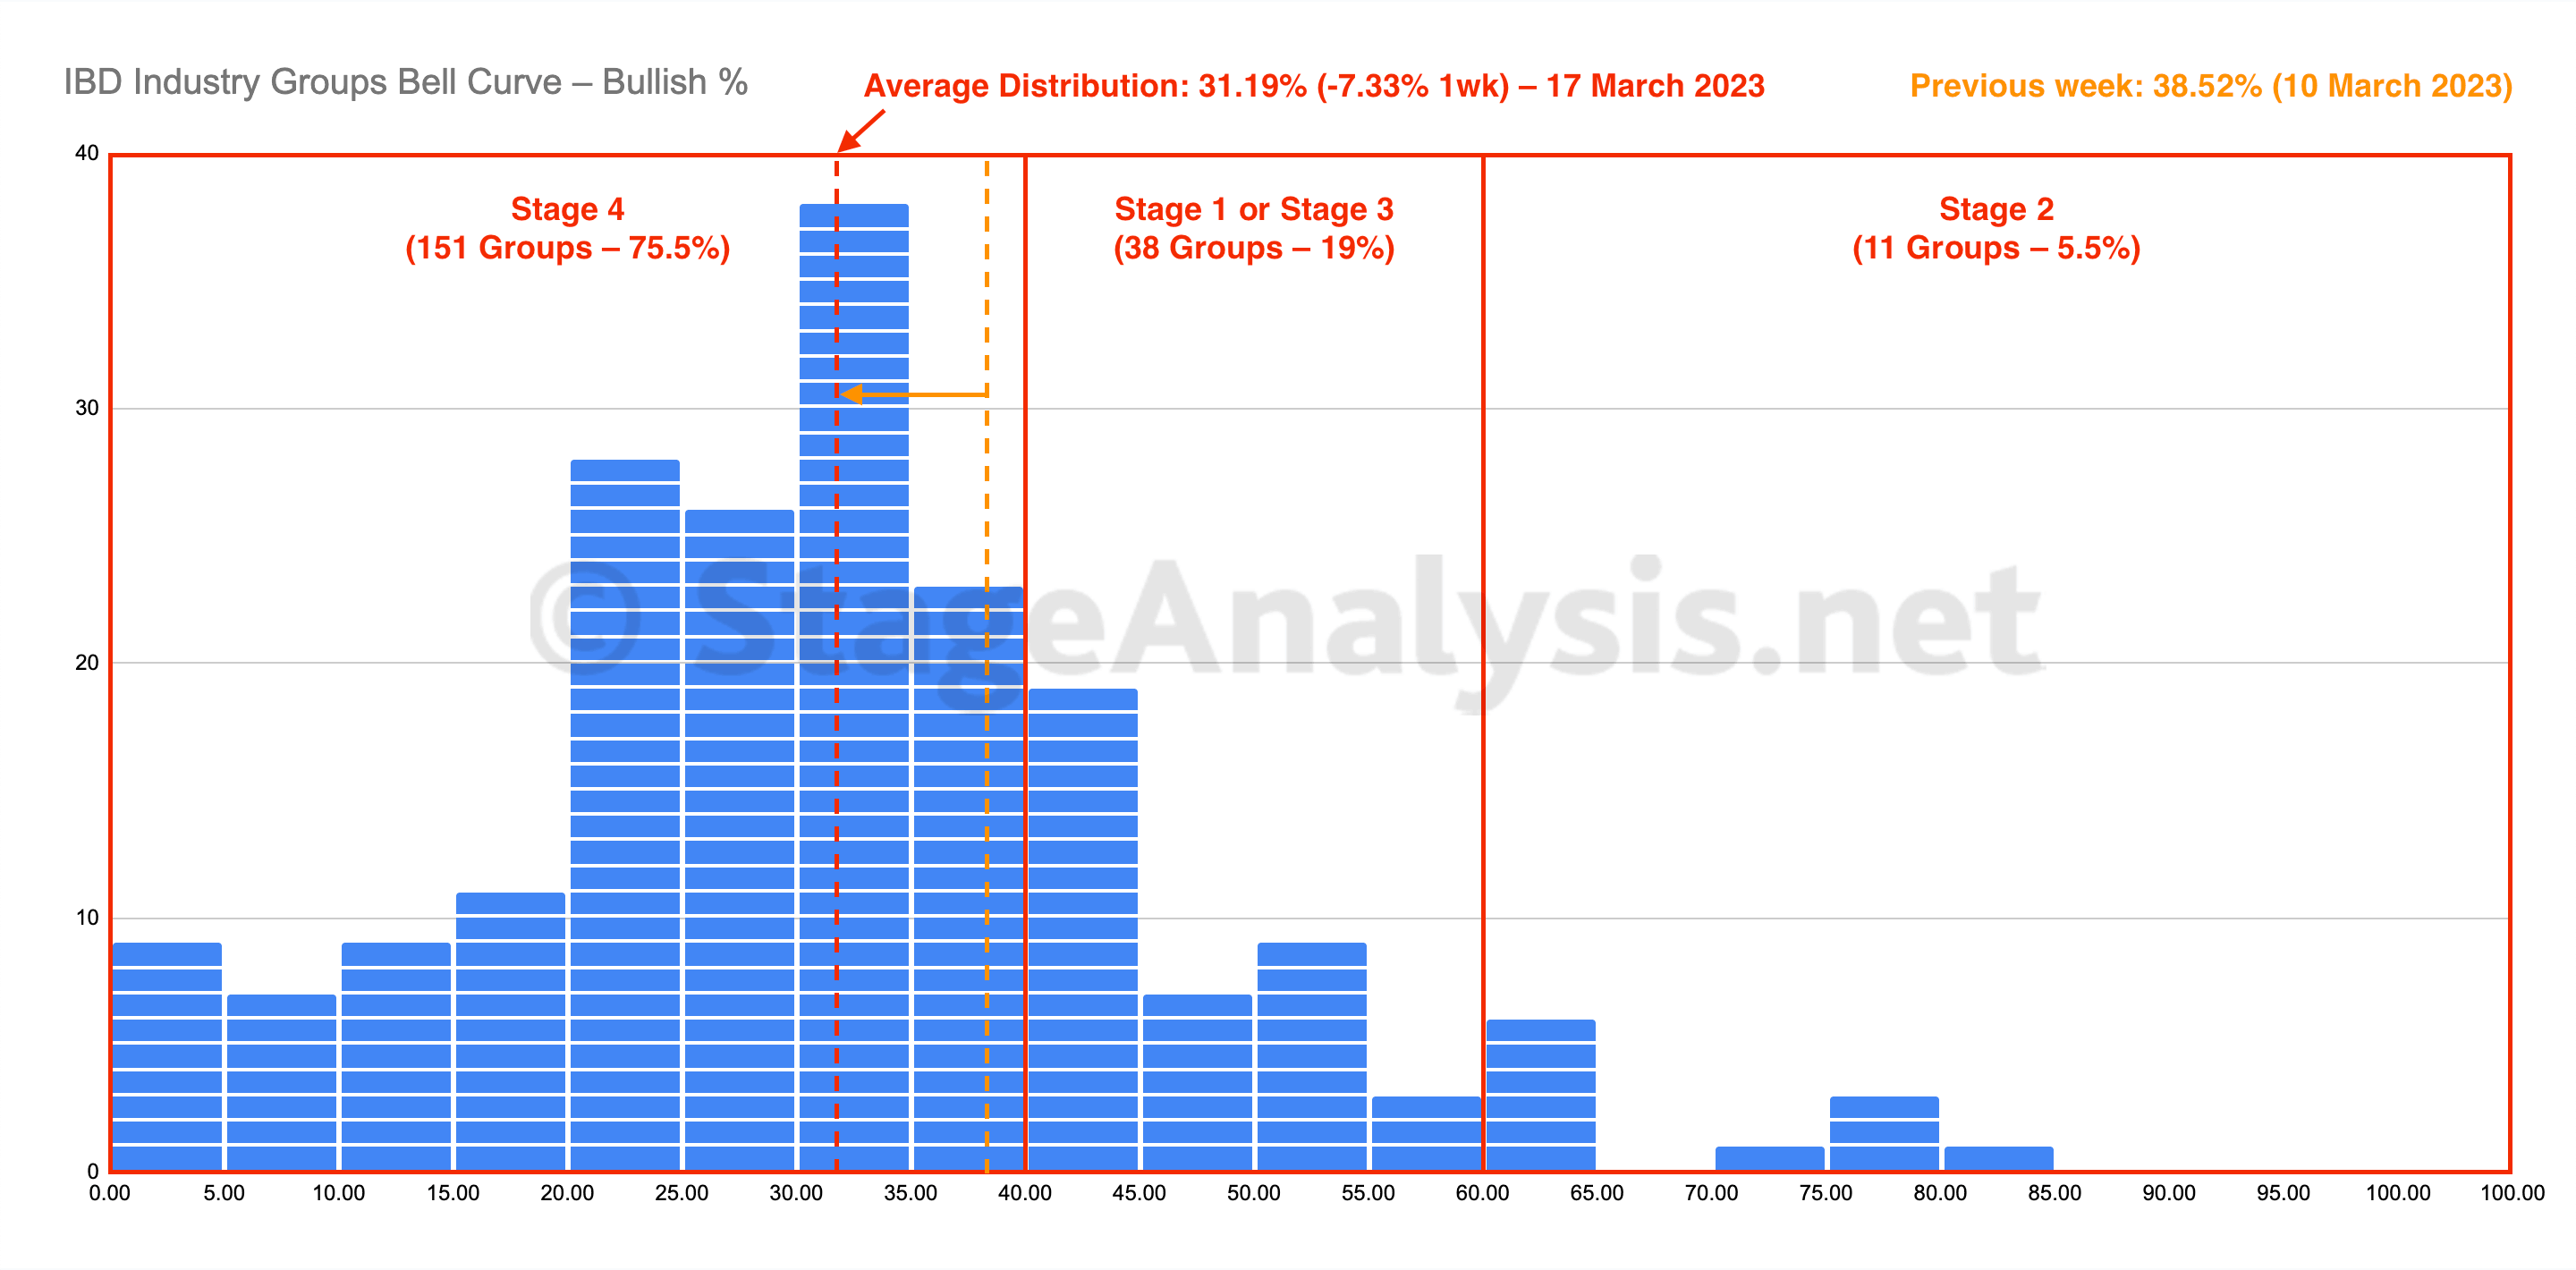
The IBD Industry Groups Bell Curve declined for a sixth week losing a further -7.33% to finish at 31.19% overall. The amount of groups in Stage 4 increased by 41 (+20.5%), and the amount of groups in Stage 2 decreased by 16 (-8%), while the amount groups in Stage 1 or Stage 3 decreased by 24 (-12%).
Read More
18 March, 2023
Market Breadth: Percentage of Stocks Above their 50 Day, 150 Day & 200 Day Moving Averages Combined
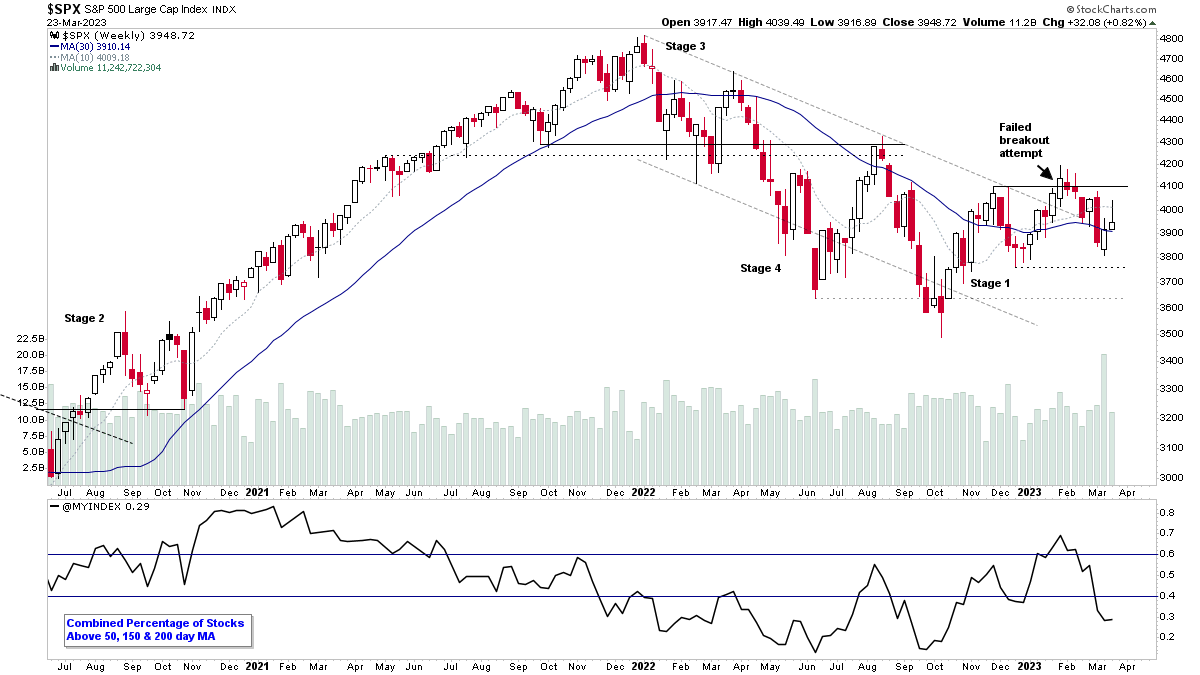
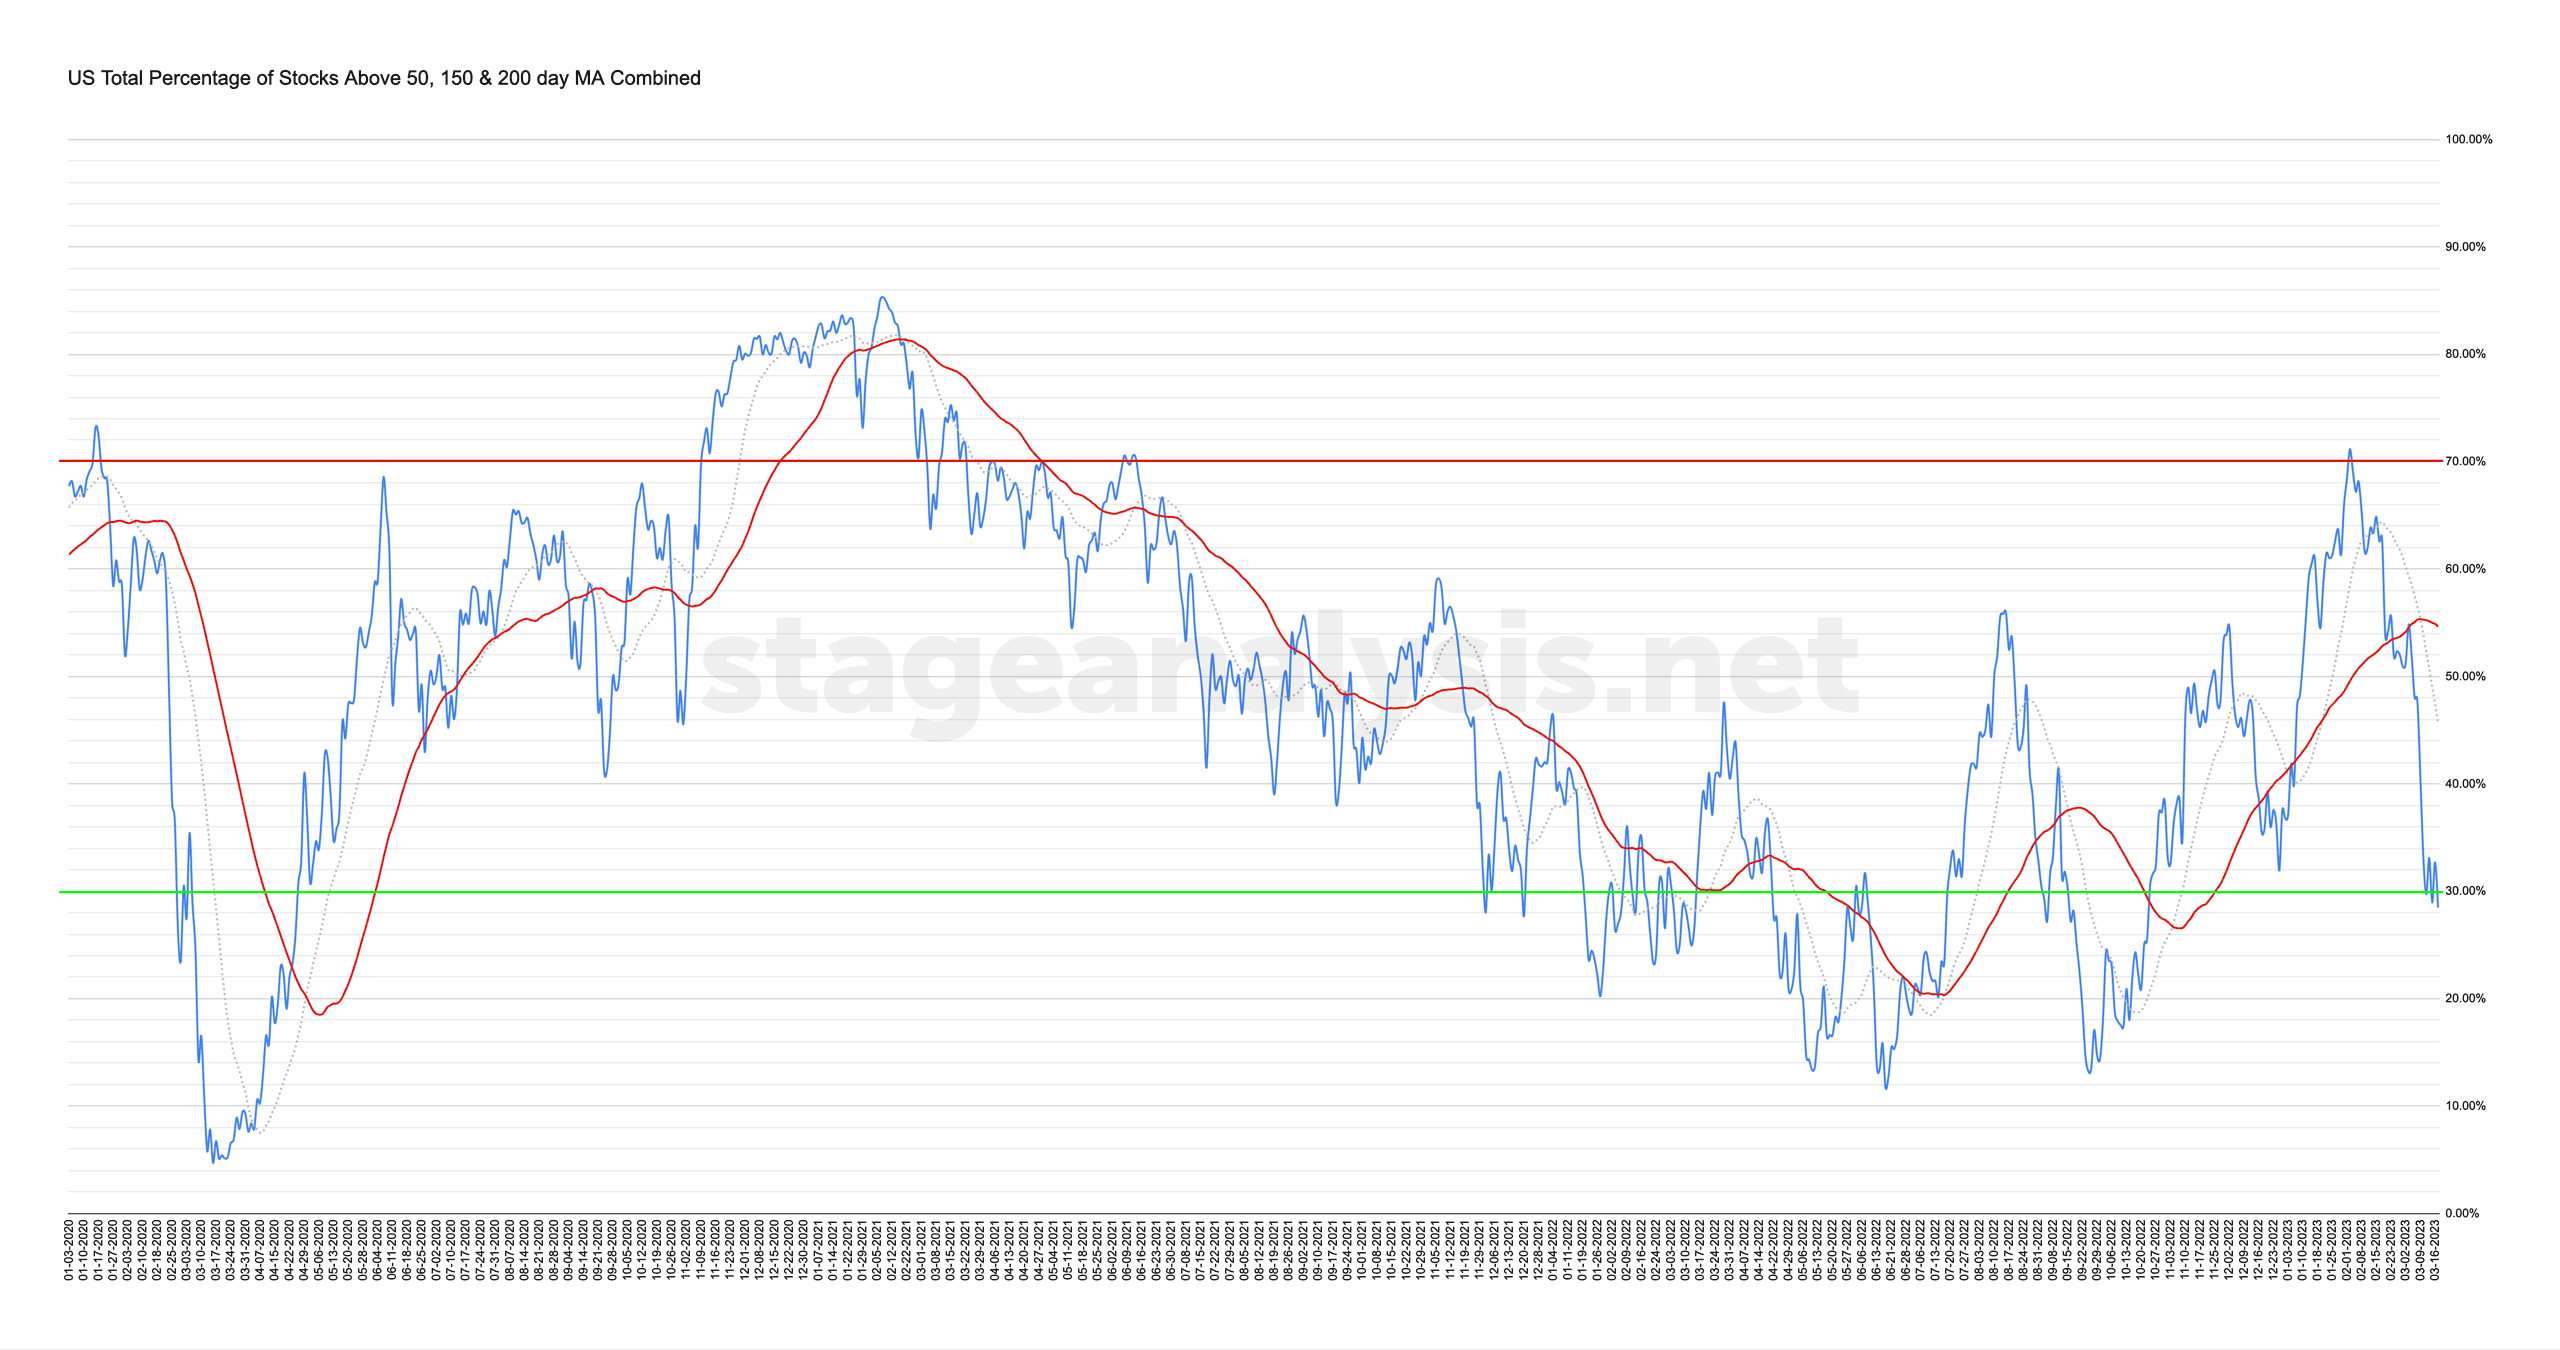
Custom Percentage of Stocks Above Their 50 Day, 150 Day & 200 Day Moving Averages Combined Market Breadth Charts for the Overall US Market, NYSE and Nasdaq for Market Timing and Strategy.
Read More
17 March, 2023
US Stocks Industry Groups Relative Strength Rankings
The purpose of the Relative Strength (RS) tables is to track the short, medium and long term RS changes of the individual groups to find the new leadership earlier than the crowd...
Read More
16 March, 2023
Stage Analysis Technical Attributes Scores – Nasdaq 100
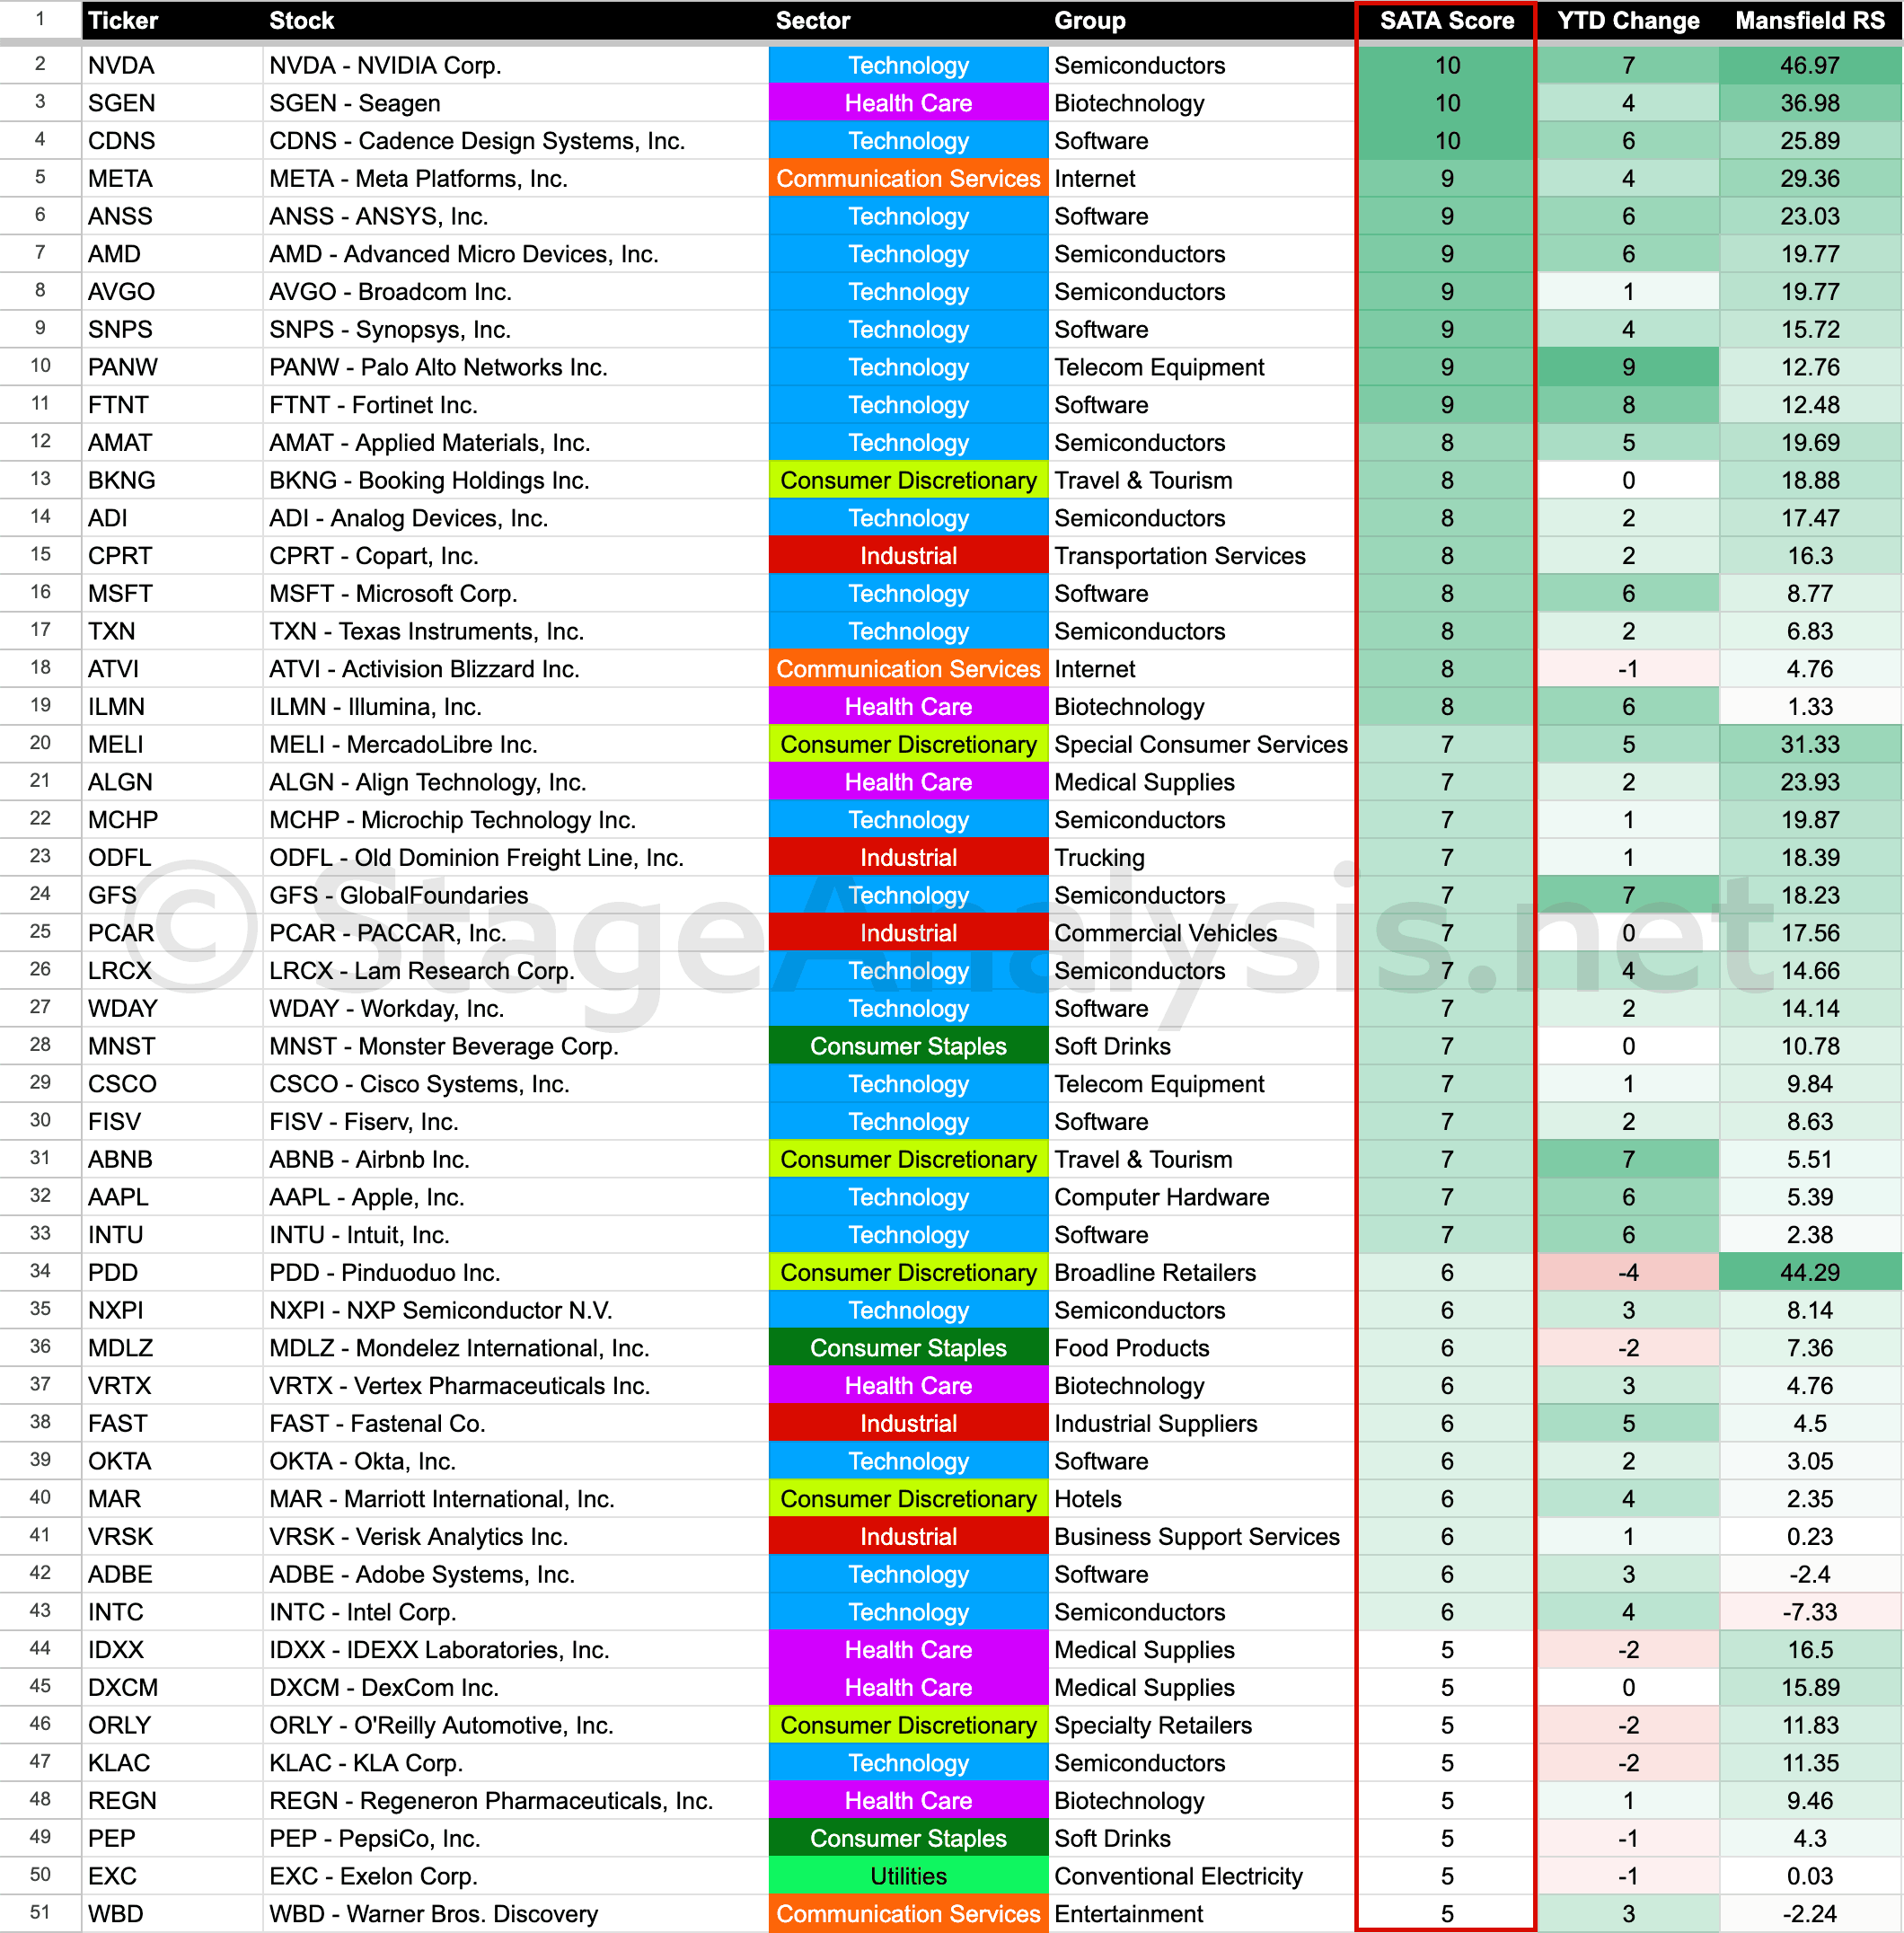
The Stage Analysis Technical Attributes (SATA) score is our proprietary indicator that helps to identify the four stages from Stan Weinstein's Stage Analysis method, using a scoring system from 0 to 10 that rates ten of the key technical characteristics that we look for when analysing the weekly charts.
Read More

