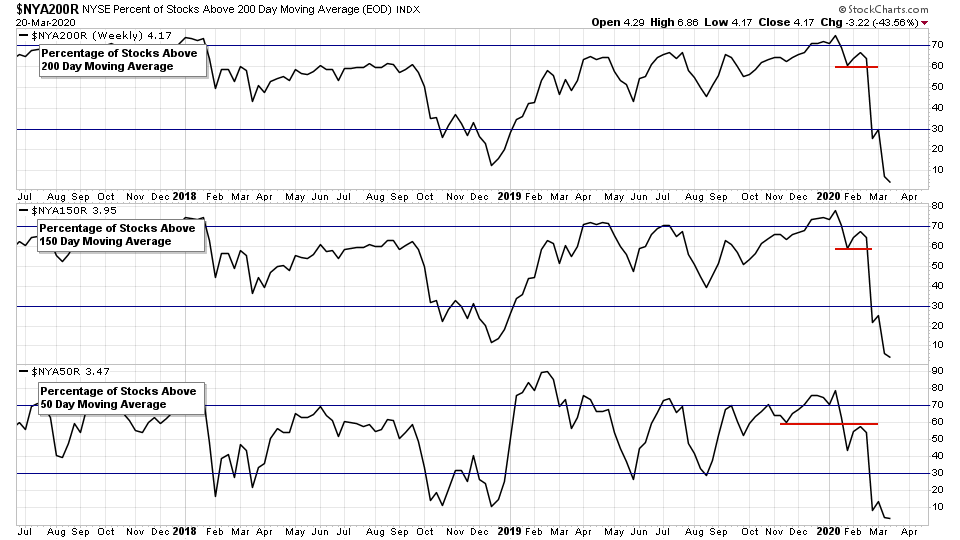
The stocks markets indexes and individual stock charts continued on tear lower this week, in deep Stage 4 territory for most. The bounce at the end of last week suckered in more people, only for the markets to rip lower again this week. Closing this time near the lows of the week.
Read More
Blog
15 March, 2020
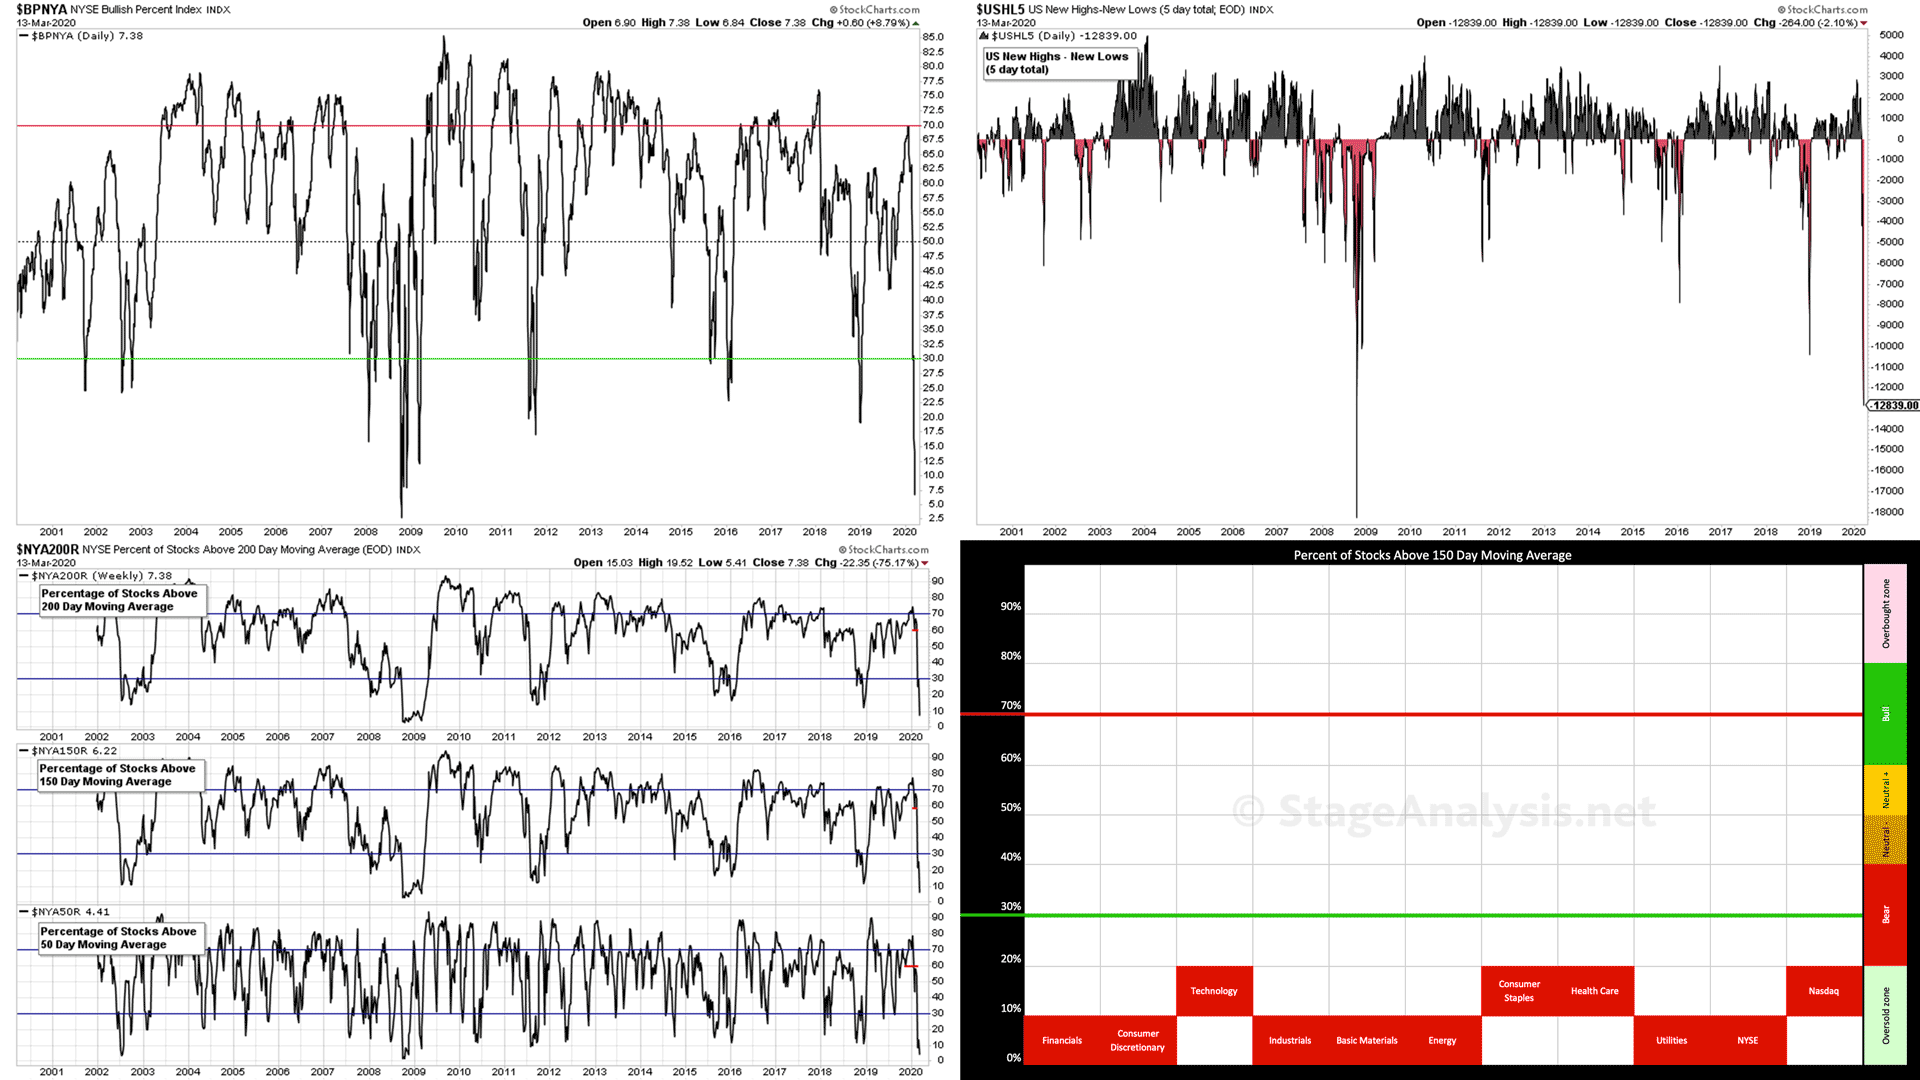
US MARKET BREADTH: Some People Say the Stock Market Has Bottomed – But Has It?
The stock market saw another week of heavy selling, taking multiple indexes down to extreme levels, with liquidation type selling across the board, even in previous safe havens such as treasuries and spot gold. Although there was some respite with a strong relief rally on Friday at the end of the day, recovering around 10% in some of the major indexes.
Read More
08 March, 2020
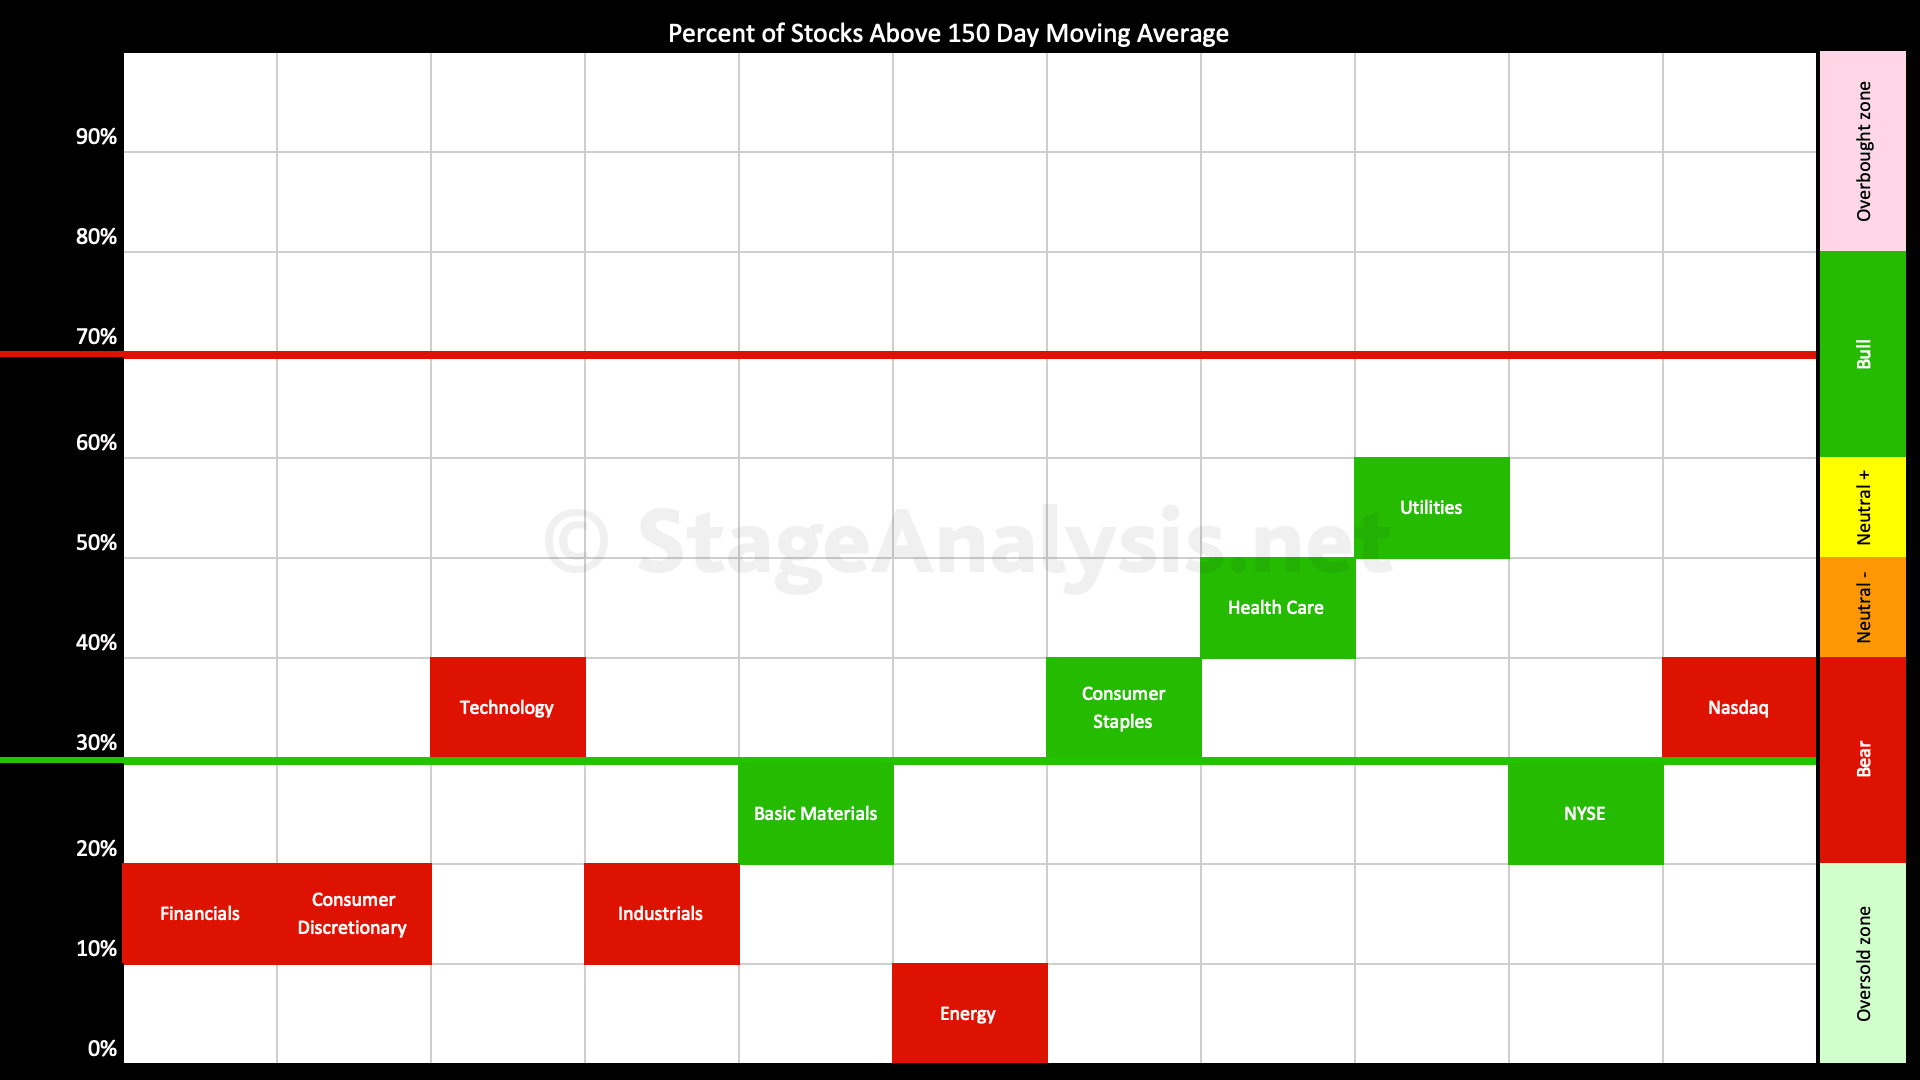
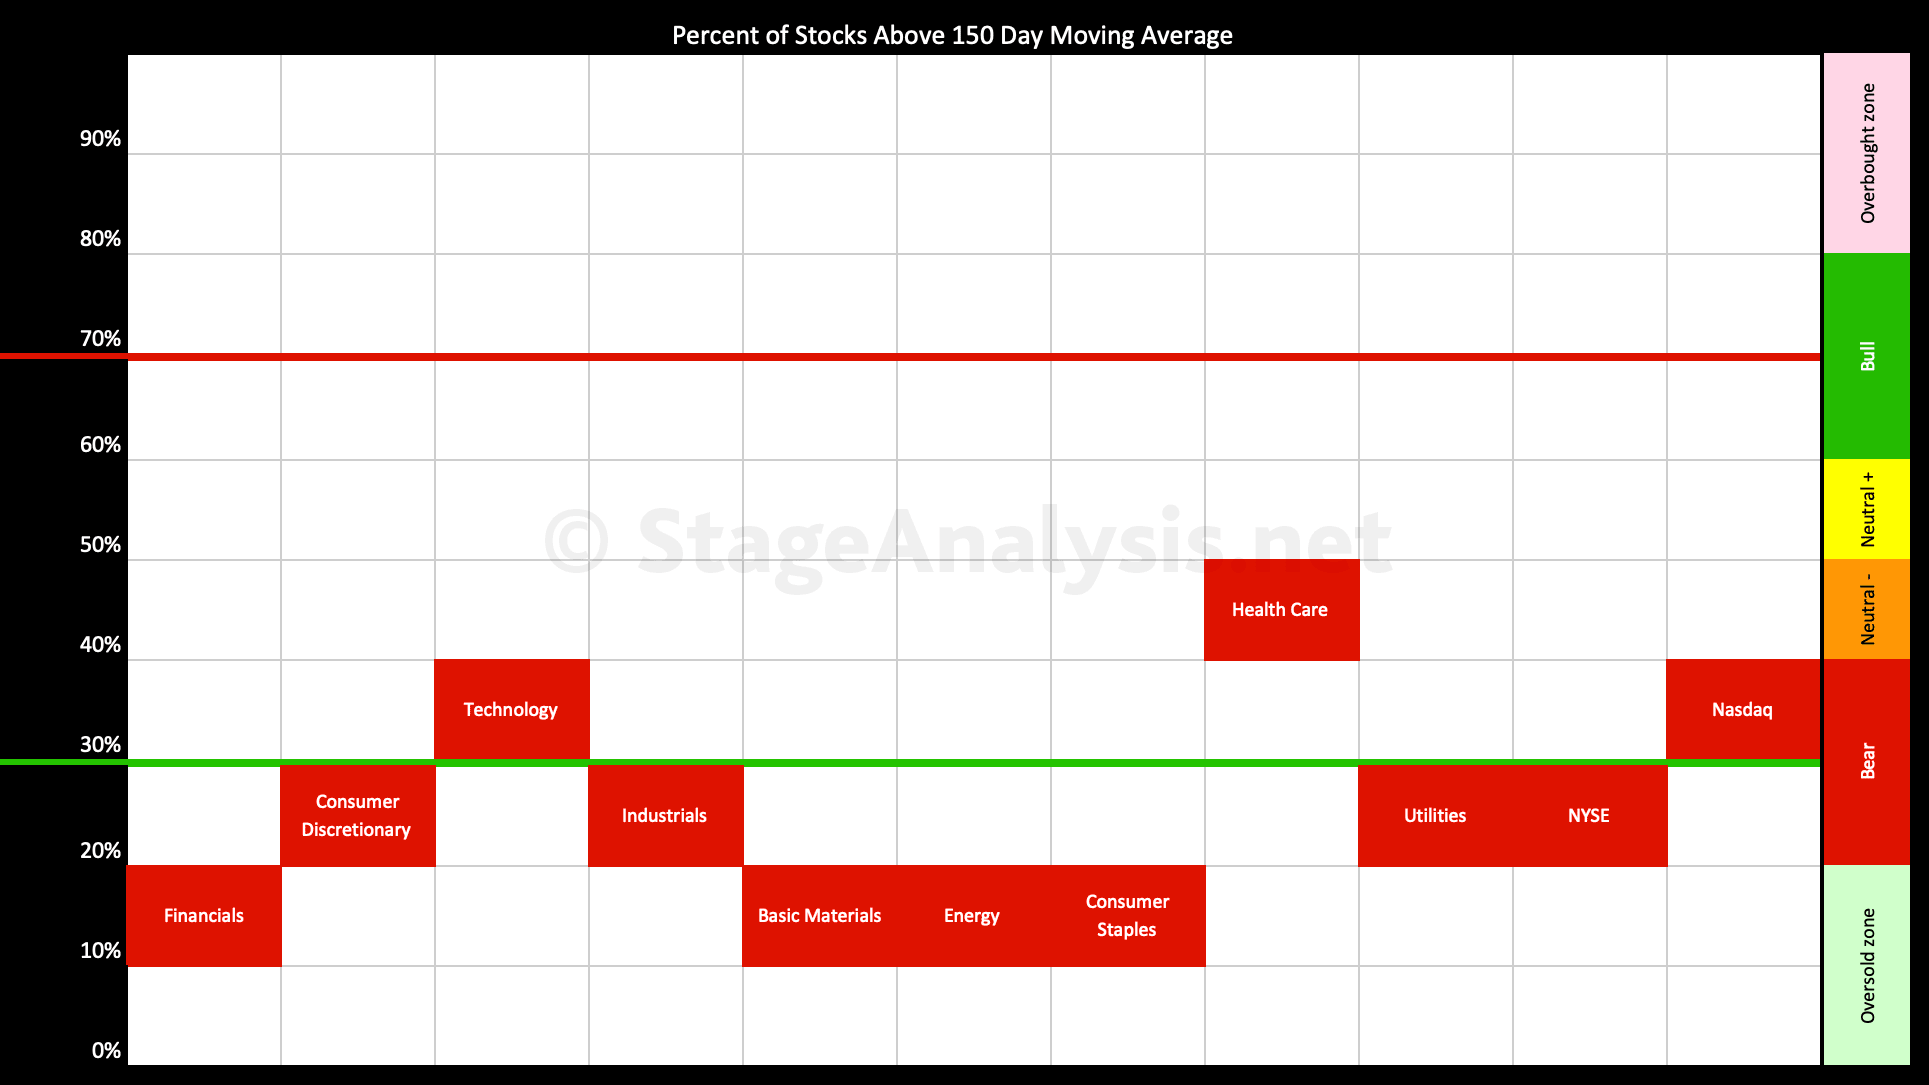
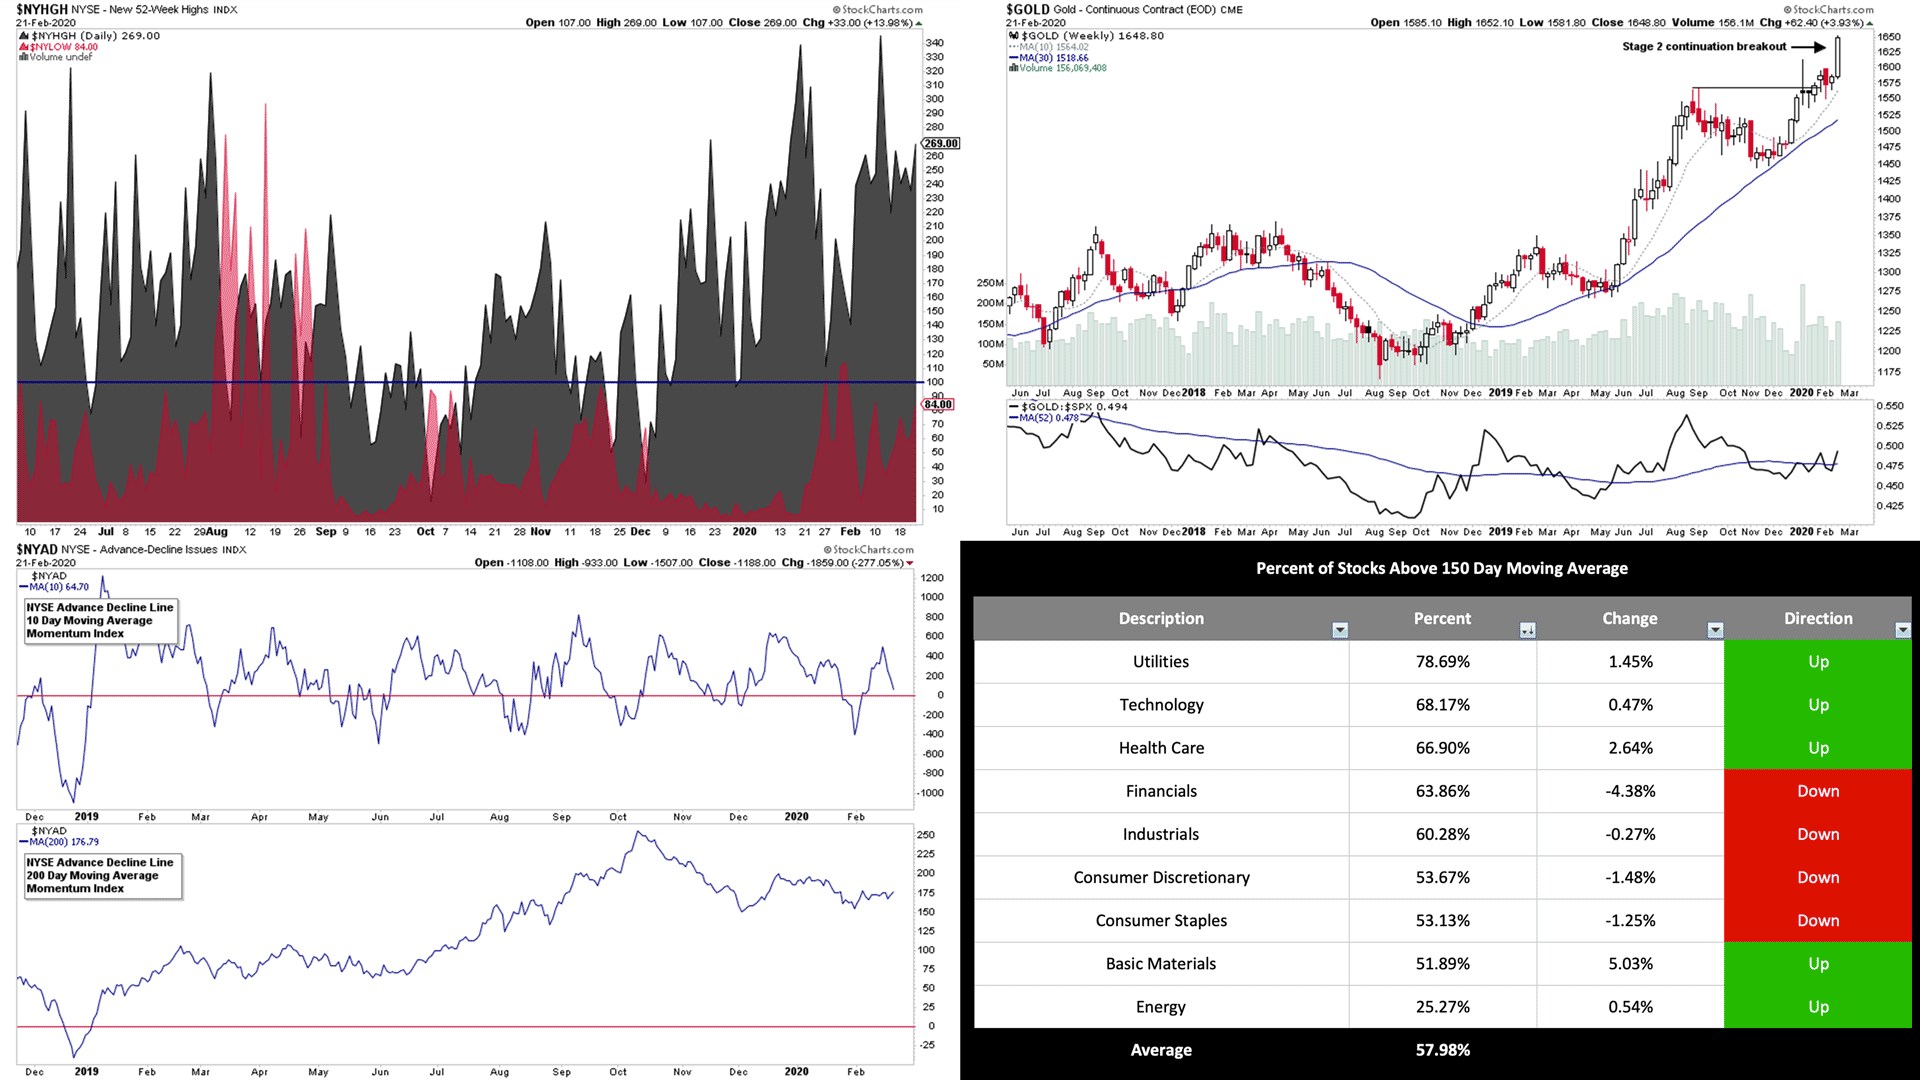
US Sectors - Percent of Stocks Above their 150 Day Moving Average
Percent of Stocks Above their 150 Day Moving Average table in each sector, which is ordered by overall health.
Read More
08 March, 2020
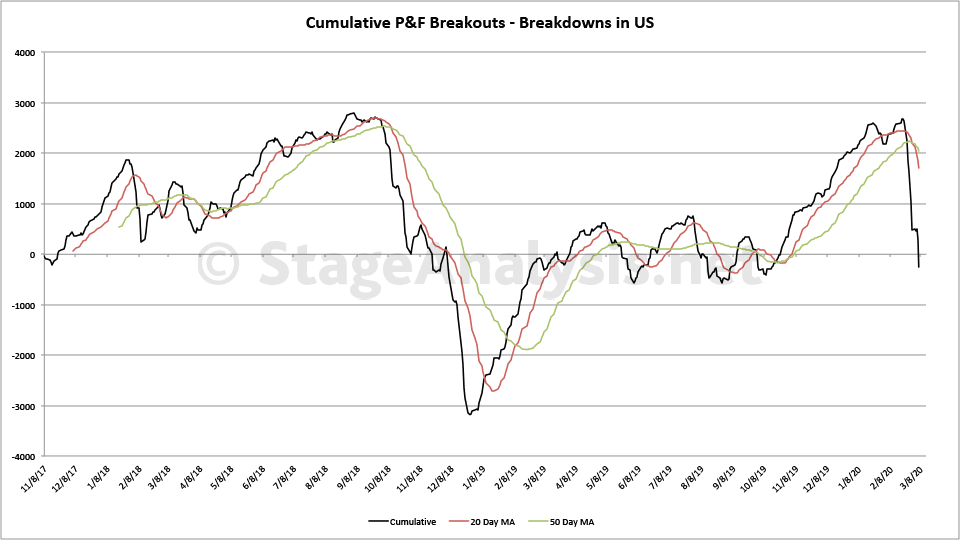
Cumulative P&F Breakouts - Breakdowns Custom Breadth Charts
Another strong net negative week for the point and figure double top breakouts - double bottom breakdowns
Read More
05 March, 2020
US Breakout Stocks Watchlist - 5 March 2020
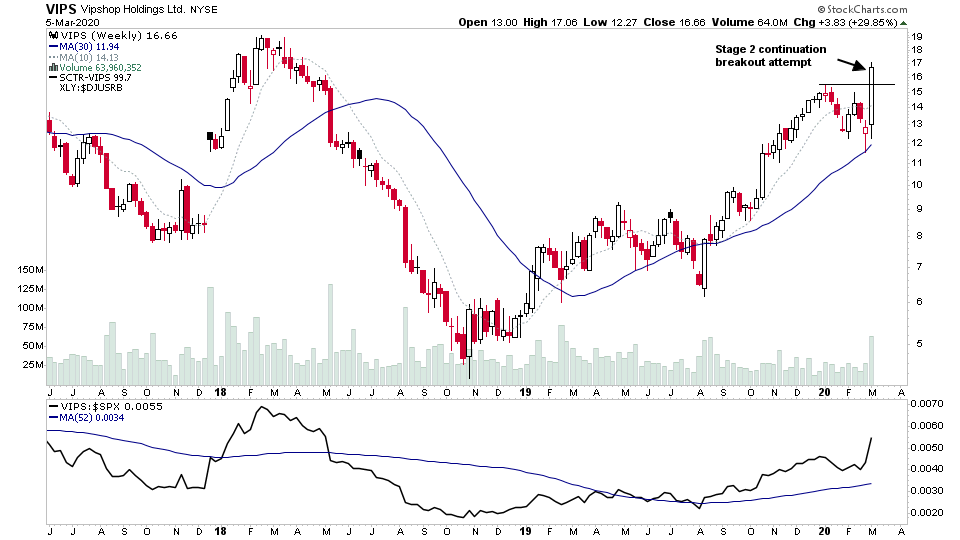
VIPS - showing strong relative performance with a Stage 2 continuation breakout attempt to new 52 week highs on a heavy down day in the market.
Read More
04 March, 2020
US Breakout Stocks Watchlist - 4 March 2020
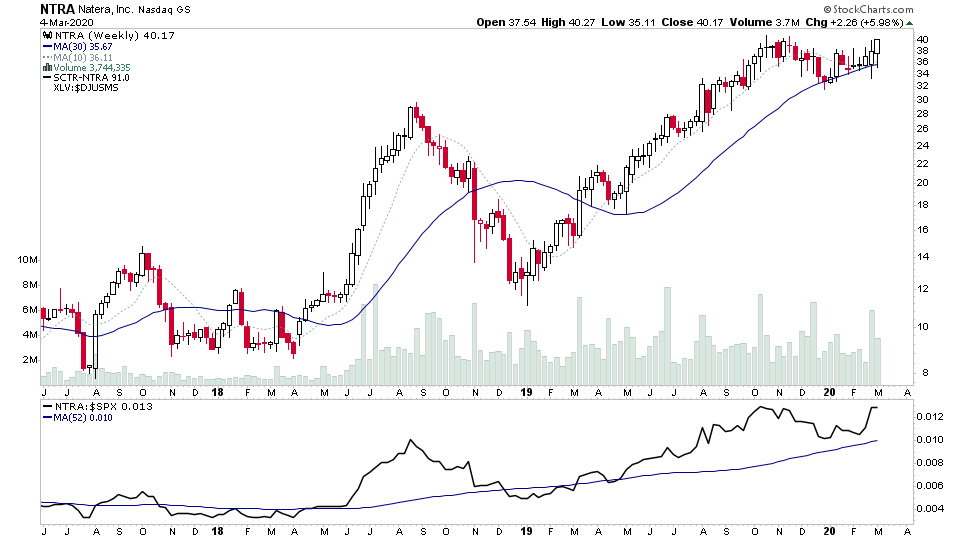
For the watchlist from Wednesdays scans of the US stock market - BLU, CLX, CPB, EHTH, NTRA
Read More
03 March, 2020
US Breakout Stocks Watchlist - 3 March 2020
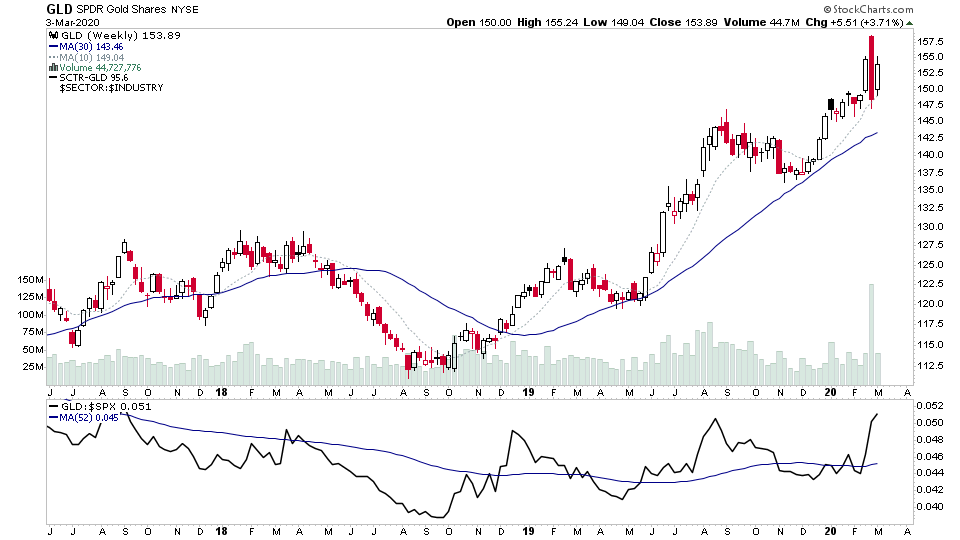
Gold are stocks dominating the watchlist again today as spot gold made a strong move retaining it's Stage 2 status, and is back near to the highs again
Read More
29 February, 2020
US Stock Market Breadth – Quickest 10% Decline From an All-Time High in History
This weeks moves in US stock market indexes and individual stocks confirmed what the market breadth indicators have been warning over the last month. However, the pullback has been much sharper than anyone could have predicted and so it looks like we've put in at least a medium term top imo...
Read More
23 February, 2020
US Breakout Stocks Watchlist - 23 February 2020
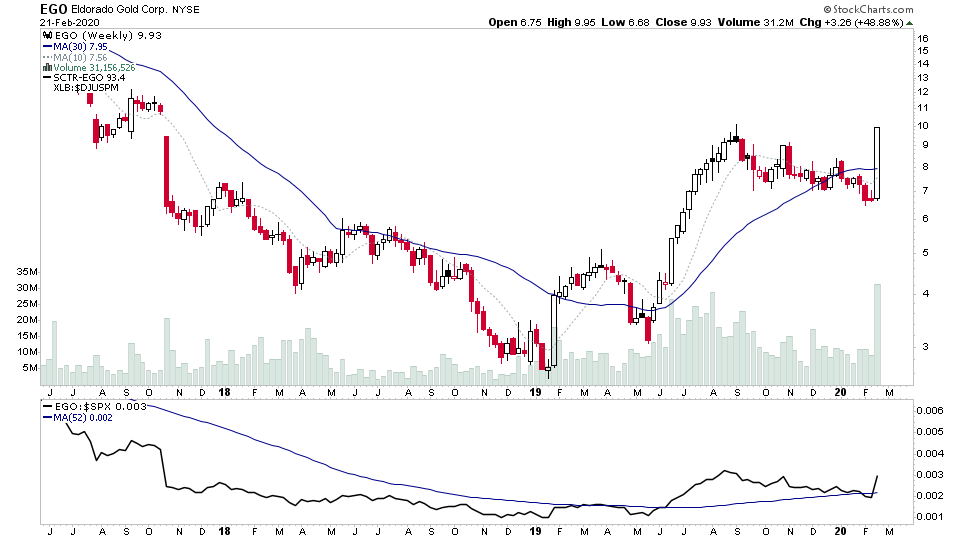
Gold stocks dominated the weekend scans with volume coming into multiple stocks in the precious metals miners, and so per the "Forest to the Trees" Approach in Stan Weinstein's Stage Analysis Method, we should be focusing in on the sector and looking for the strongest stocks for potential trades if they are setup right.
Read More
23 February, 2020
US MARKET BREADTH. Where Next for Stocks in the US Stock Market – Bullish or Bearish?
The major stock market indexes attempted to breakout to new highs again this week, but failed, and turned down to end the week near their lows. In contrast US treasuries made a Stage 2 continuation breakout to new highs, as did Gold on some reasonable volume, and the Gold miners. So I took a position in Gold in my pension account.
Read More

