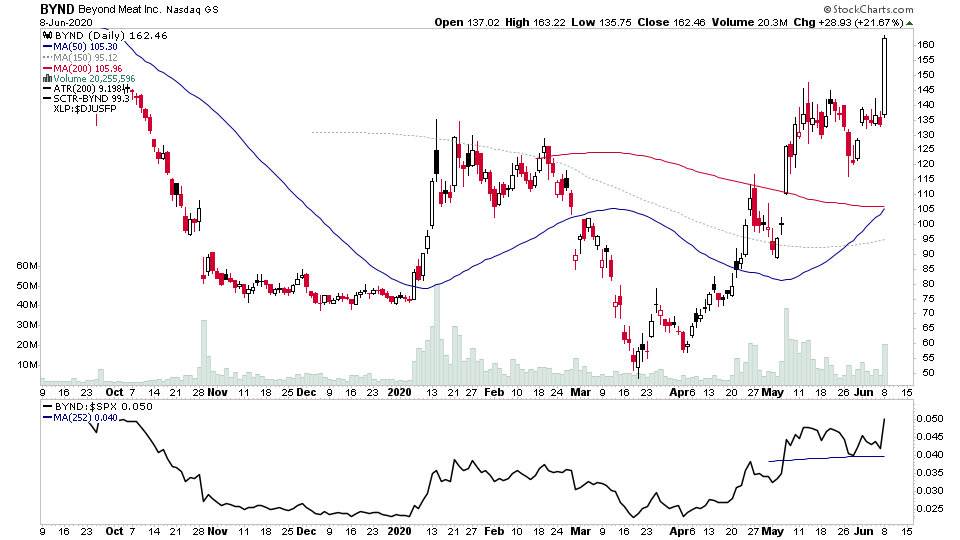
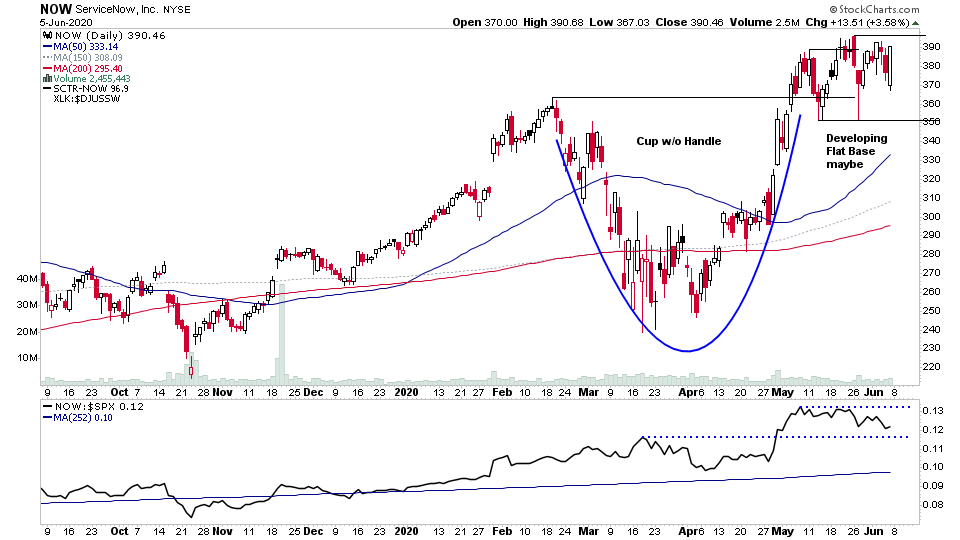
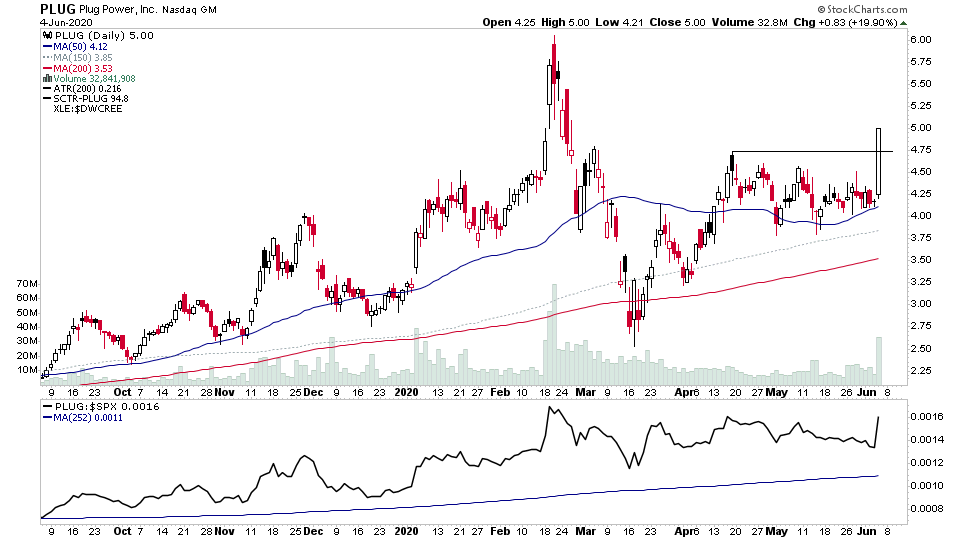
For the watchlist from Mondays scans - ABC, BYND, CGNX, GDDY, NLOK, TMUS, VEEV, XP
Read More
Blog
08 June, 2020
US Breakout Stocks Watchlist - 8 June 2020
07 June, 2020
US Breakout Stocks Watchlist - 7 June 2020
You'll notice this weekend a number of big name stocks in the watchlist (AMZN, FB, GOOG, INTC, MA, MSFT, V) which is interesting as each are making constructive patterns and are near to, or have already broken out of those patterns. So it is a positive breadth signal imo, as these widely held stocks by institutions and funds.
Read More
04 June, 2020
US Breakout Stocks Watchlist - 4 June 2020
It was a strong day for small caps and beaten down stocks again today as the sector rotation continued to play out. But with the rotation, leading sectors were getting hit hard, and a lot of people were raising cash on my twitter feed.
Read More
03 June, 2020
US Breakout Stocks Watchlist - 3 June 2020
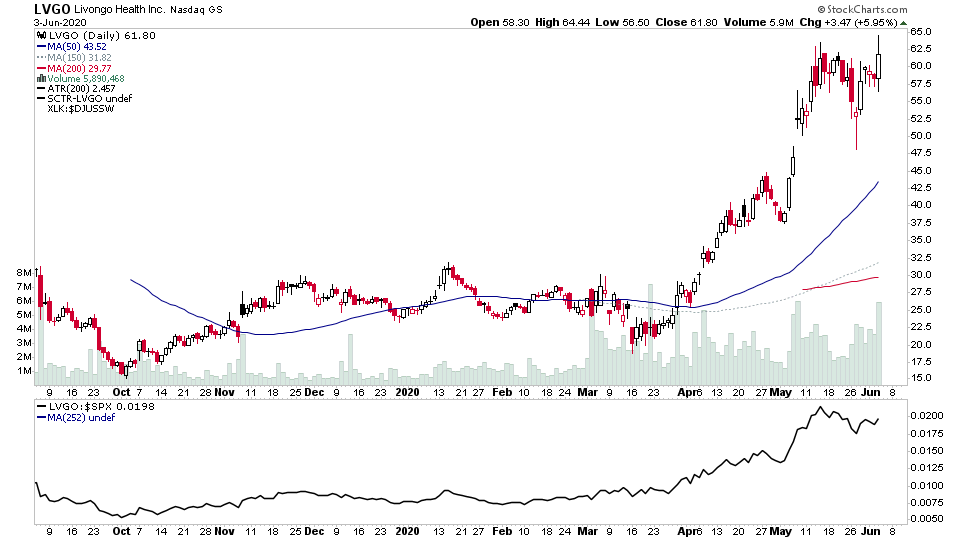
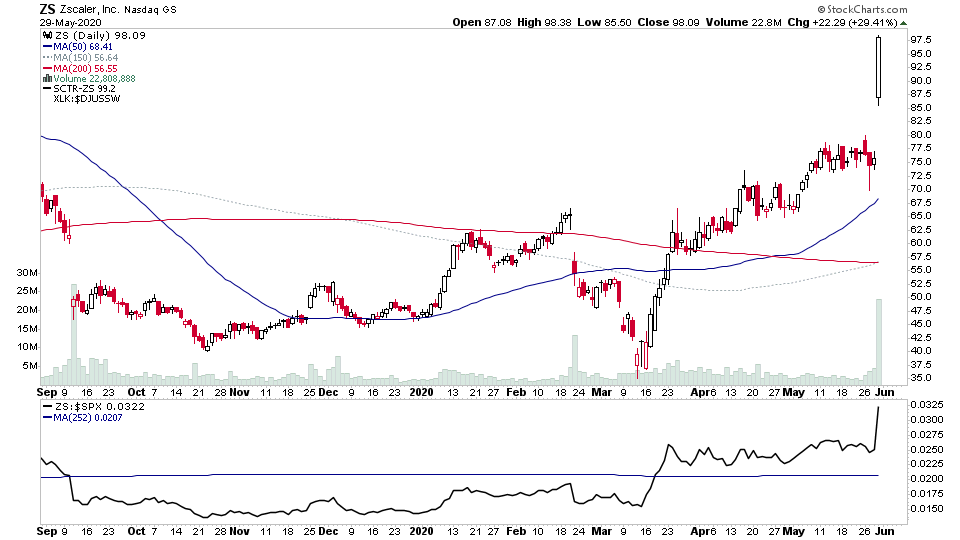
For the watchlist from Wednesdays scans - AAPL, APPS, AXTI, BSGM, IIVI, KLAC, LVGO, MTSI, NARI, TGT, TXG, VAPO
Read More
02 June, 2020
US Breakout Stocks Watchlist - 2 June 2020
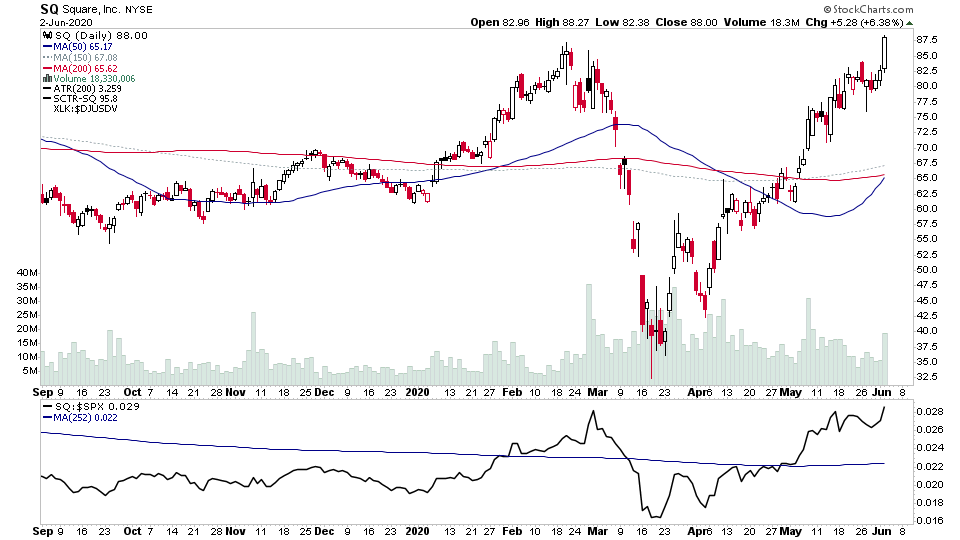
For the watchlist from Tuesdays scans - CALX, CVNA, NIO, NTES, NTRA, NVRO, PRVB, PYPL, QRVO, SHOP, SQ, TTD, WRTC
Read More
01 June, 2020
US Breakout Stocks Watchlist - 1 June 2020
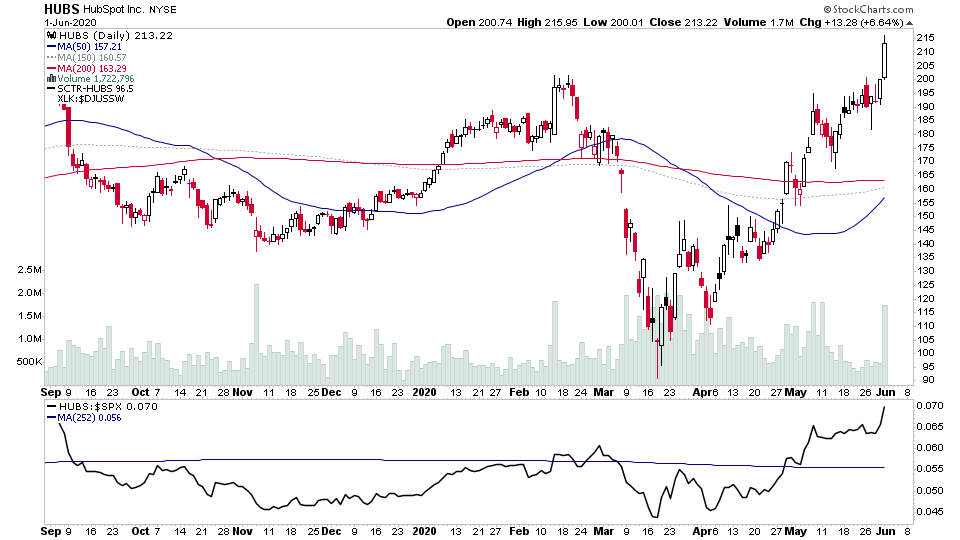
A number of strong volume stocks in the list tonight, with another day with some fairly strong Stage 2A breakouts and continuation breakouts
Read More
31 May, 2020
US Breakout Stocks Watchlist - 31 May 2020
A big list from the weekend scans - I struggled to cut it down. But a few repeats in there after last weeks shakeout in the leaders.
Read More
31 May, 2020
US Stock Market Breadth Update. Shakeout or Not? Improvements in a Number of Indicators
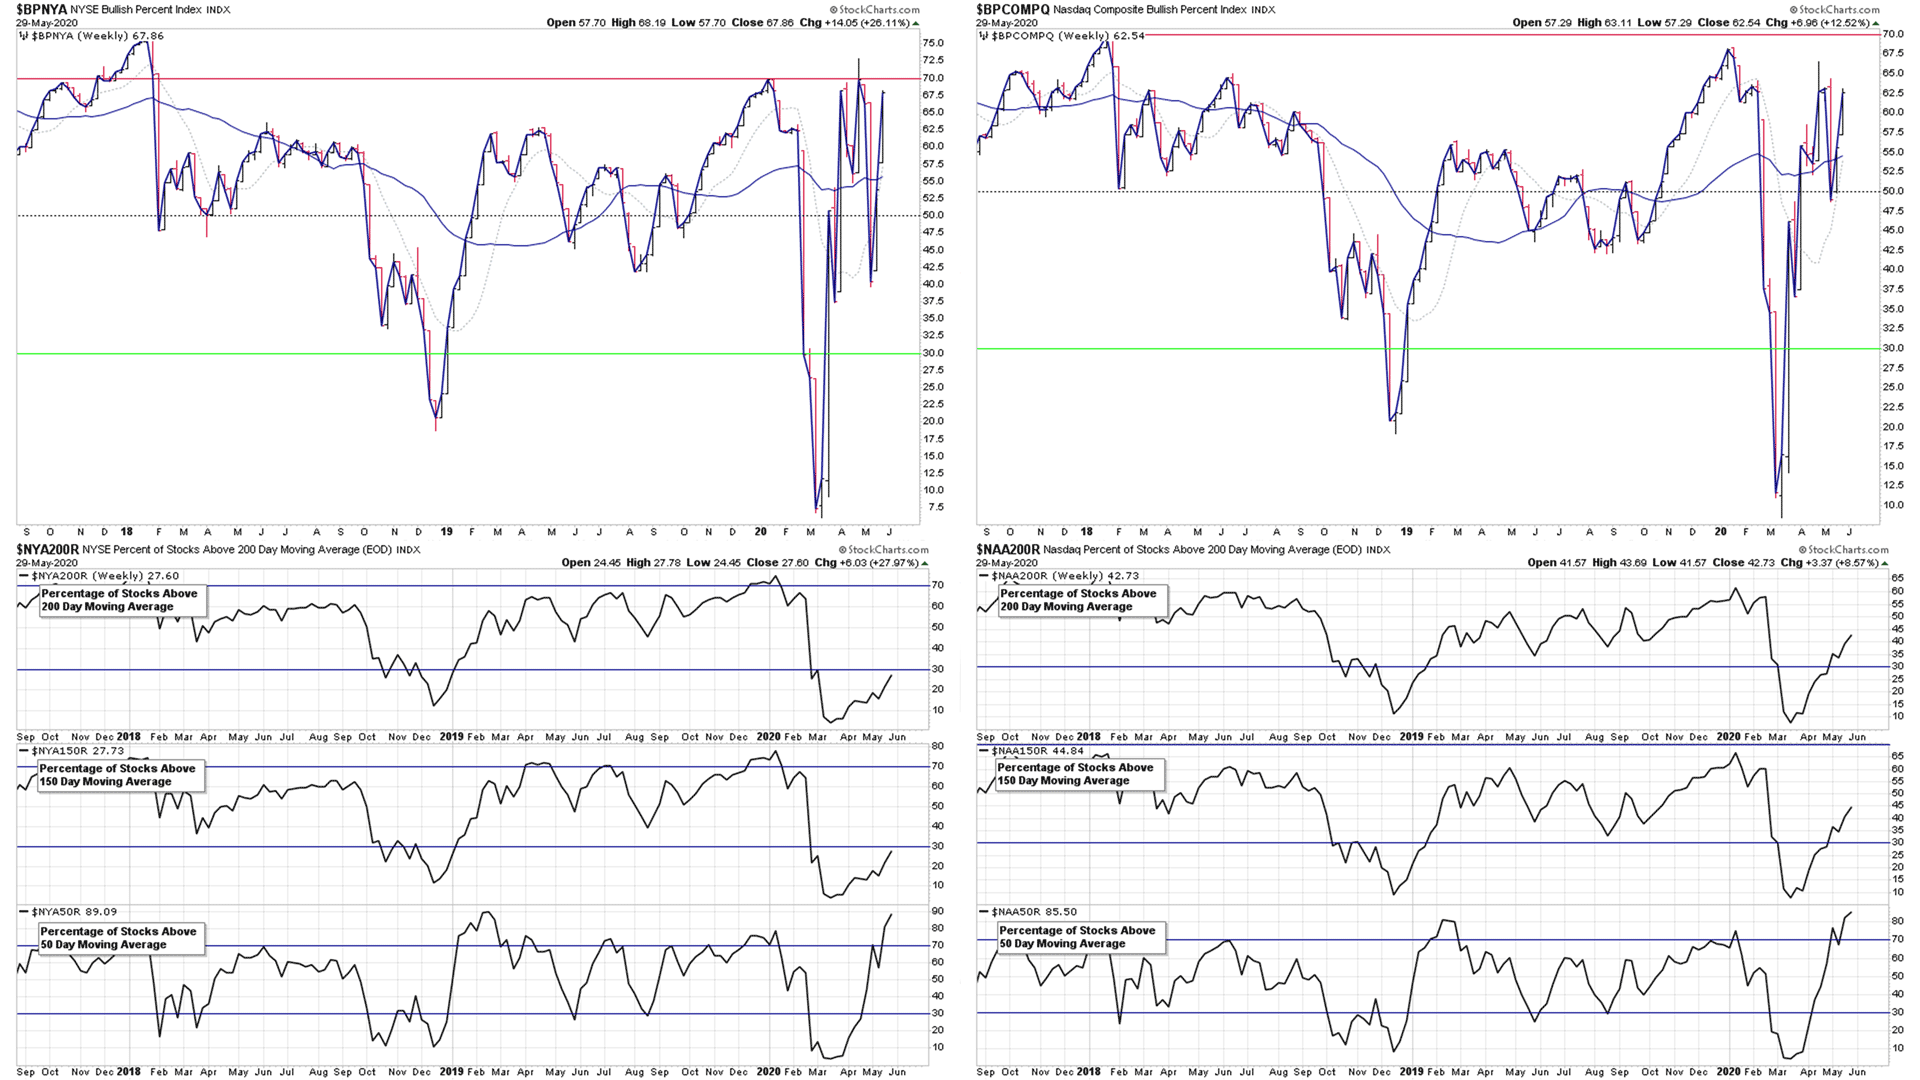
This week saw a huge shakeout in the leadership stocks with numerous tech and healthcare stocks dropping up to -20% in a just a few days from their highs. However, there is a chance that it was just a shakeout by the markets in order to let the larger players load up on the stronger stocks at a lower price. But this opinion now needs confirmation, as although some traders jumped back in immediately on the assumption of a shakeout. The price action of many stocks that got hit failed to recover with much strength, and still closed the week significantly lower than the previous week, even though they recovered half or more of the drop.
Read More
27 May, 2020
US Breakout Stocks Watchlist - 27 May 2020
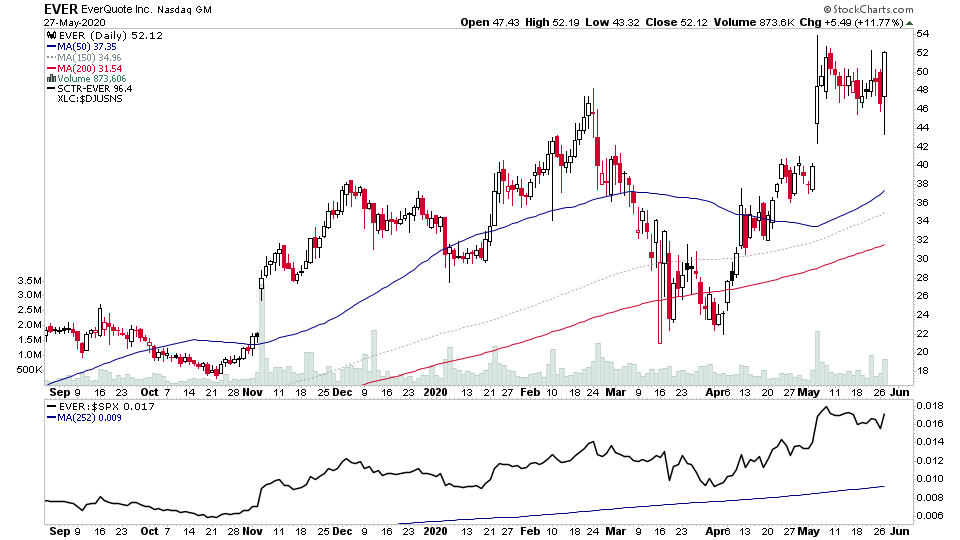
A wild day in the market with multiple stocks running stop losses before reversing into the end of the day. So a potential shakeout day. But it will need confirmation of a higher close than todays high in those stocks that were hit in tomorrows trading, or the recent weakness in them could resume.
Read More
26 May, 2020
US Breakout Stocks Watchlist - 26 May 2020
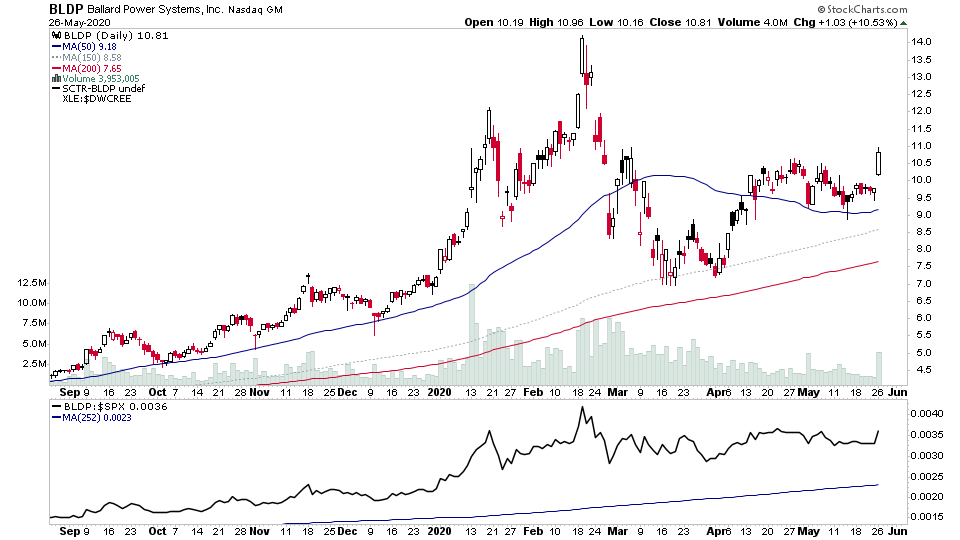
Another big gap up at the open day that then spent the rest of the day grinding sideways and lower. The Nasdaq 100 even went negative by the close. There was a lot of rotation with small caps leading in all the sectors that have been underperforming, while the leading sectors such as gold miners and growth stocks took a beating.
Read More

