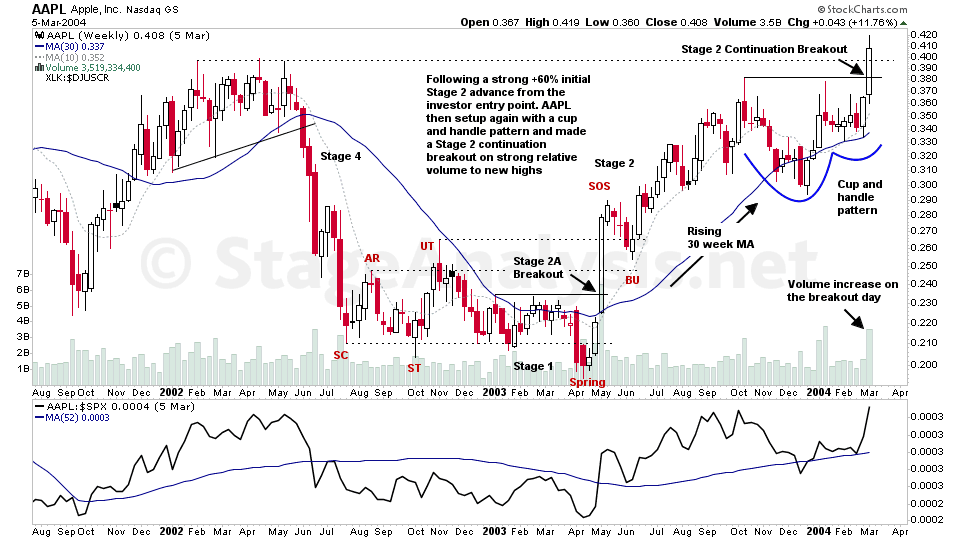
With the increased interest in Stan Weinstein's Stage Analysis method recently, I thought it would be useful to begin this weekends video with an educational feature on the Stage 2A entry point, using the example of AAPL from May 2003...
Read More
Blog
07 August, 2022
US Stocks Watchlist – 7 August 2022
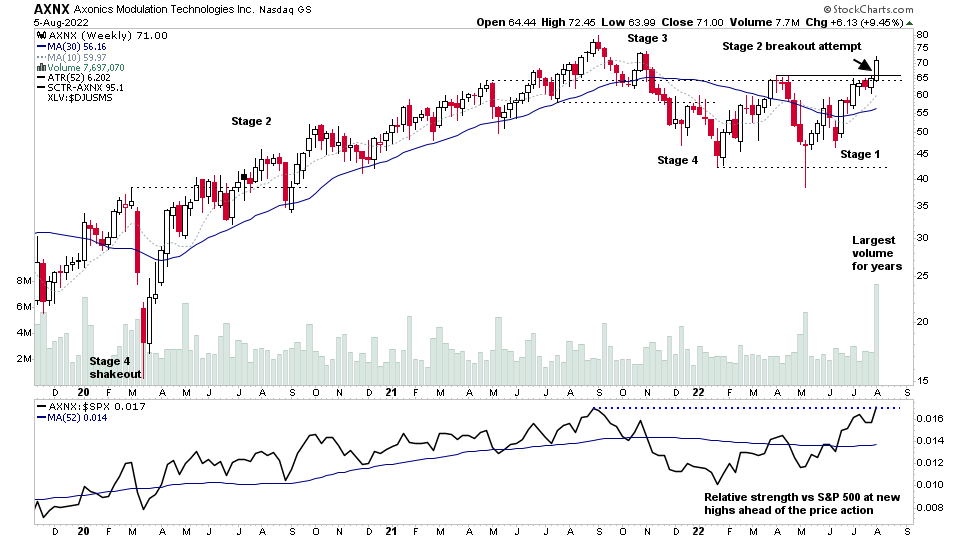
The Healthcare sector dominated the weekend watchlist scans and there's multiple stocks from the sector in the final cut. But many are short term extended, after earnings gaps, or just moving strongly with the group theme. So most are on pullback / consolidation base watch...
Read More
06 August, 2022
Sector Breadth: Percentage of US Stocks Above Their 150 day (30 Week) Moving Averages
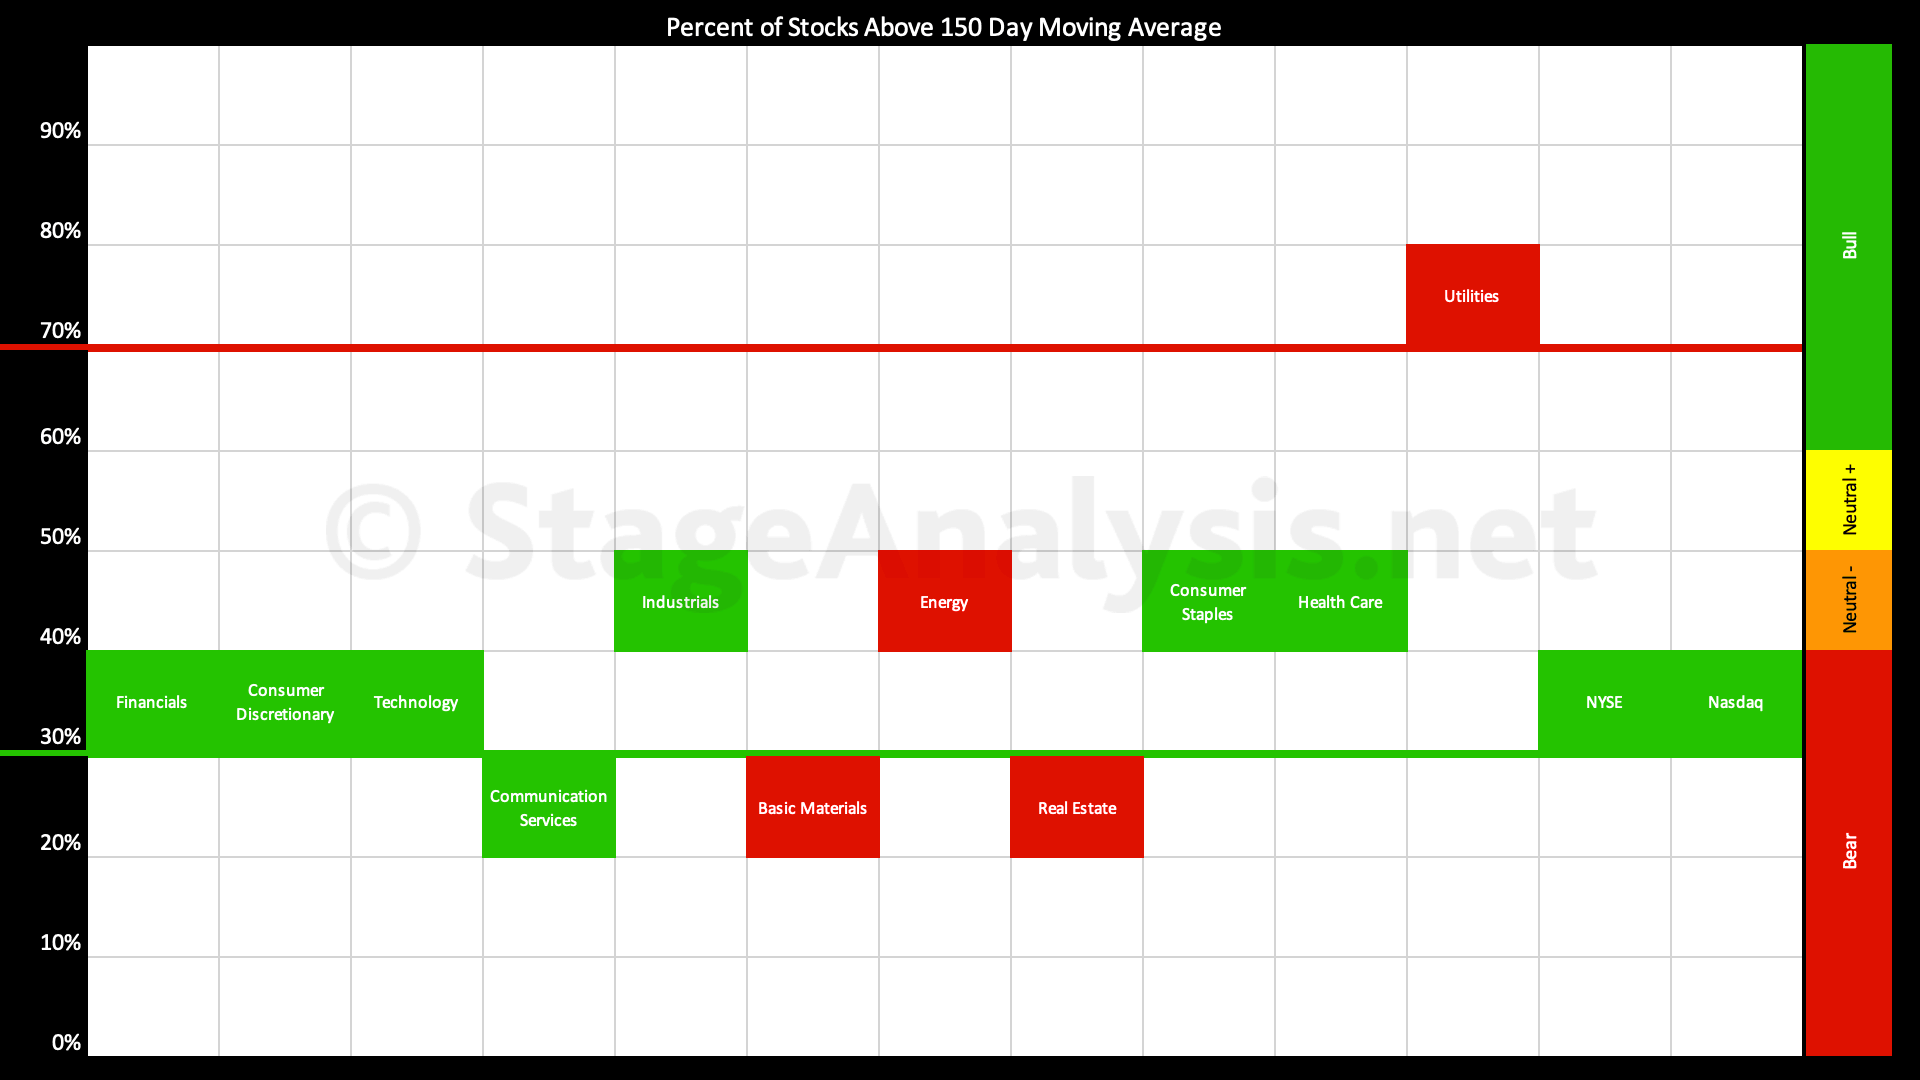
There has been steady improvement in the Percentage of US Stocks Above Their 150 day Moving Averages over the last 5 weeks since I produced the sector breadth diagram and table, with a +15.91% improvement over the period and a few more sectors moving into the Stage 1 zone (40% to 60% range), and one sector moving into the Stage 2 zone (above 60%)...
Read More
06 August, 2022
IBD Industry Groups Bell Curve – Bullish Percent
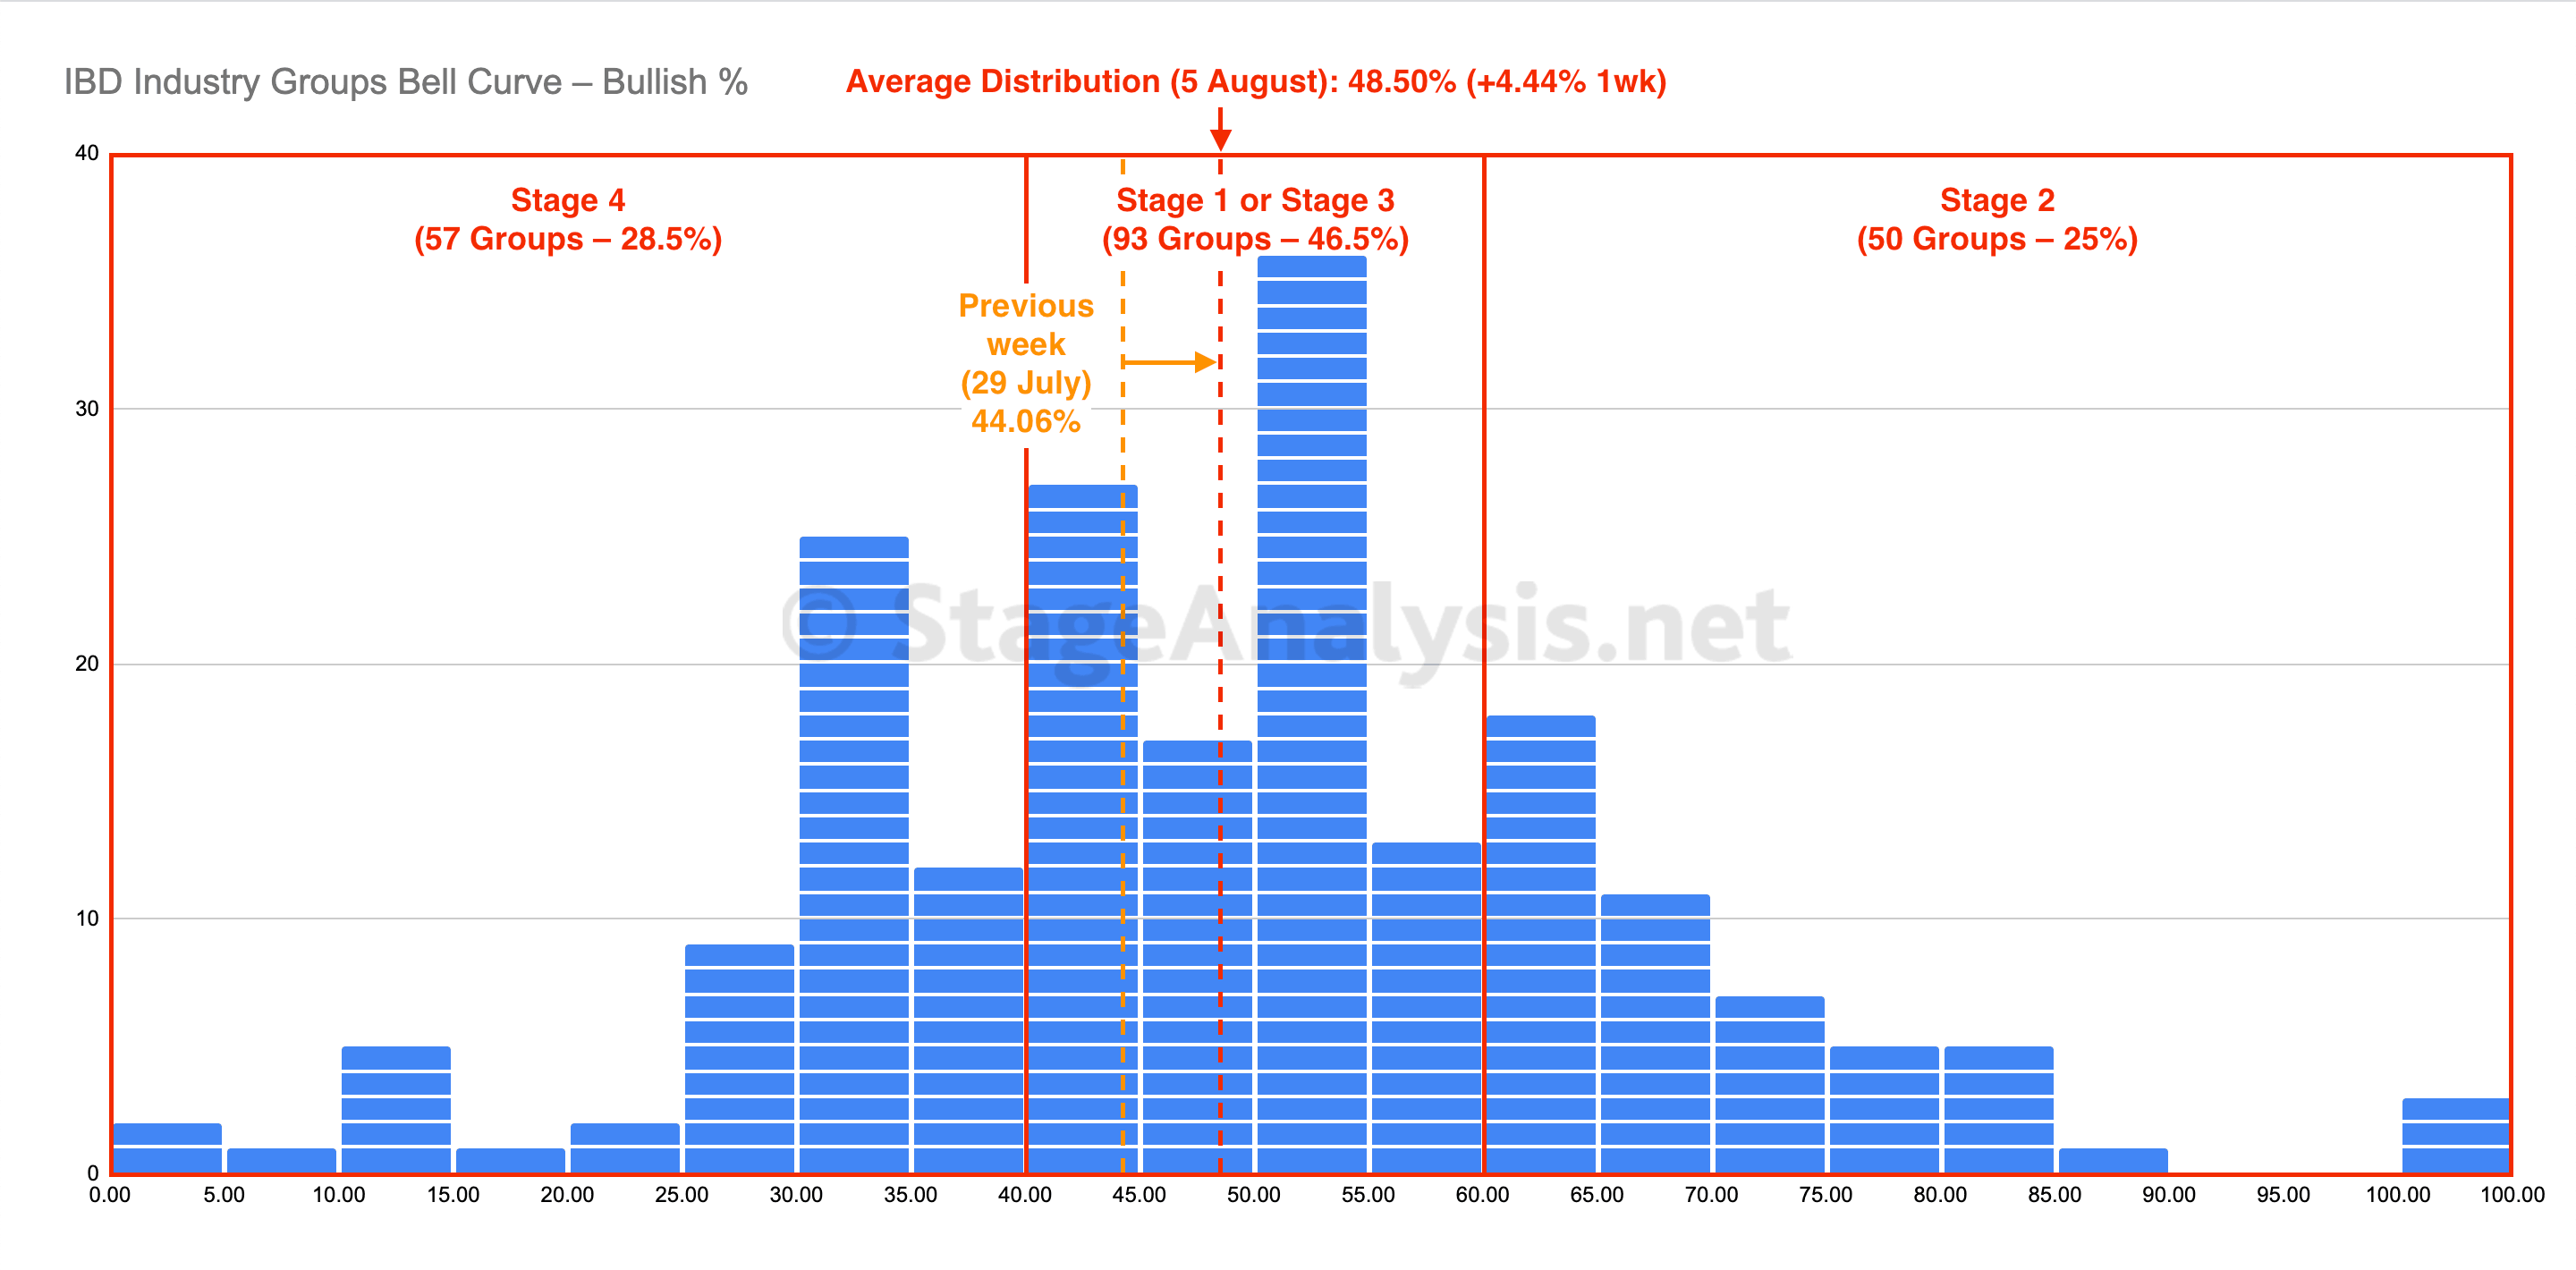
The IBD Industry Groups Bell Curve – Bullish Percent further improved over the last week, moving further into the Stage 1 zone (40% to 60% range), with an additional +10.5% of groups moving out of the Stage 4 zone (below 40%), and an additional +8% of groups moving into the Stage 2 zone (above 60%)...
Read More
06 August, 2022
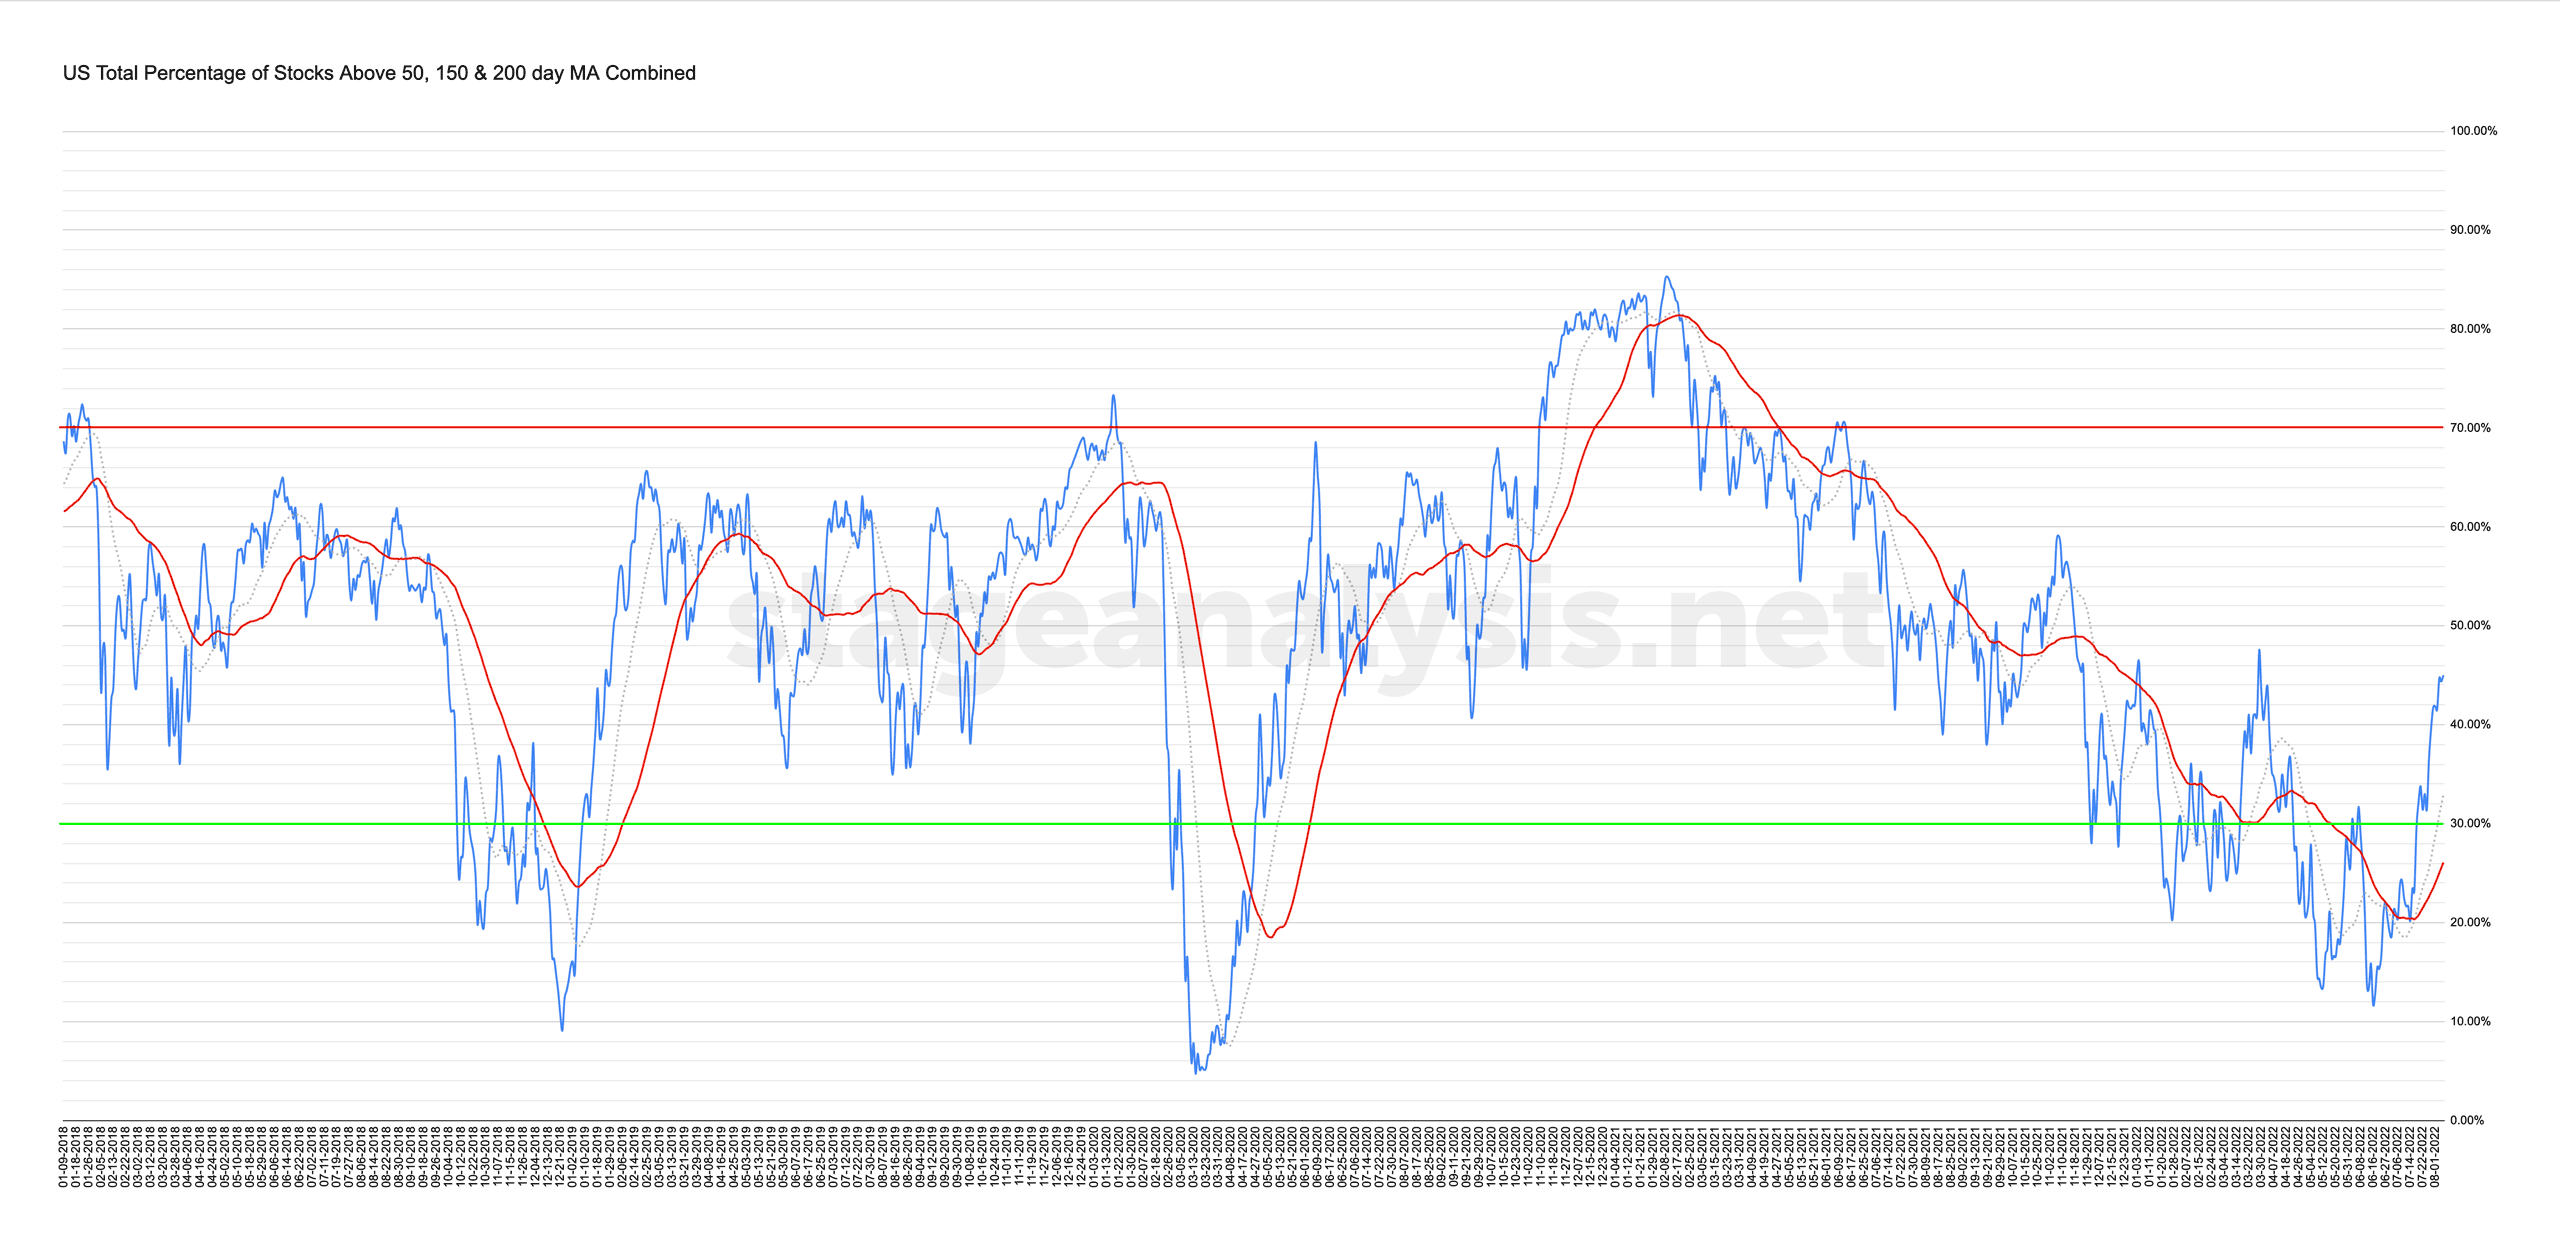
Market Breadth: Percentage of Stocks Above their 50 Day, 150 Day & 200 Day Moving Averages Combined
Custom Percentage of Stocks Above Their 50 Day, 150 Day & 200 Day Moving Averages Combined Market Breadth Charts for the Overall US Market, NYSE and Nasdaq for Market Timing and Strategy.
Read More
05 August, 2022
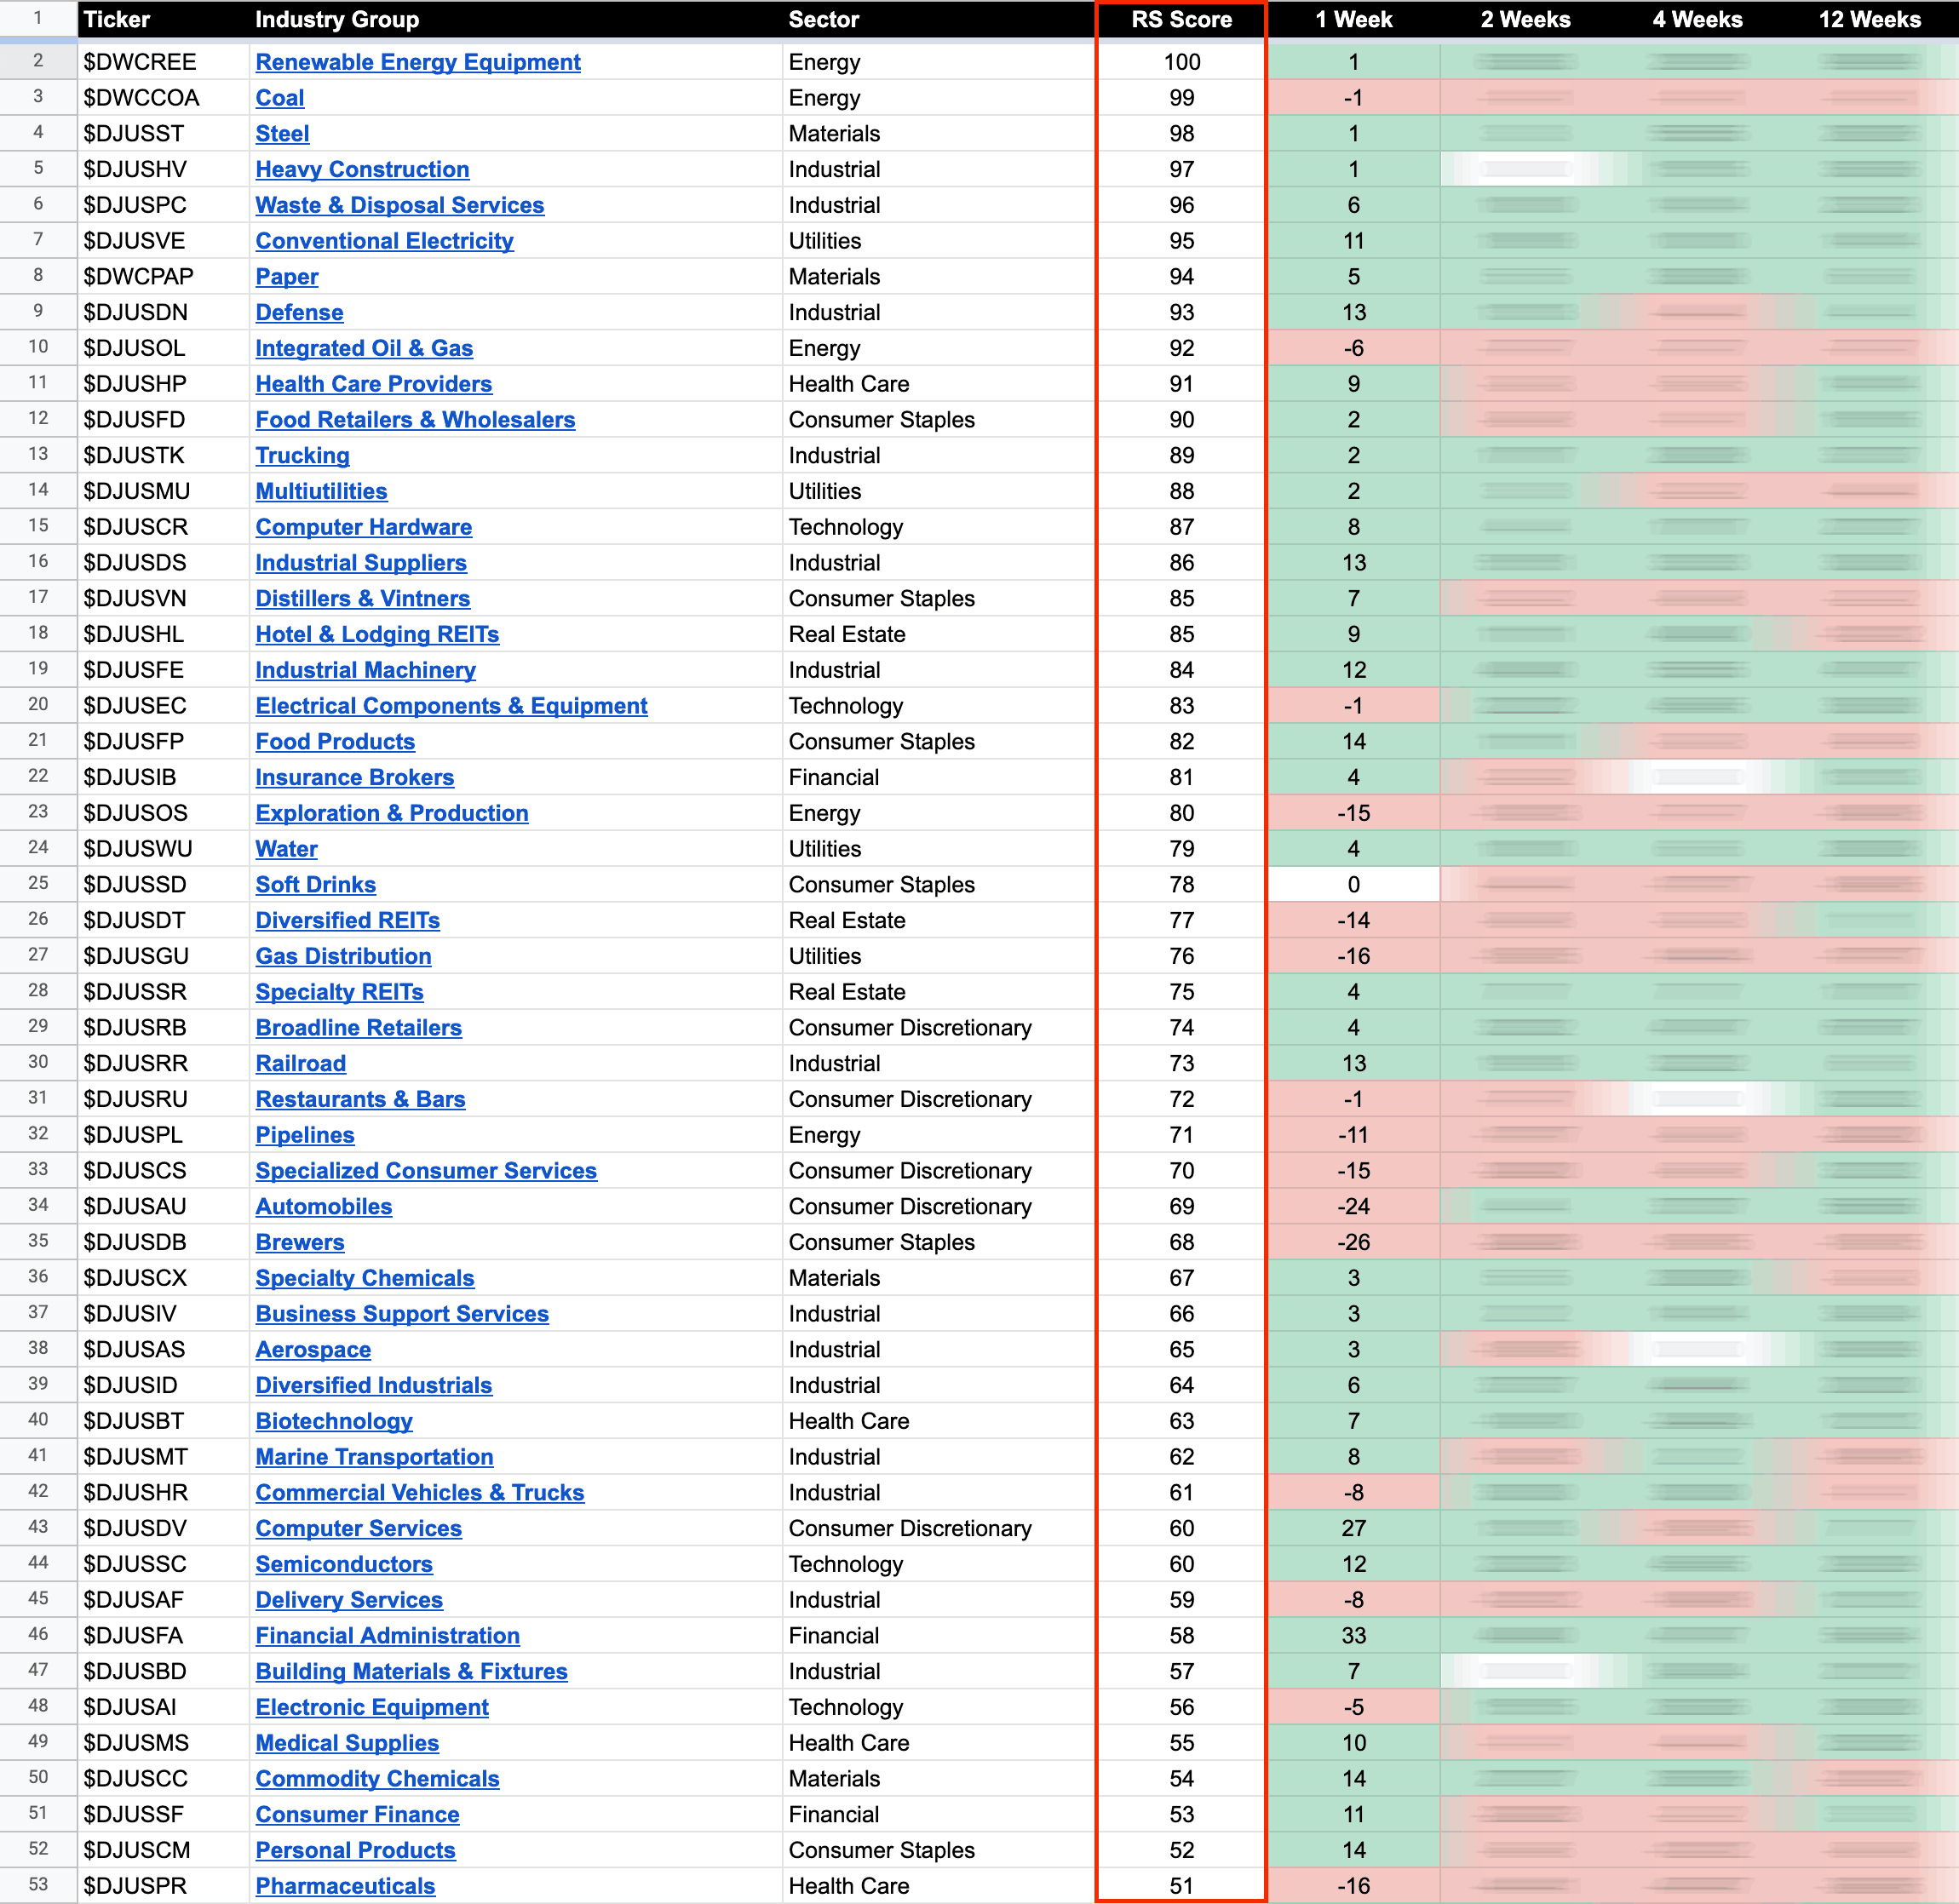
US Stocks Industry Groups Relative Strength Rankings
The purpose of the Relative Strength (RS) tables is to track the short, medium and long term RS changes of the individual groups to find the new leadership earlier than the crowd...
Read More
05 August, 2022
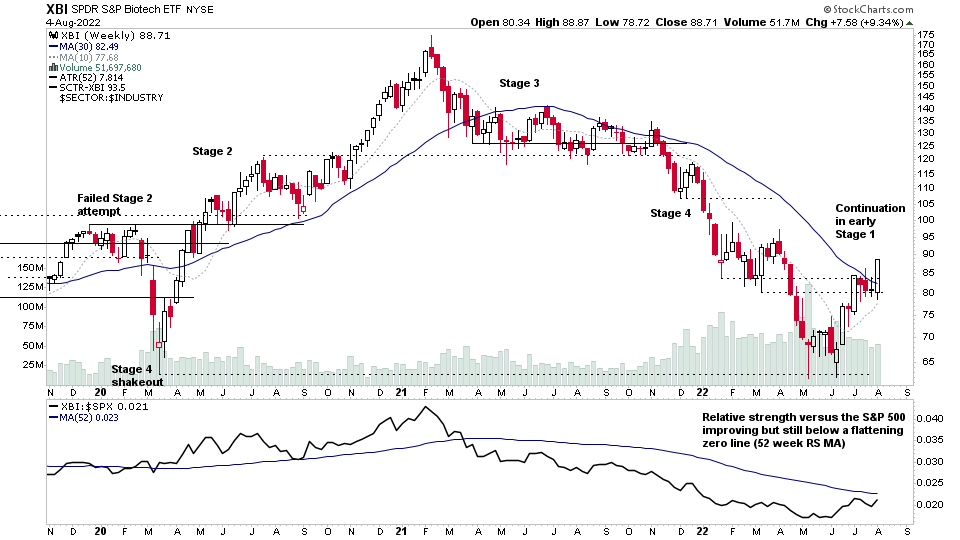
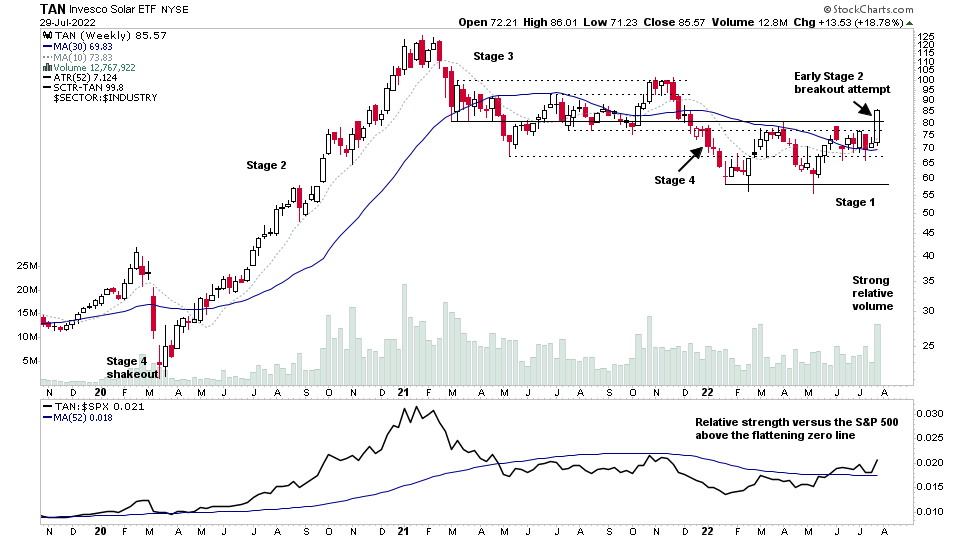
Biotech and Solar Stocks Continue To Be In-Focus and the US Stocks Watchlist – 4 August 2022
Biotechnology stocks group ETFs (XBI and IBB) made a continuation breakout today after a three week consolidation / shallow pullback within their early weekly Stage 1 advance – which has been one of the strongest group moves since the markets June swing low...
Read More
04 August, 2022
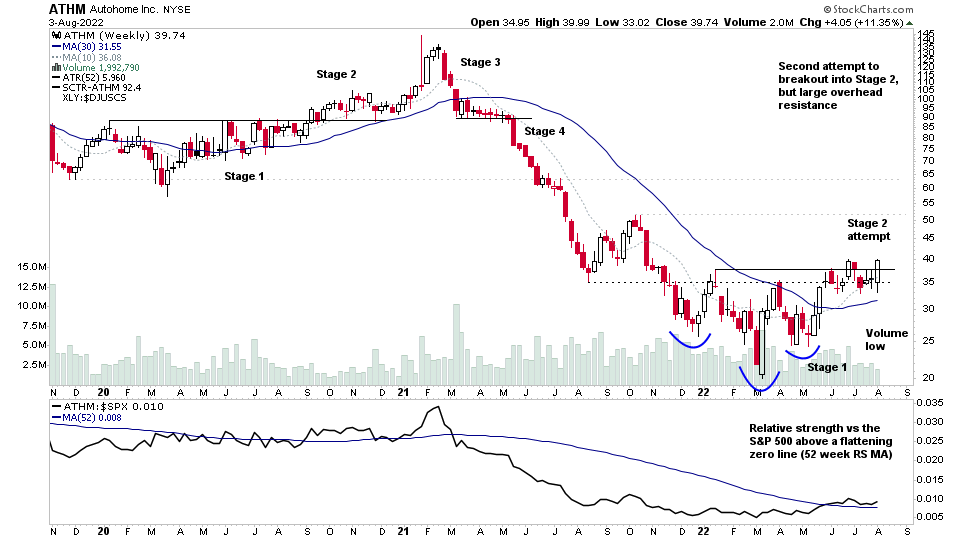
US Stocks Watchlist – 3 August 2022
For the watchlist from Wednesdays scans...
Read More
02 August, 2022
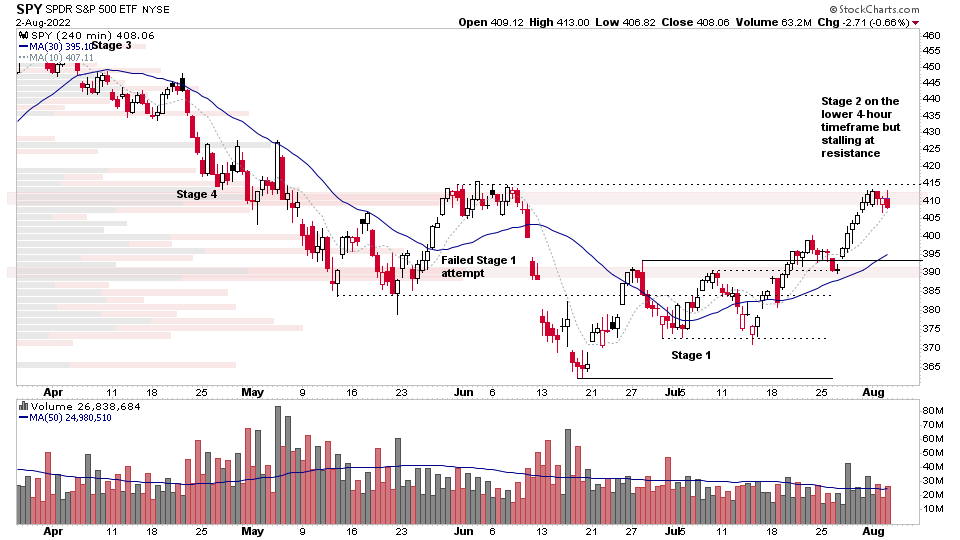
Stock Market Update and US Stocks Watchlist – 2 August 2022
It was a negative day for all the major US stock market indexes today with the S&P 500 closing down -0.67%, while the Nasdaq showed the best relative strength closing down -0.16%...
Read More
31 July, 2022
Stage Analysis Members Weekend Video – 31 July 2022 (1hr 36mins)
The Stage Analysis members weekend video begins with a focus on the Solar Group following this weeks climate spending deal, plus earnings results in multiple stocks in the group which caused a Stage 2 breakout attempt in the group on strong relative volume...
Read More

