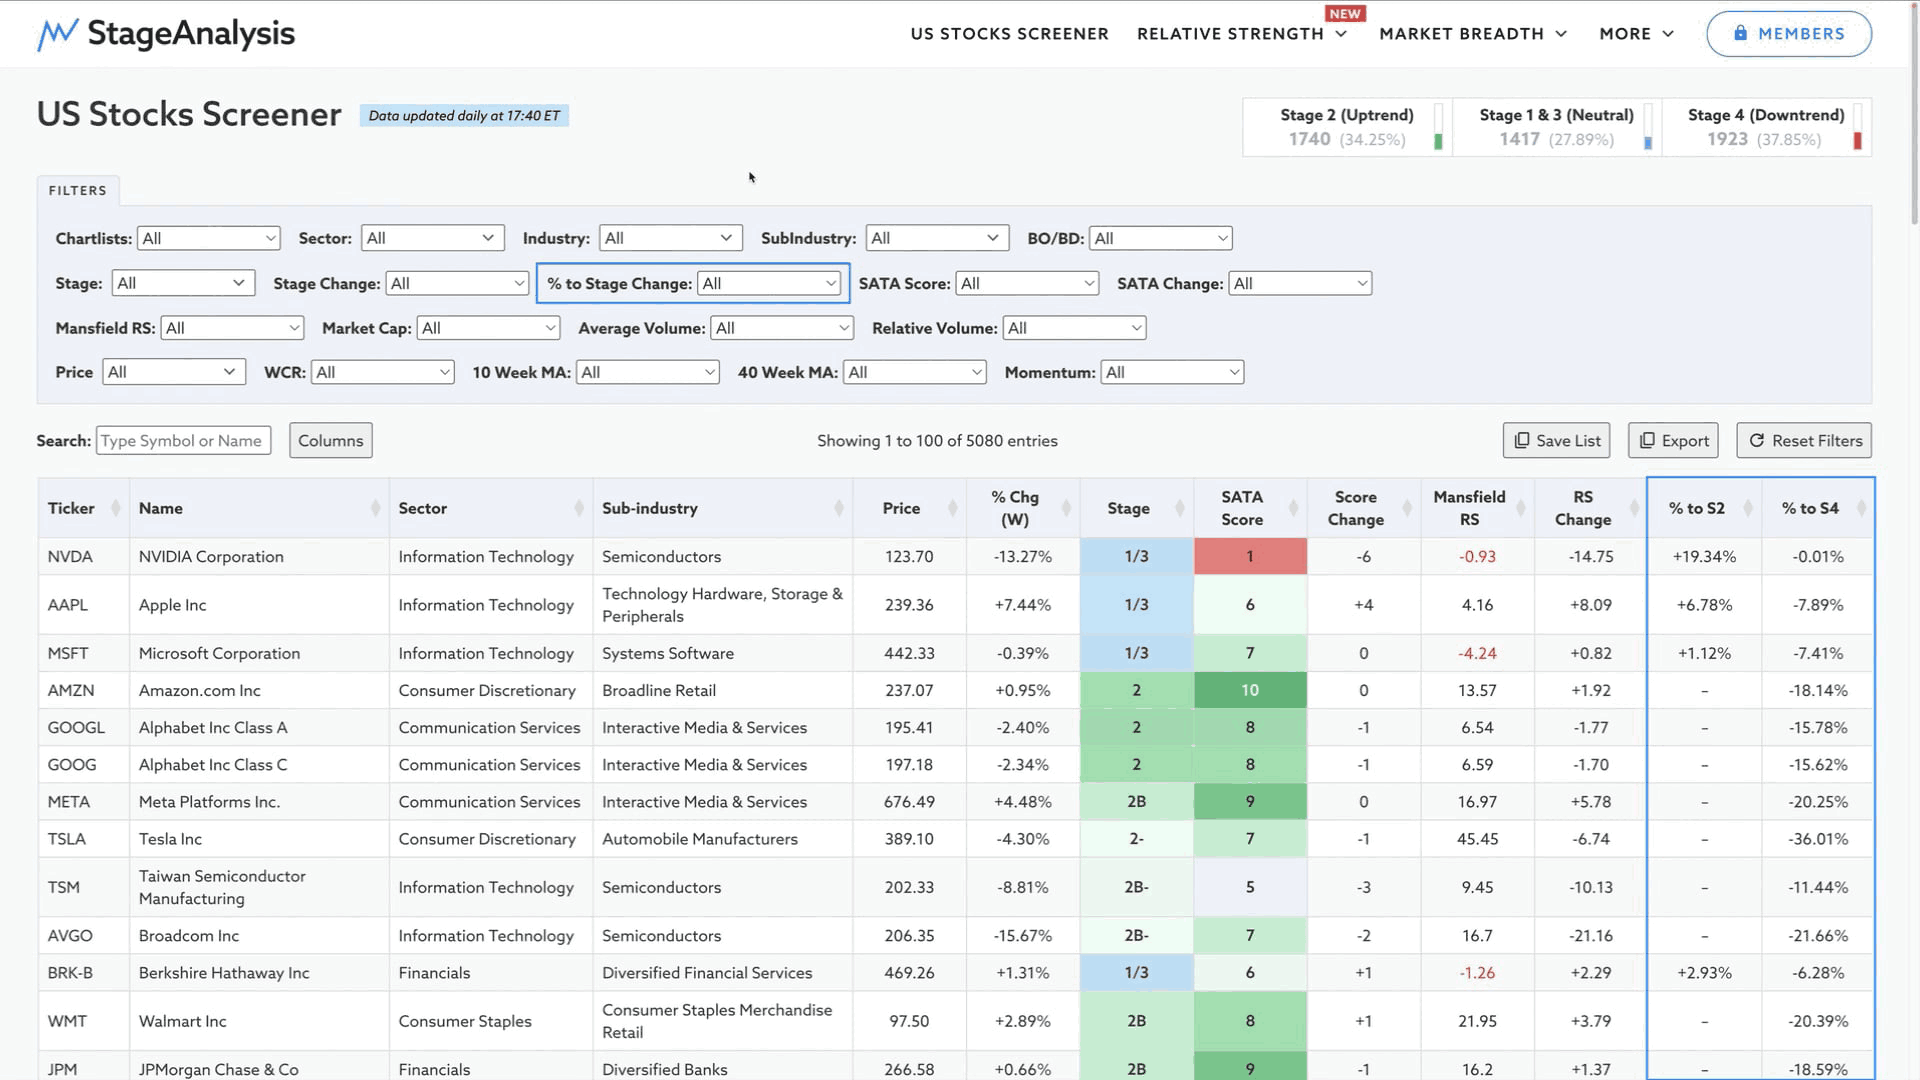
I'm pleased to announce that more new features have been added today to the Stage Analysis Screener and the weekly charts on the individual stock pages. Giving you even more precise ability to scan for stocks approaching the Stage 2 breakout level and Stage 4 breakdown level. These features are unique to the Stage Analysis website, so you won't find them anywhere else...
Read More

Blog
26 January, 2025
Stage Analysis Members Video – 26 January 2025 (1hr 14mins)
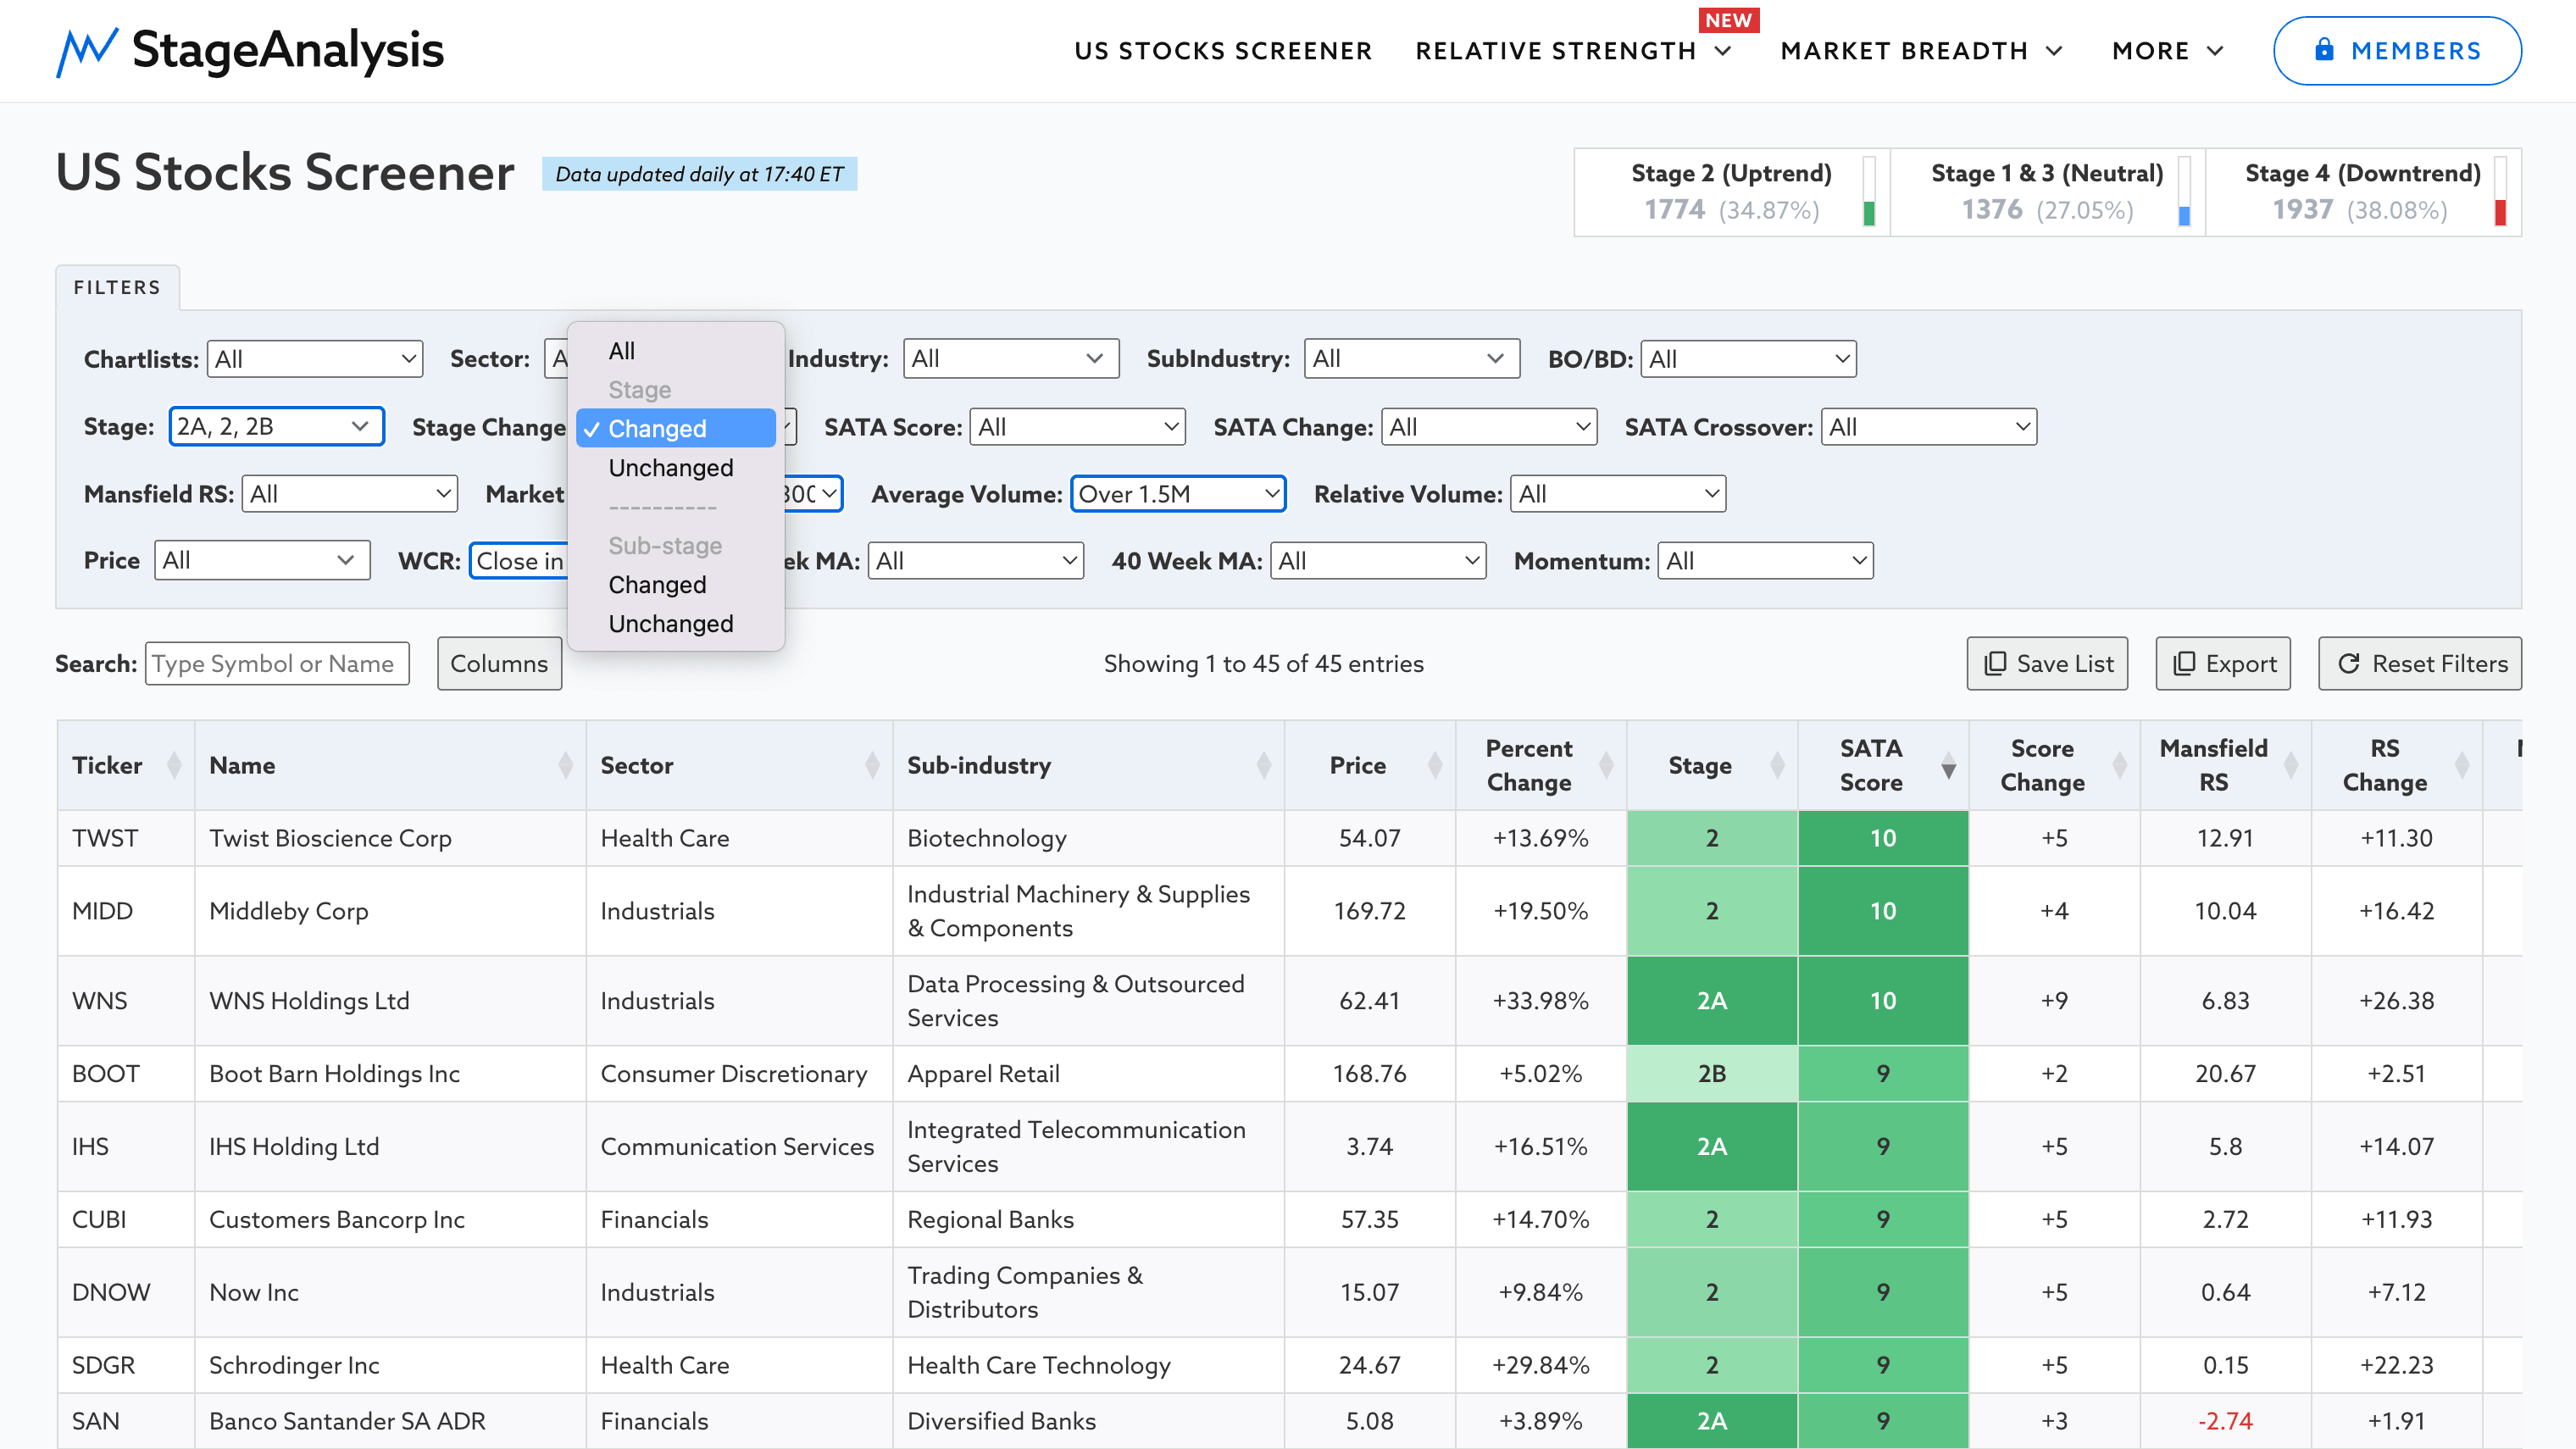
Stage Analysis members video begins this with a look at yet more new features – Stage Change and Momentum filters, plus the new Relative Strength section. Followed by the US Watchlist Stocks in detail on multiple timeframes, the Sector breadth and Sub-industries Bell Curves, the key Market Breadth Charts to determine the Weight of Evidence, Bitcoin & Ethereum and the Major US Stock Market Indexes Update and ETFs on the move...
Read More
25 January, 2025
Stan Weinstein's Stages Now Available in Stage Analysis Screener
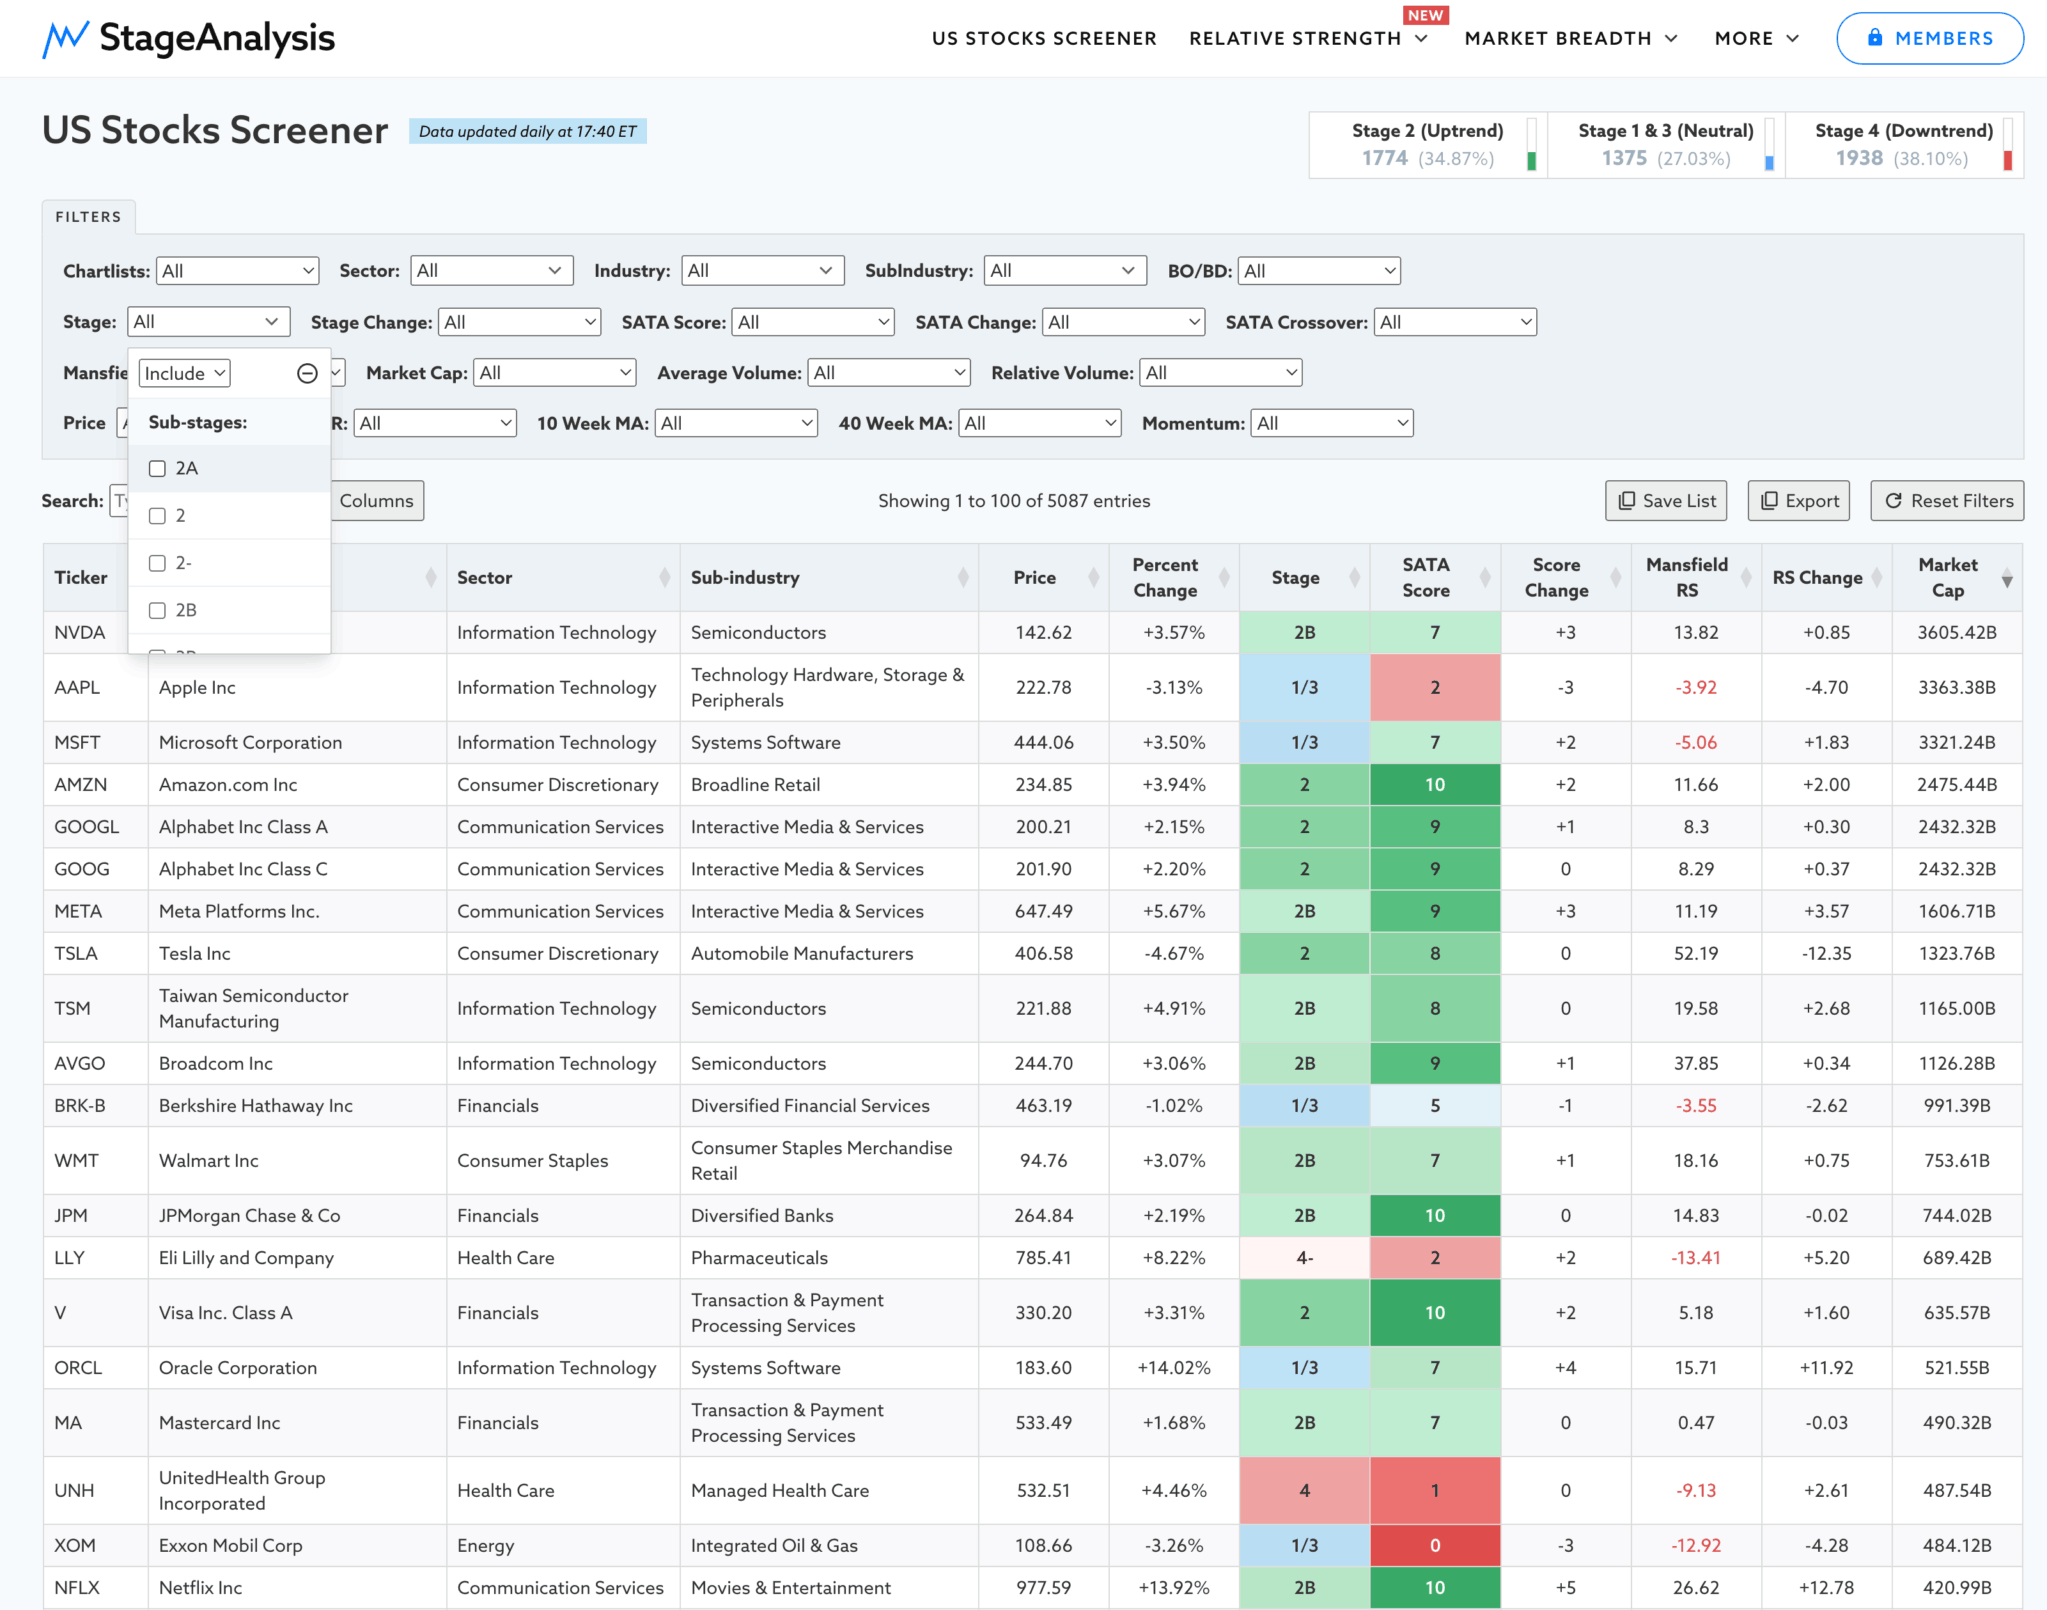
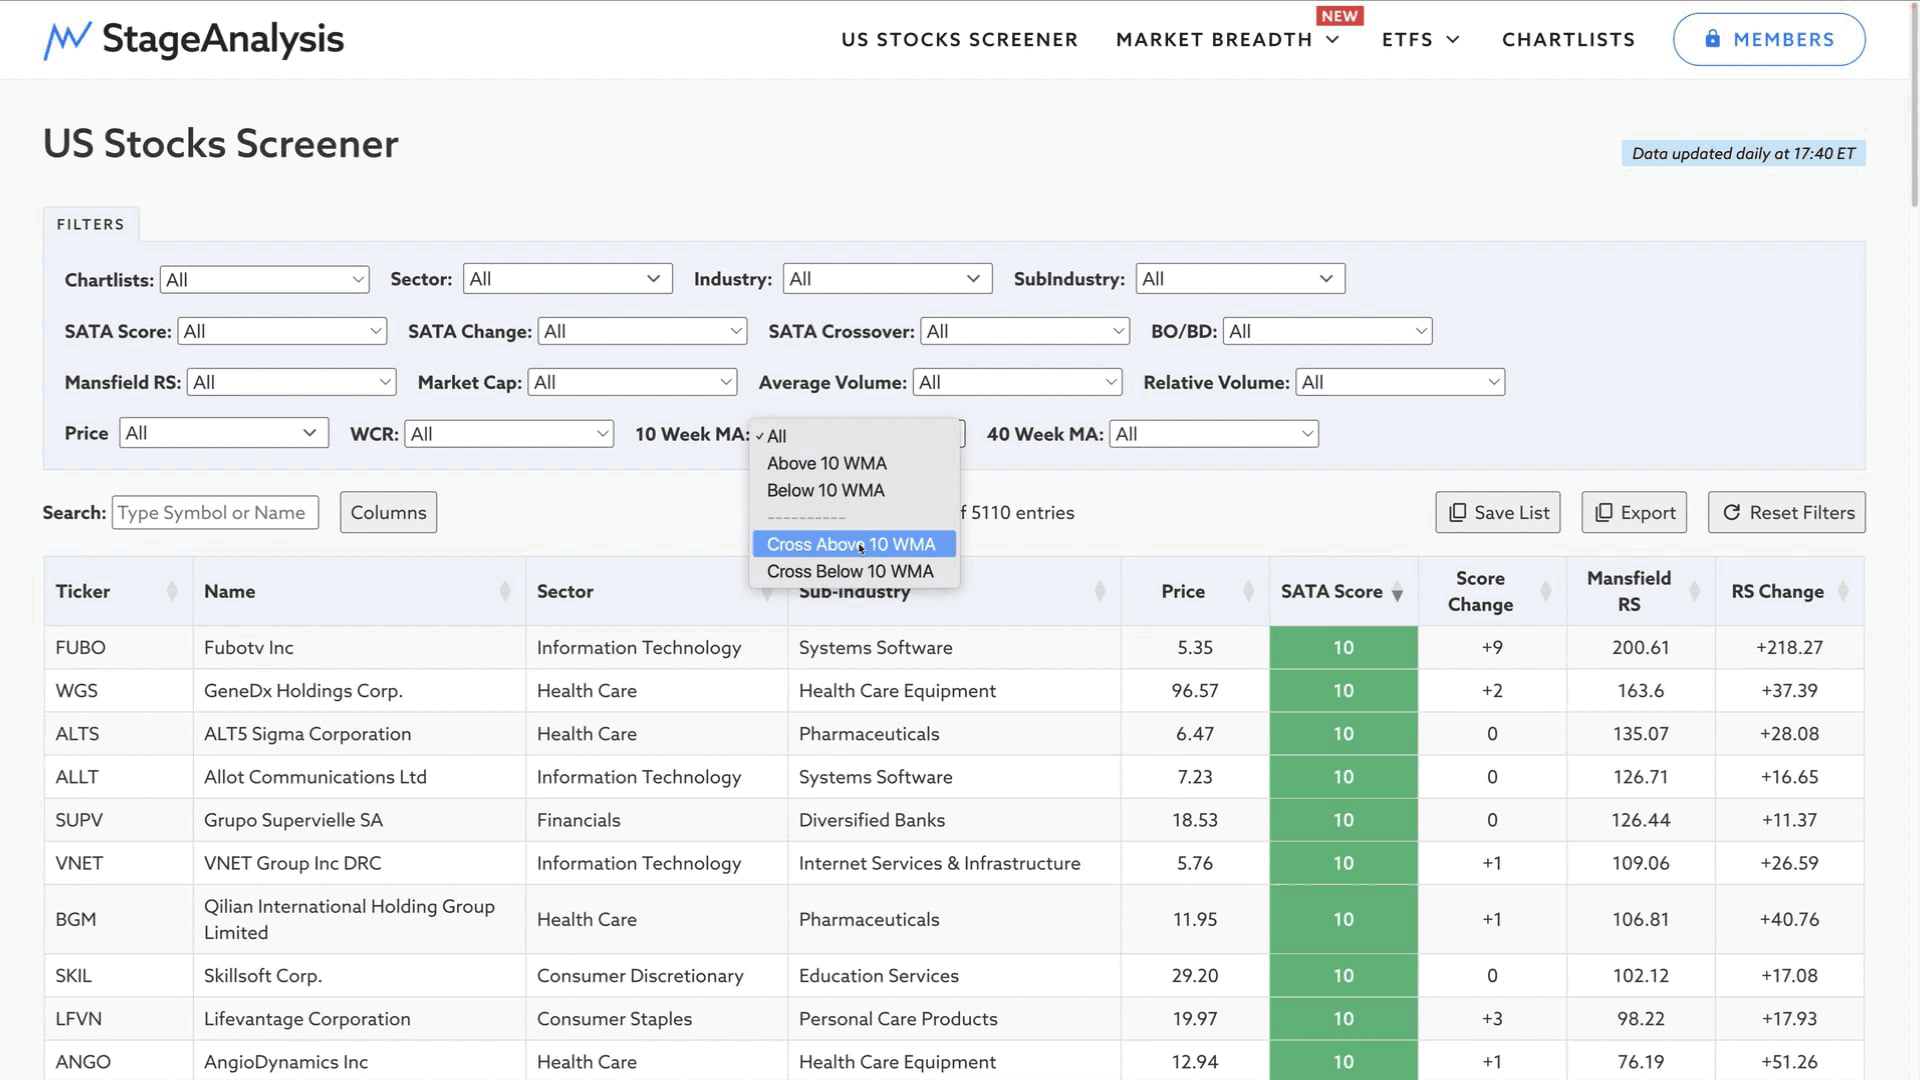
Stage Analysis members can now scan via the Stages in the Stage Analysis Screener using the Stage filter (on the top left in the second row of the filters on desktop). Which opens a dropdown with the 11 sub-stages available on the site...
Read More
19 January, 2025
Stage Analysis Members Video – 19 January 2025 (1hr 4mins)
Stage Analysis members video starting with a look at the new Stage tools, followed by the US Watchlist Stocks in detail on multiple timeframes, the Sector breadth and Sub-industries Bell Curves, the key Market Breadth Charts to determine the Weight of Evidence, Bitcoin & Ethereum and the Major US Stock Market Indexes Update.
Read More
12 January, 2025
Stage Analysis Members Video – 12 January 2025 (59mins)
Stage Analysis members video starting with a look at the US Watchlist Stocks in detail on multiple timeframes, previewing the upcoming Stage 2A and Stage 4A tools for the screener, the Sector breadth and Sub-industries Bell Curves, the key Market Breadth Charts to determine the Weight of Evidence, Bitcoin & Ethereum and the Major US Stock Market Indexes Update.
Read More
09 January, 2025
New Features Added to the Stage Analysis Screener – 9 January 2025 (12mins)
Three new features have been added to the Stage Analysis Screener this week...
Read More
05 January, 2025
Stage Analysis Members Video – 5 January 2025 (57mins)
Stage Analysis members video starting with a look at the US Watchlist Stocks in detail on multiple timeframes, the Sector breadth and Sub-industries Bell Curves, the key Market Breadth Charts to determine the Weight of Evidence, Bitcoin & Ethereum and the Major US Stock Market Indexes Update.
Read More
29 December, 2024
Stage Analysis Members Video – 29 December 2024 (54mins)
Stage Analysis members video discussing the US Watchlist Stocks in detail on multiple timeframes, the Sector breadth and Sub-industries Bell Curves, the key Market Breadth Charts to determine the Weight of Evidence, Bitcoin & Ethereum and the Major US Stock Market Indexes Update.
Read More
22 December, 2024
Stage Analysis Members Video – 22 December 2024 (1hr 11mins)
Stage Analysis members video discussing the US Watchlist Stocks in detail on multiple timeframes, the Sector breadth and Sub-industries Bell Curves, the key Market Breadth Charts to determine the Weight of Evidence, the Significant Bars, Bitcoin & Ethereum and the Major US Stock Market Indexes Update.
Read More
15 December, 2024
Stage Analysis Members Video – 15 December 2024 (59mins)
Stage Analysis members video discussing the Significant Bars, then the US Watchlist Stocks in detail on multiple timeframes, the Sector breadth and Sub-industries Bell Curves, the key Market Breadth Charts to determine the Weight of Evidence, Bitcoin & Ethereum and the Major US Stock Market Indexes Update.
Read More