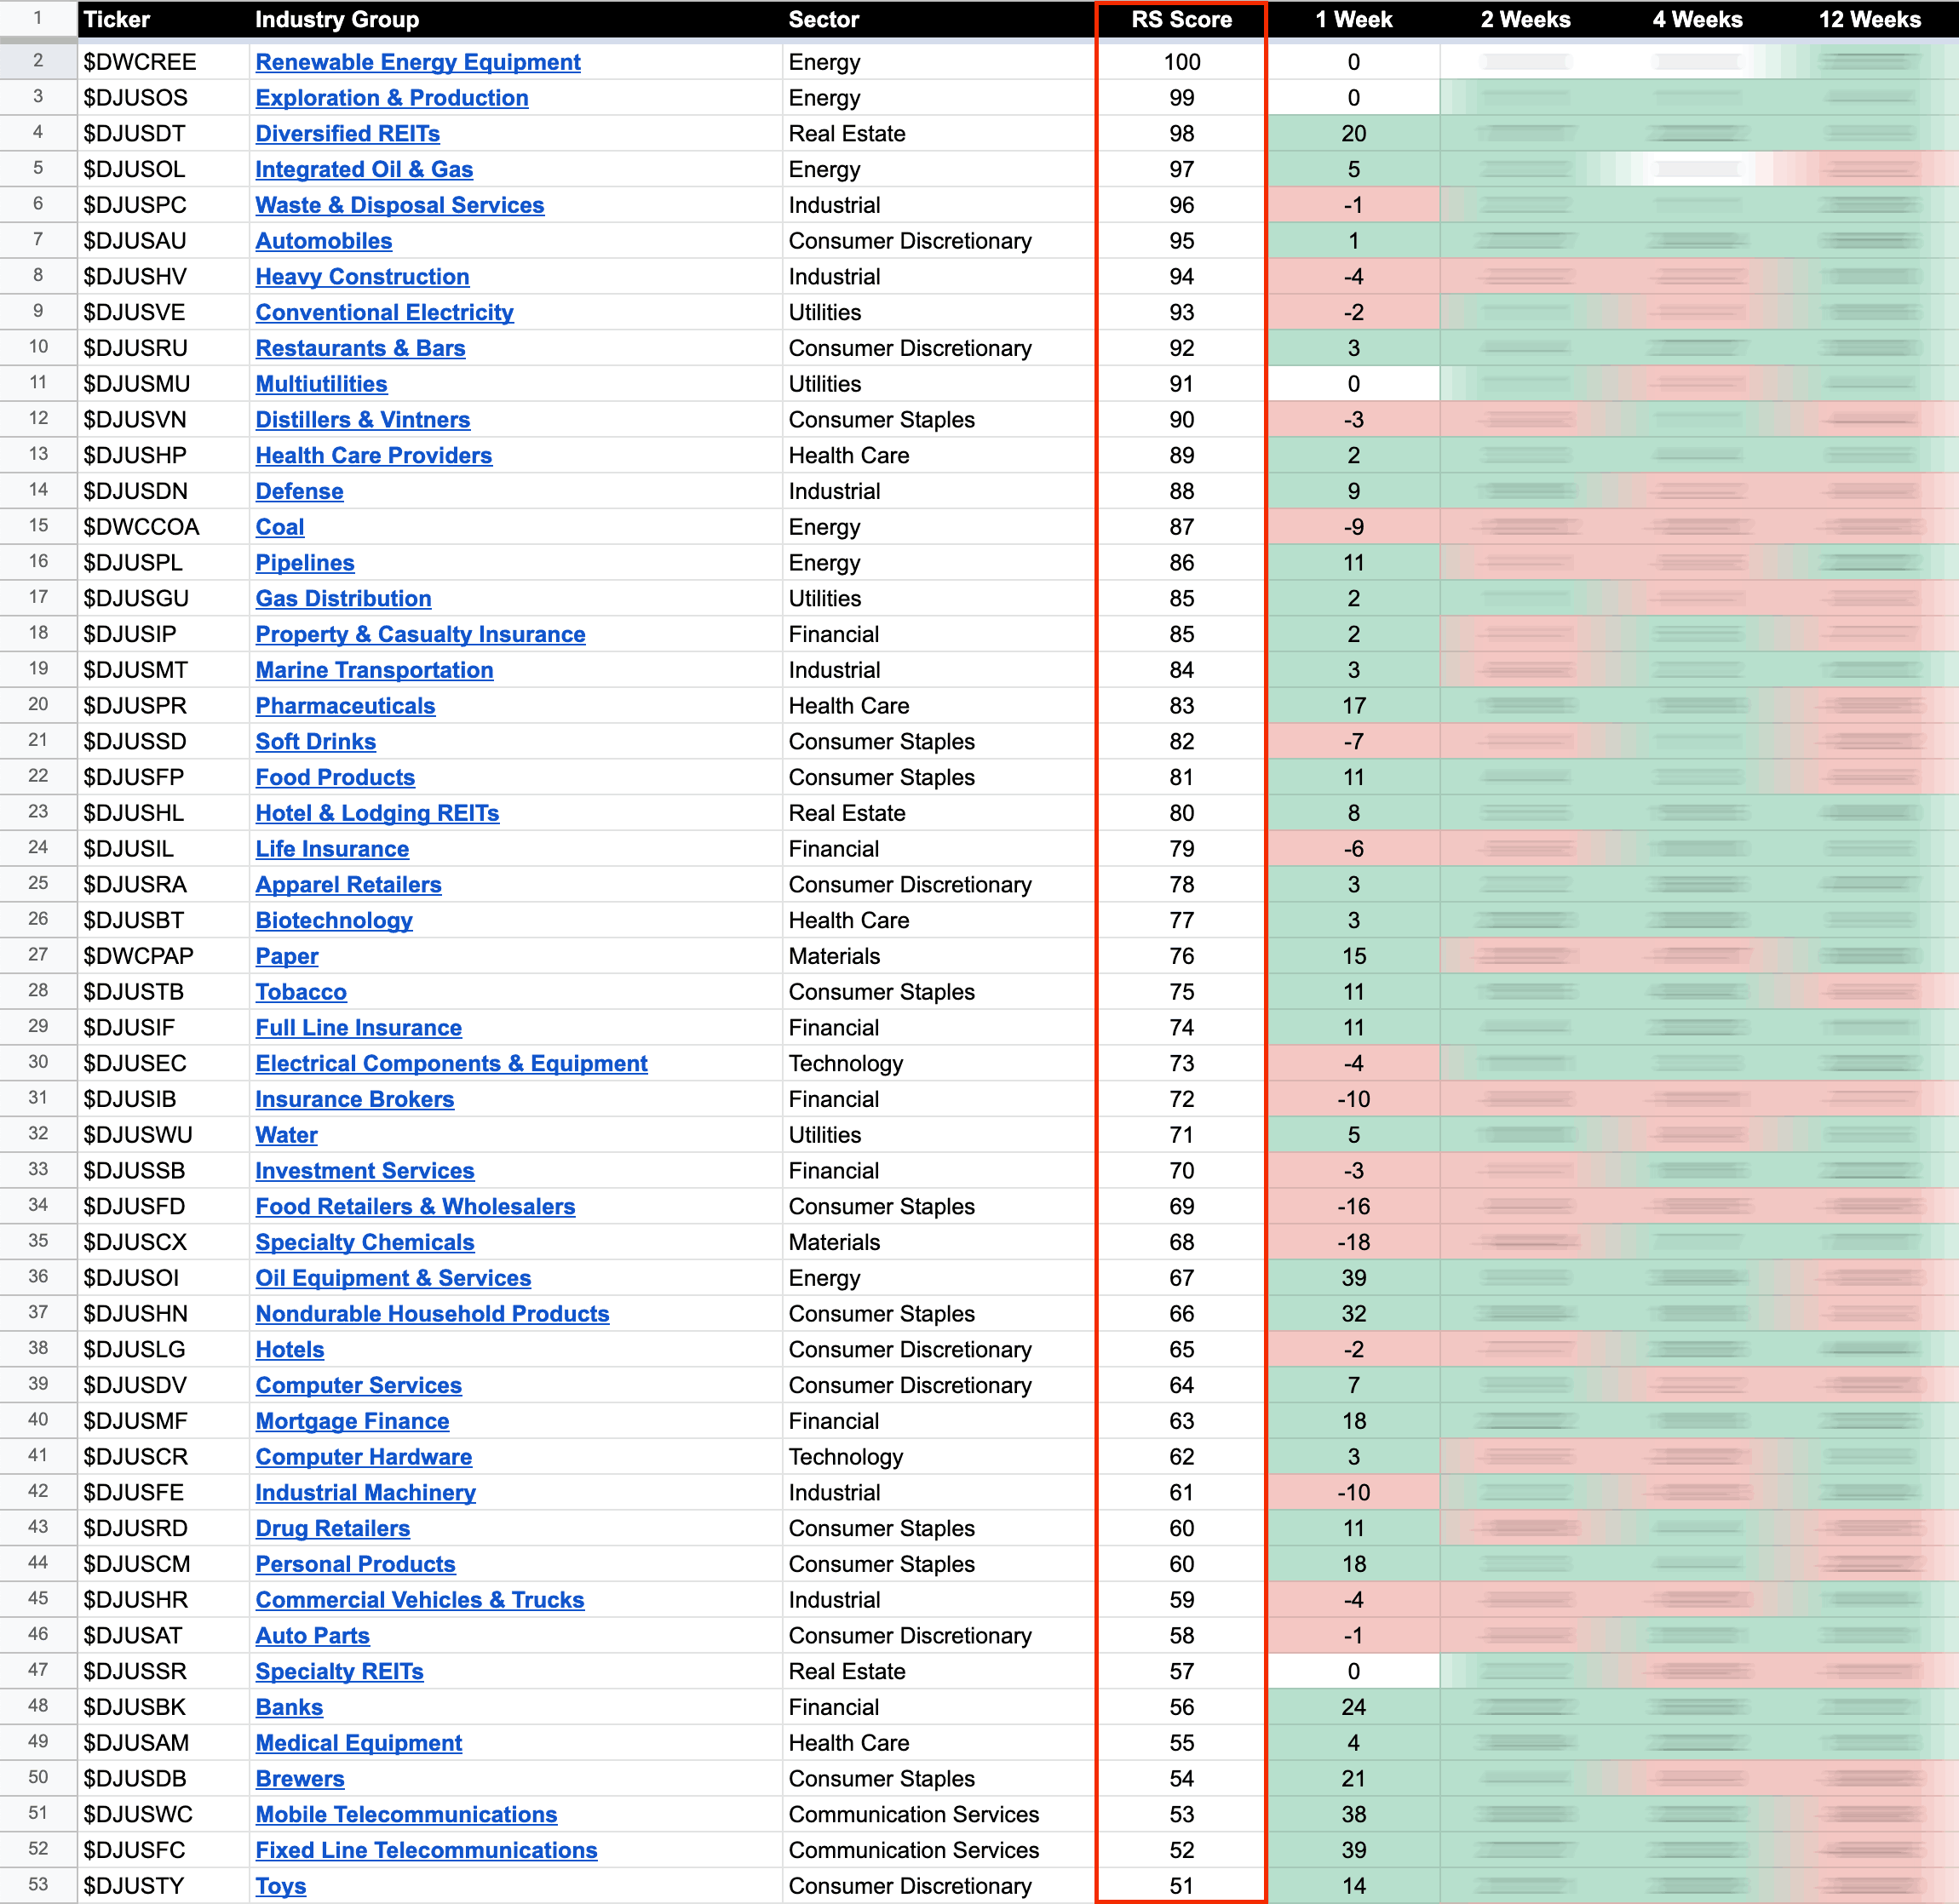
The purpose of the Relative Strength (RS) tables is to track the short, medium and long term RS changes of the individual groups to find the new leadership earlier than the crowd...
Read More
Blog
16 September, 2022
US Stocks Industry Groups Relative Strength Rankings
15 September, 2022
US Stocks Watchlist – 15 September 2022
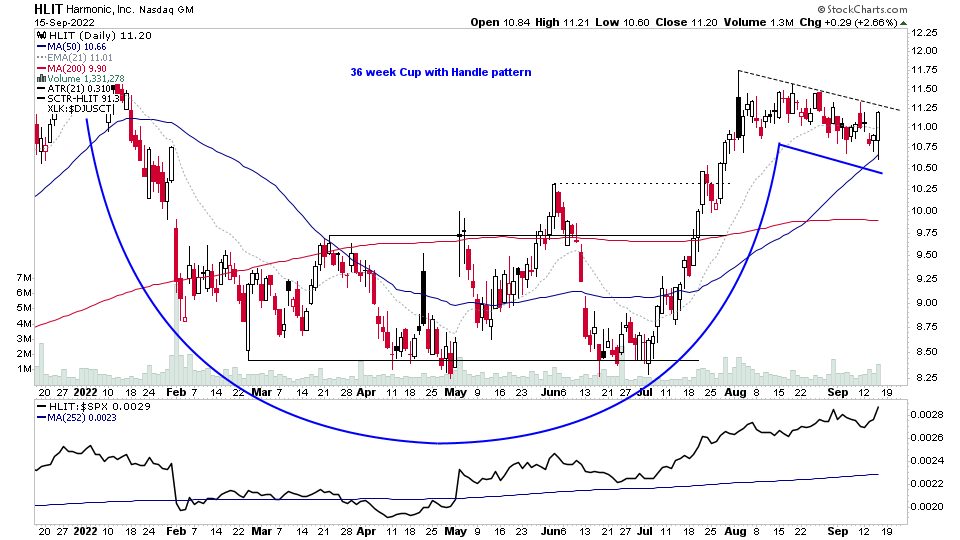
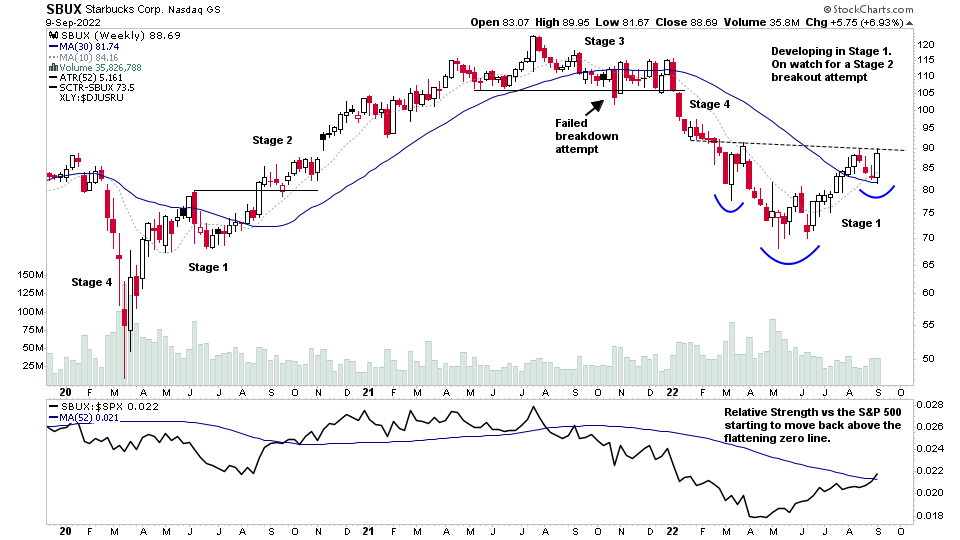
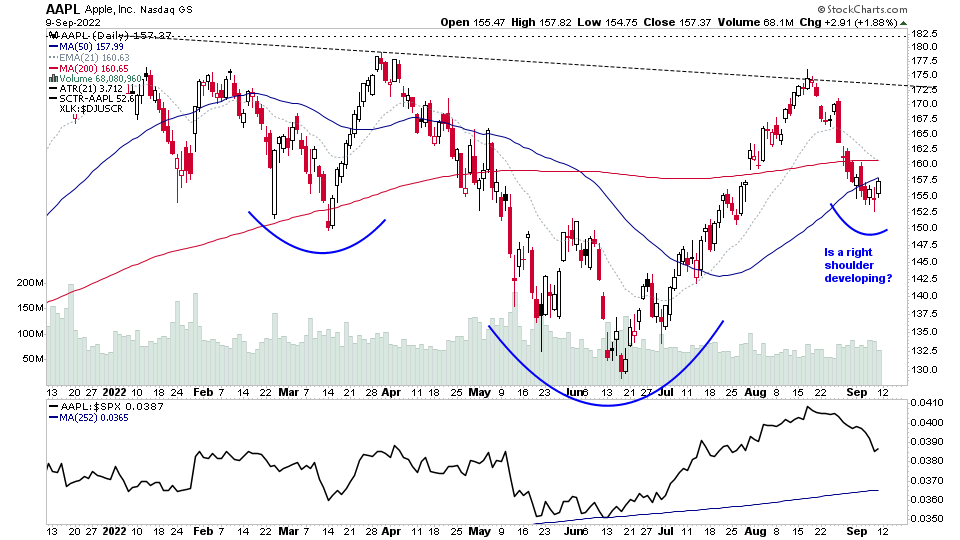
Many individual stocks continue to show strong relative strength versus the market action and have continued on with the development of Stage 1 bases, and an increasing number of stocks have been moving into early Stage 2. However, many "setups" as people like to call them have become broken, with large shakeouts and breakdowns of patterns in many areas also...
Read More
14 September, 2022
US Stocks Watchlist – 14 September 2022
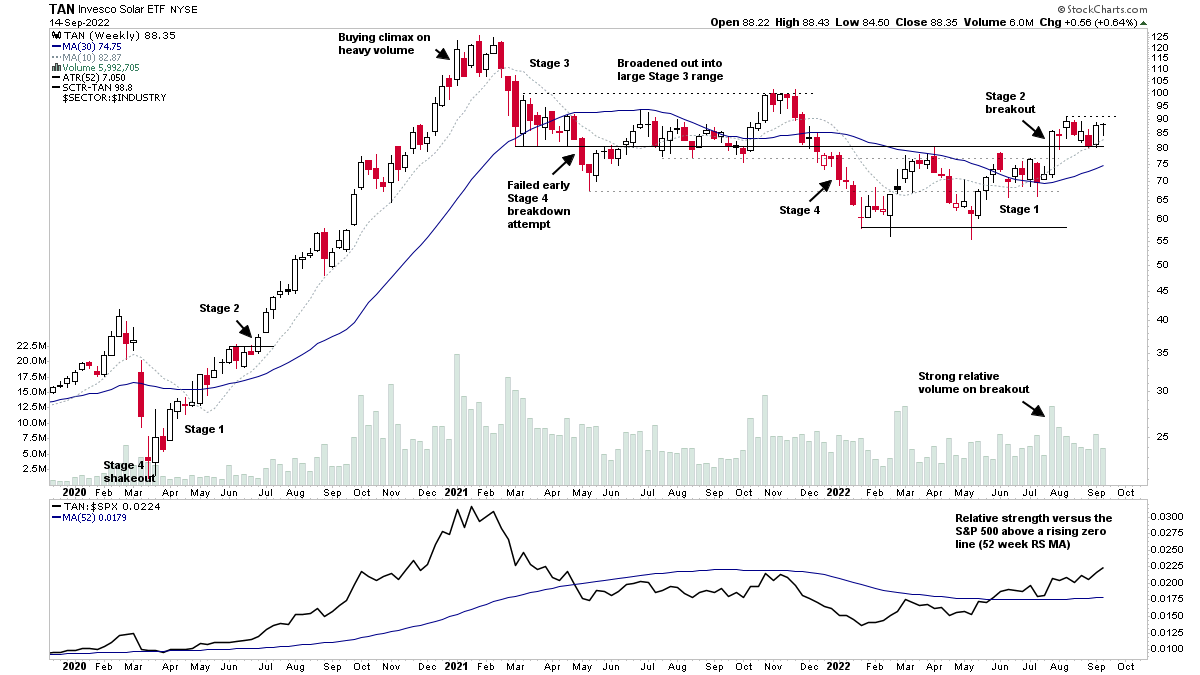
For the watchlist from Wednesdays scans. Software and Renewable Energy Equipment continue to be the main them this week...
Read More
14 September, 2022
Stage Analysis Members Midweek Video – 14 September 2022 (52 mins)
Todays members video focuses on the US watchlist stocks from the last few days, as well discussing the leading Renewable Energy group and a few Stage 2 breakout attempts.
Read More
13 September, 2022
US Stocks Watchlist – 13 September 2022
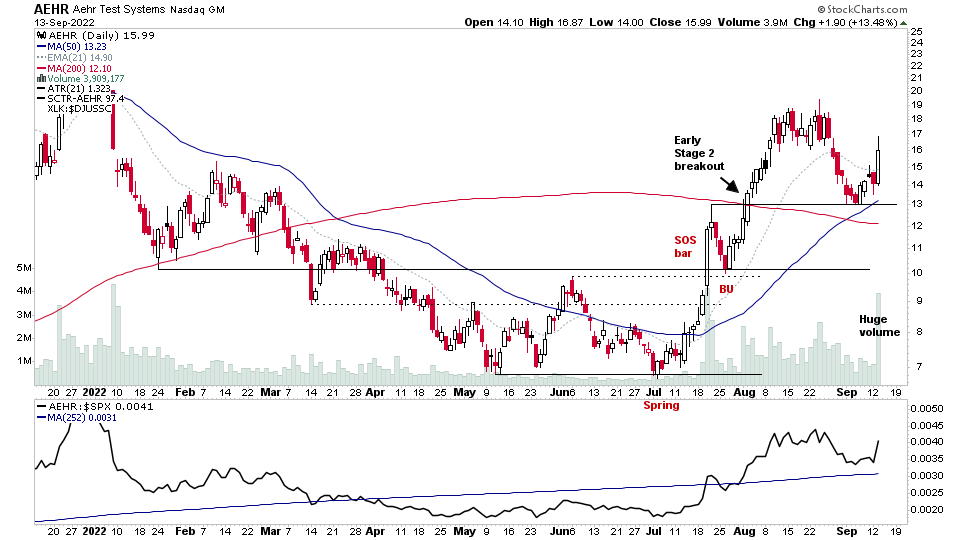
There were 43 stocks for the US stocks watchlist today. Software and Renewable Energy Equipment were the major group themes today...
Read More
12 September, 2022
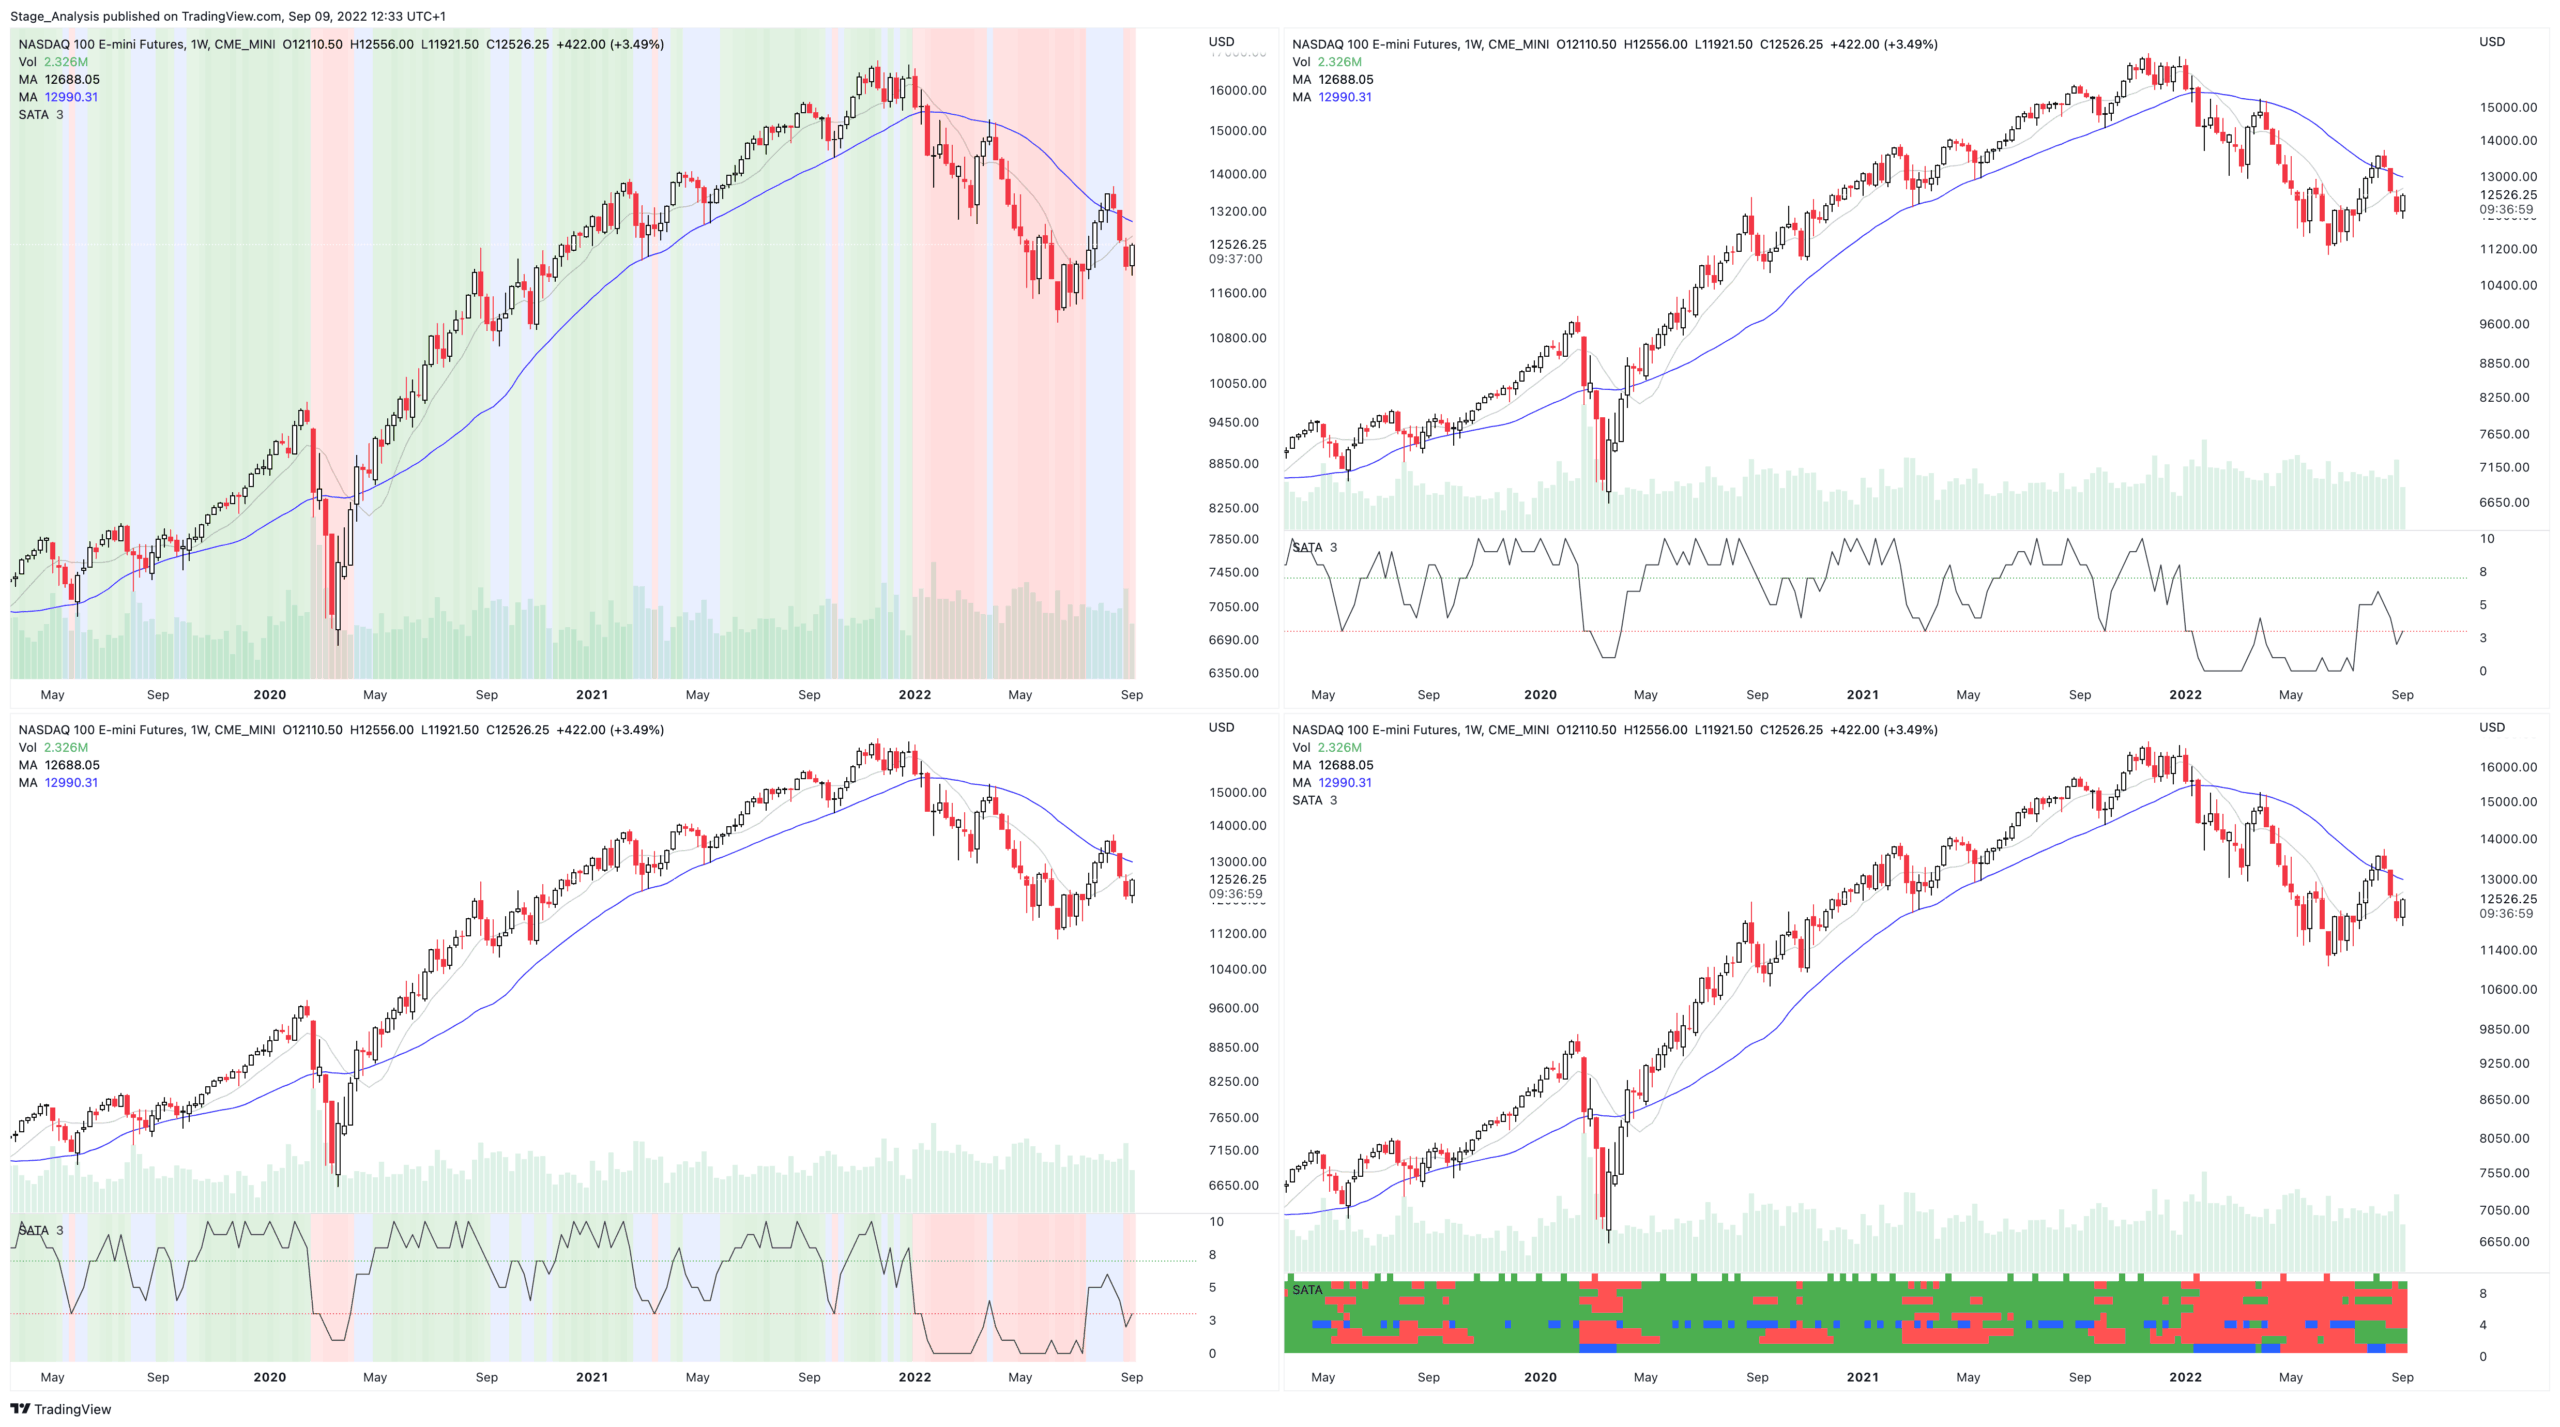
How to setup the SATA: Stage Analysis Technical Attributes Indicator for Tradingview
In this brief 12 minute video I explain some different setup options for the Stage Analysis Technical Attributes (SATA) Indicator, which is available to use for free on Tradingview...
Read More
11 September, 2022
Stage Analysis Members Weekend Video – 11 September 2022 (1hr 34mins)
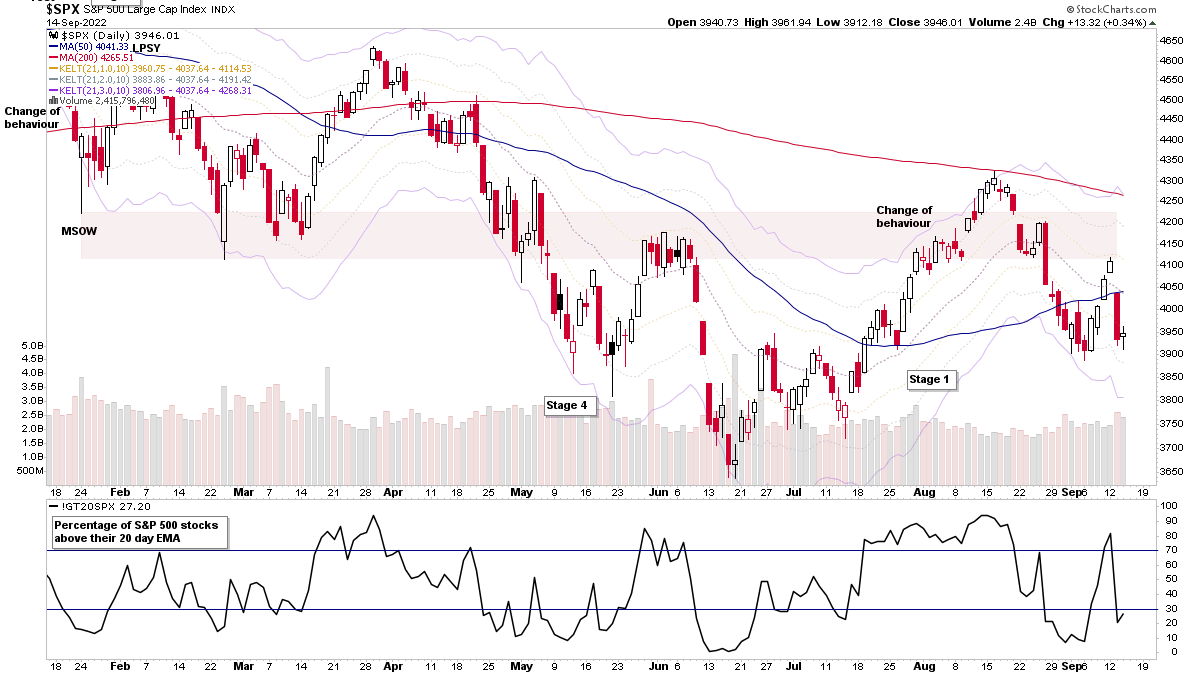
The weekend video begins with a detailed look at some of the weeks strong volume Stage 2 movers weekly charts and some interesting Stage 1 stocks too. Then an update on the major indexes developing Stage 1 base structures. What's moving in the US Industry Groups Relative Strength Rankings and the IBD Industry Groups Bell Curve – Bullish Percent...
Read More
11 September, 2022
Stage 1 Bases Continue To Develop in More Groups and the US Stocks Watchlist – 11 September 2022
There was a huge amount of scan results to go through again, which usually is suggestive of being extended in the short-term, although on the rarer occasions it will be a major breakout move. So the probabilities favour being extended. But there are lots of developing Stage 1 base structures as you might have noticed from the recent posts...
Read More
10 September, 2022
IBD Industry Groups Bell Curve – Bullish Percent
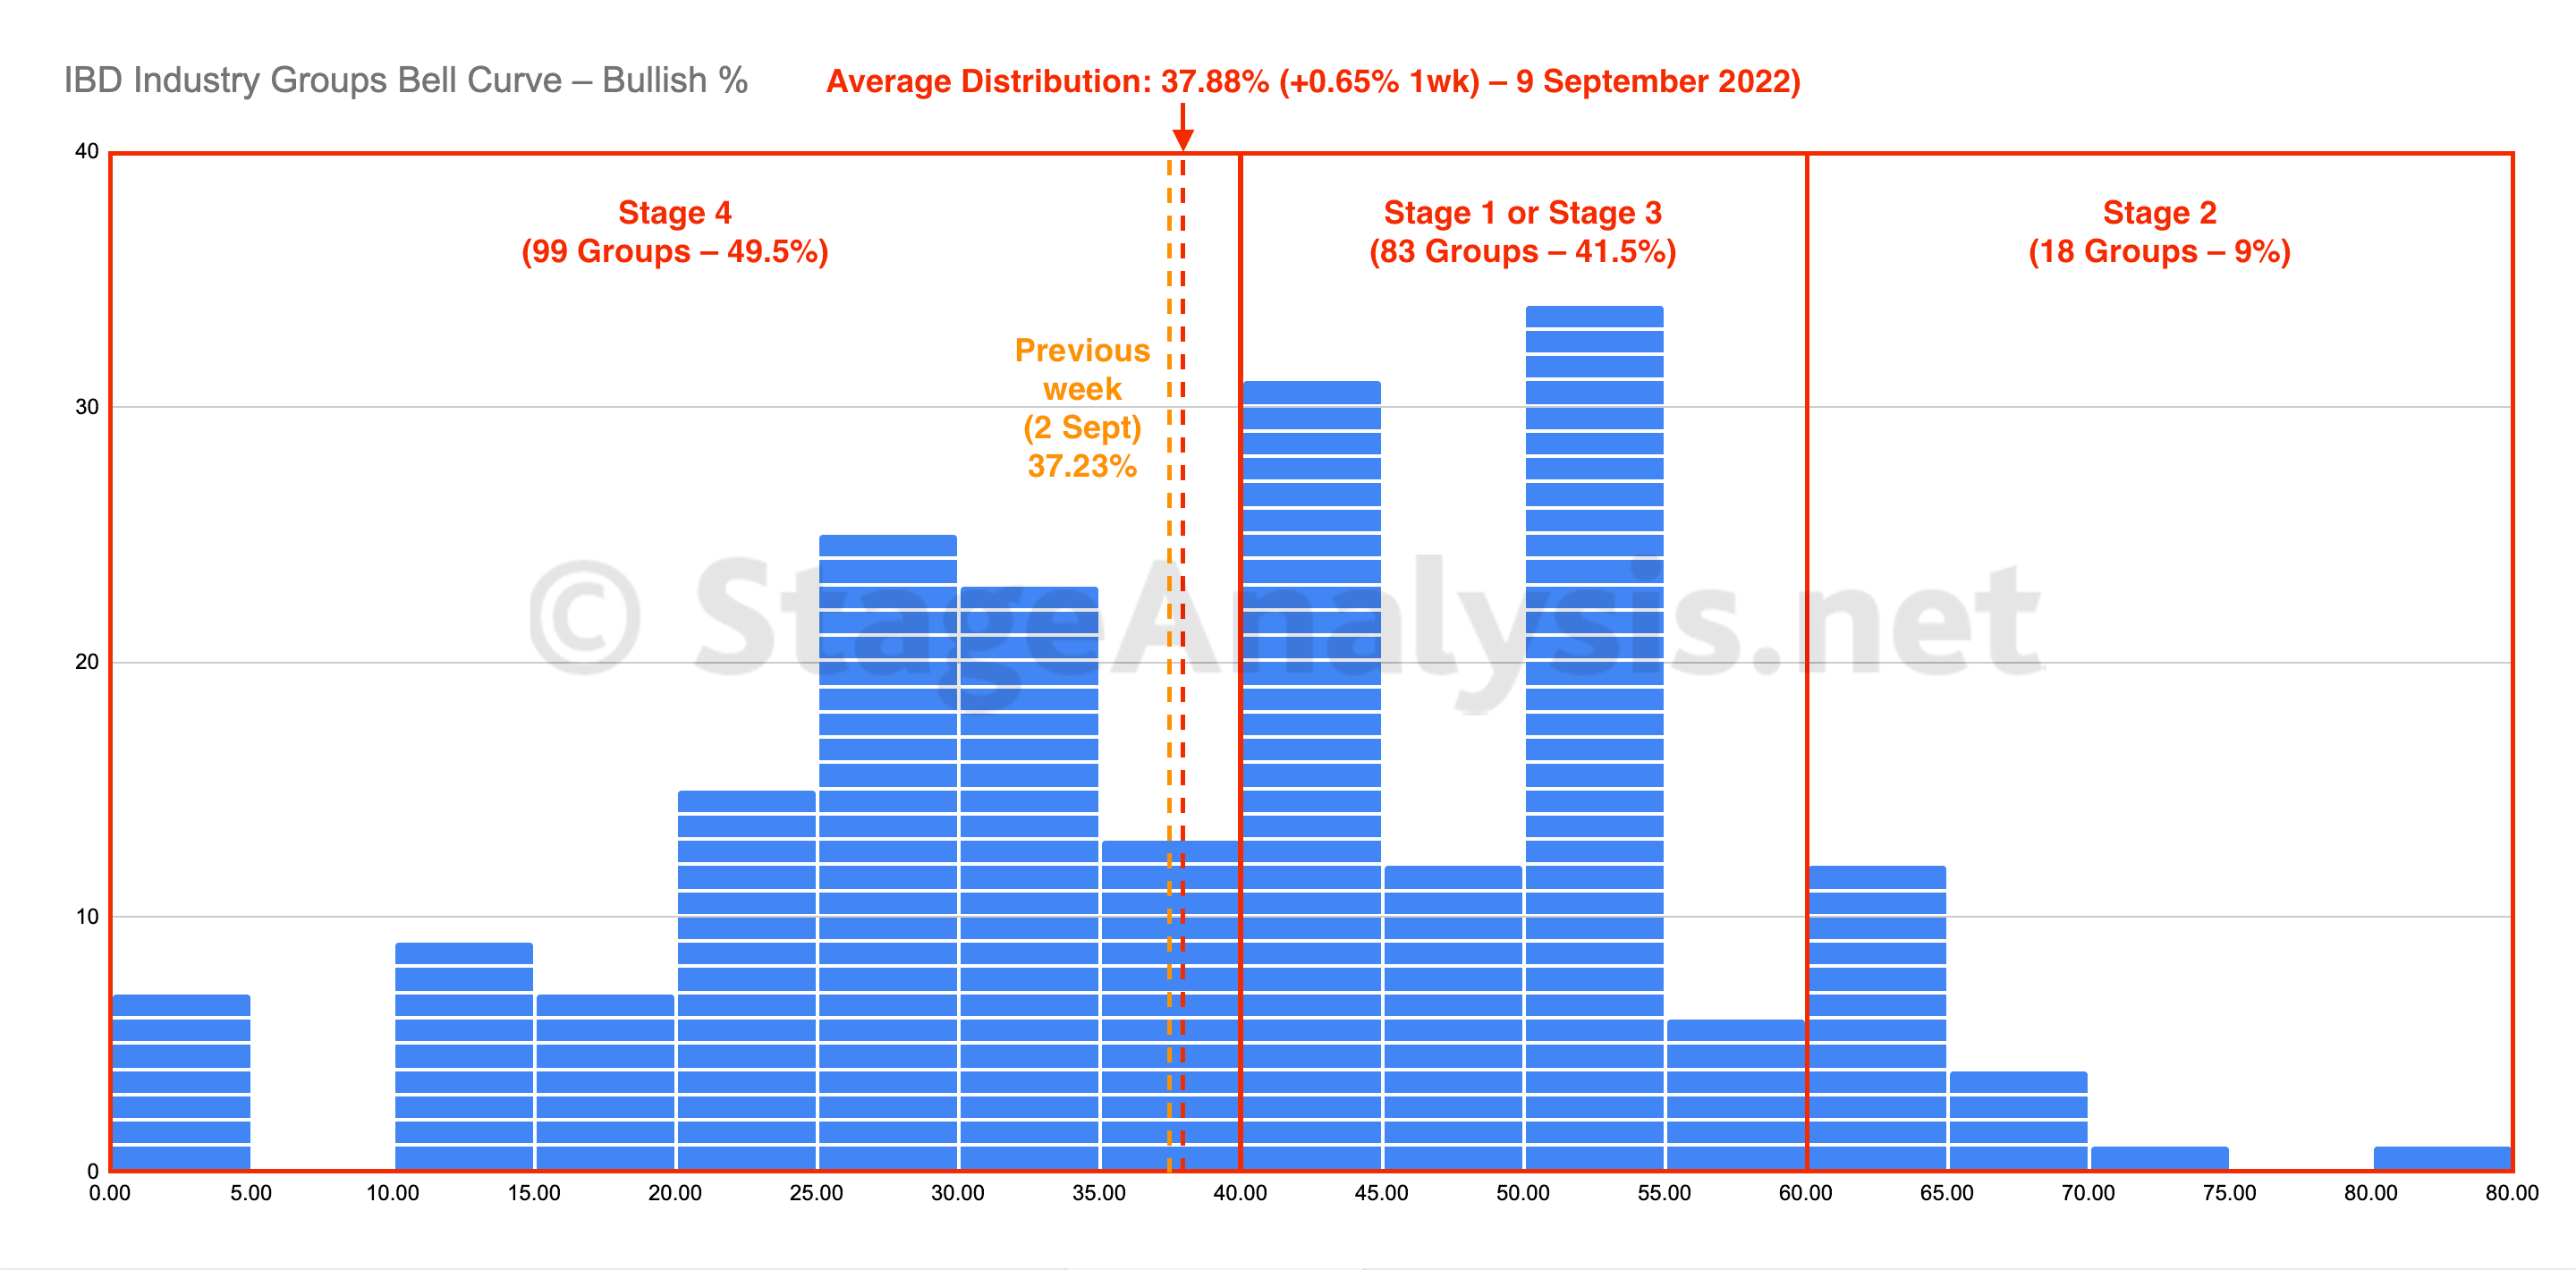
The IBD Industry Groups Bell Curve – Bullish Percent average distribution shifted slightly this week by +0.65% to finish the week at 37.88%. So it remains in the Stage 4 zone, but within a few percent of moving back into the Stage 1 zone if it continues to improve from here...
Read More
10 September, 2022
Market Breadth: Percentage of Stocks Above their 50 Day, 150 Day & 200 Day Moving Averages Combined
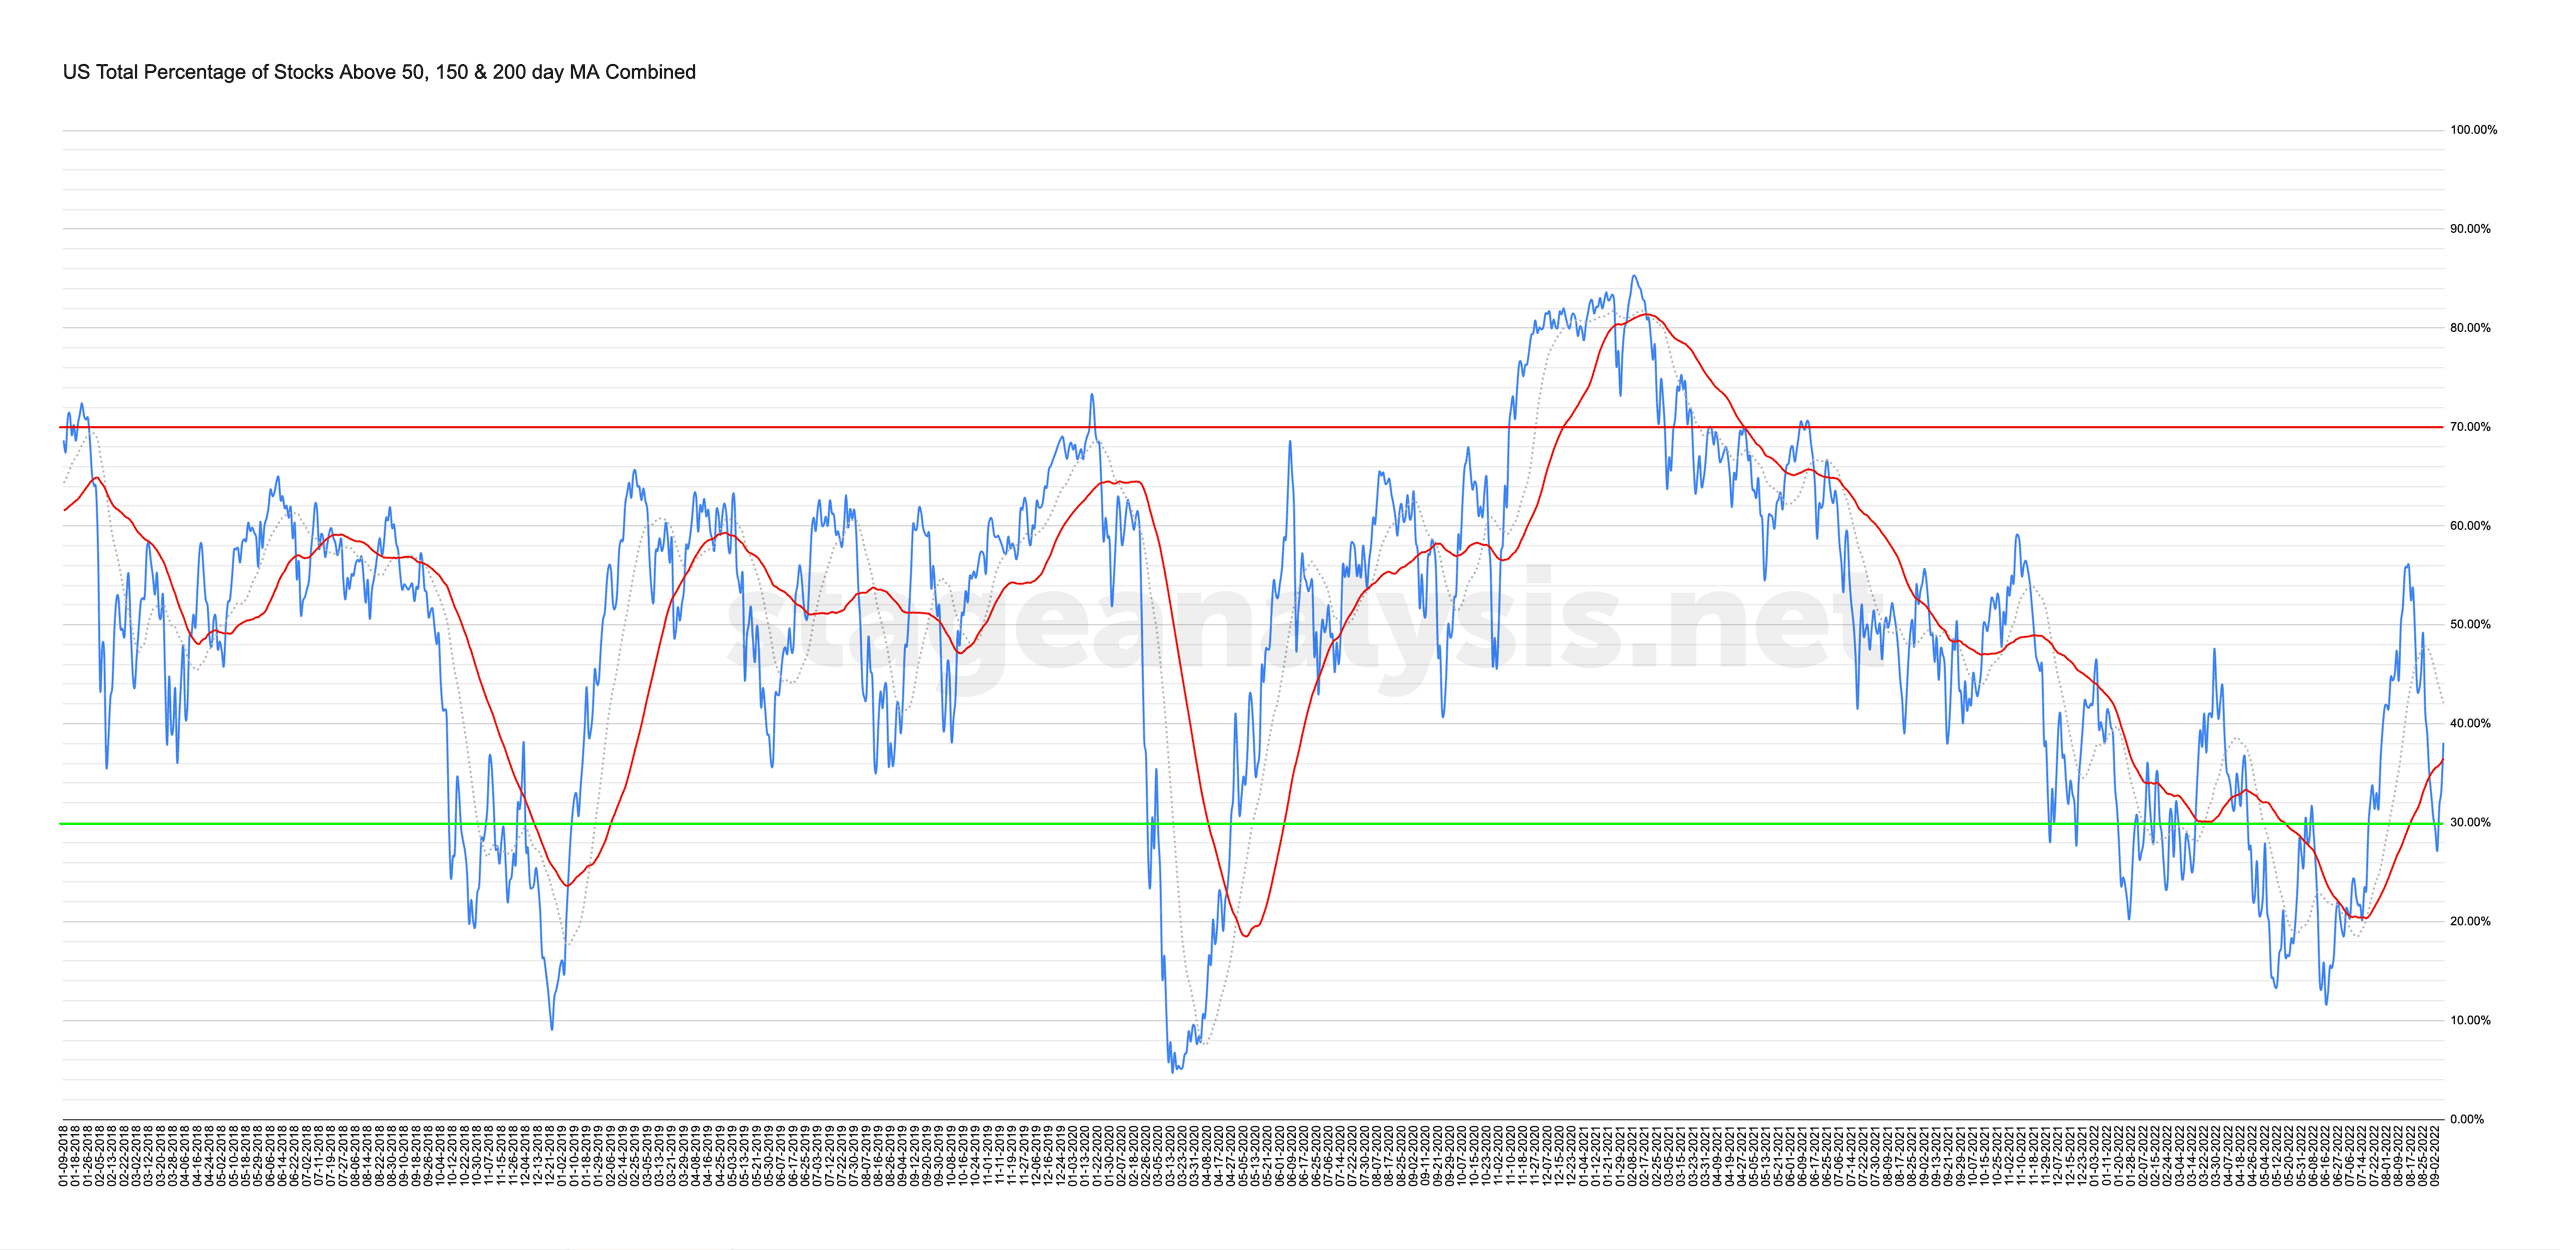
Custom Percentage of Stocks Above Their 50 Day, 150 Day & 200 Day Moving Averages Combined Market Breadth Charts for the Overall US Market, NYSE and Nasdaq for Market Timing and Strategy.
Read More

