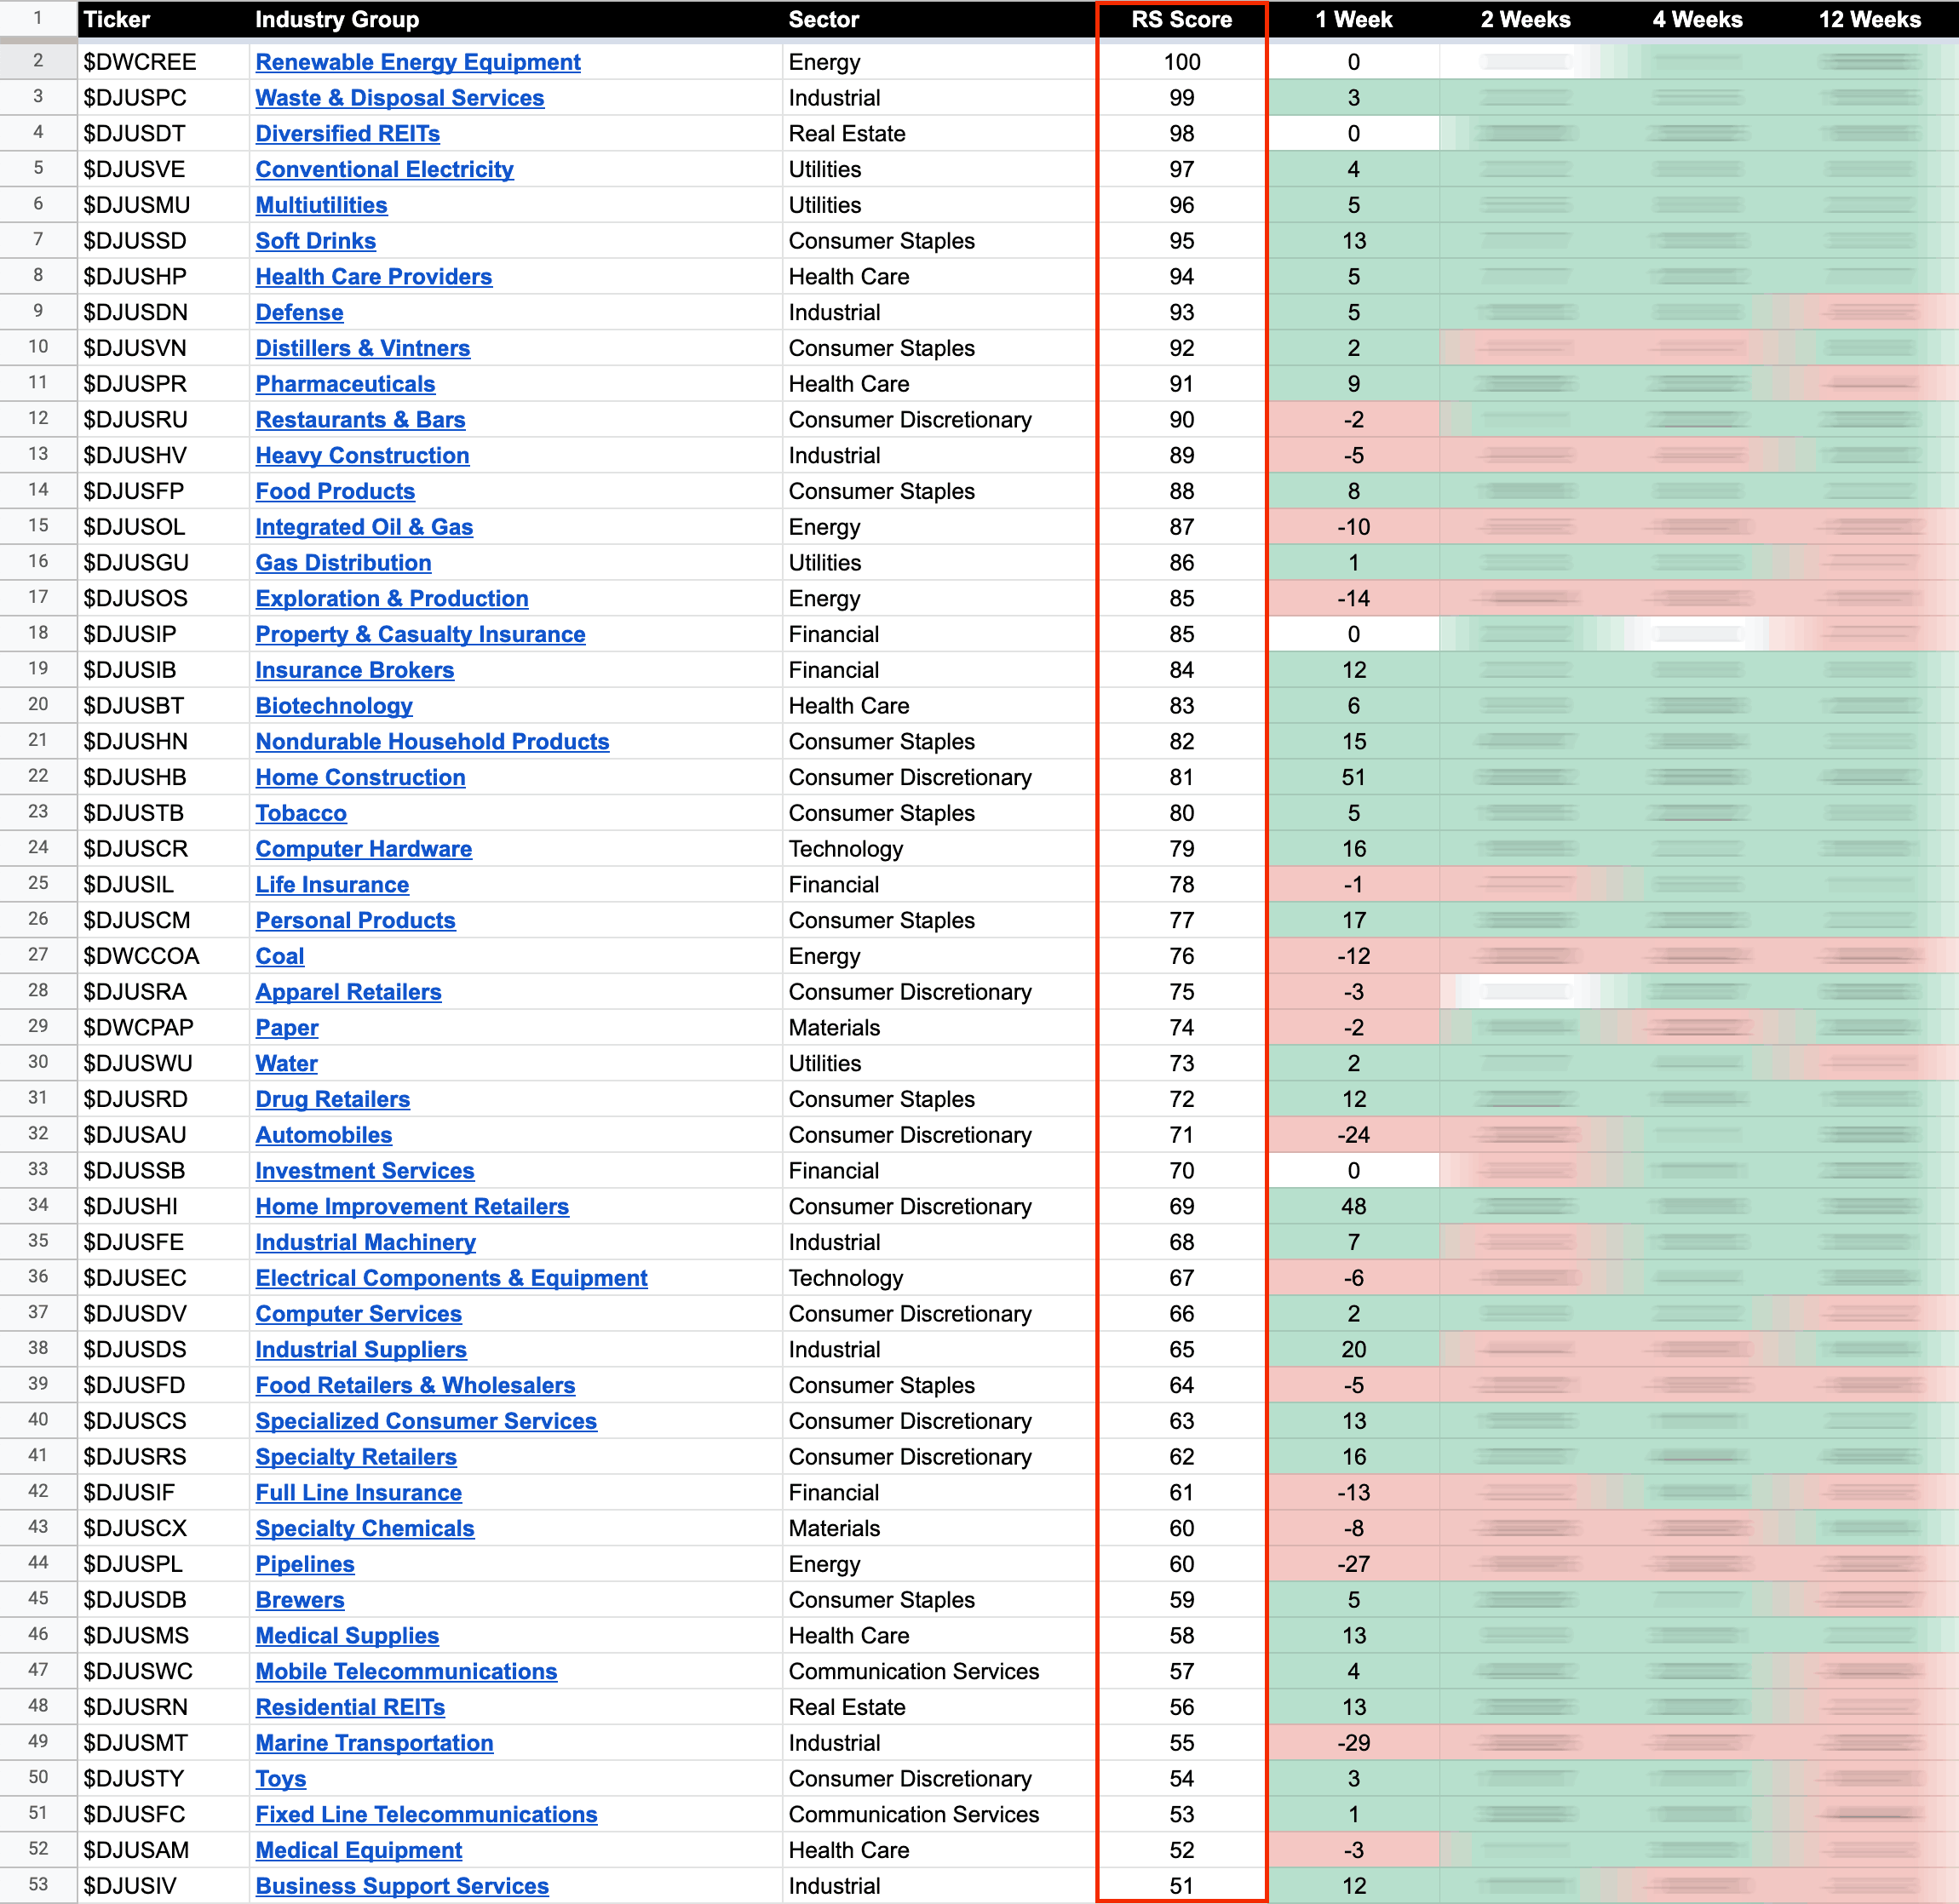
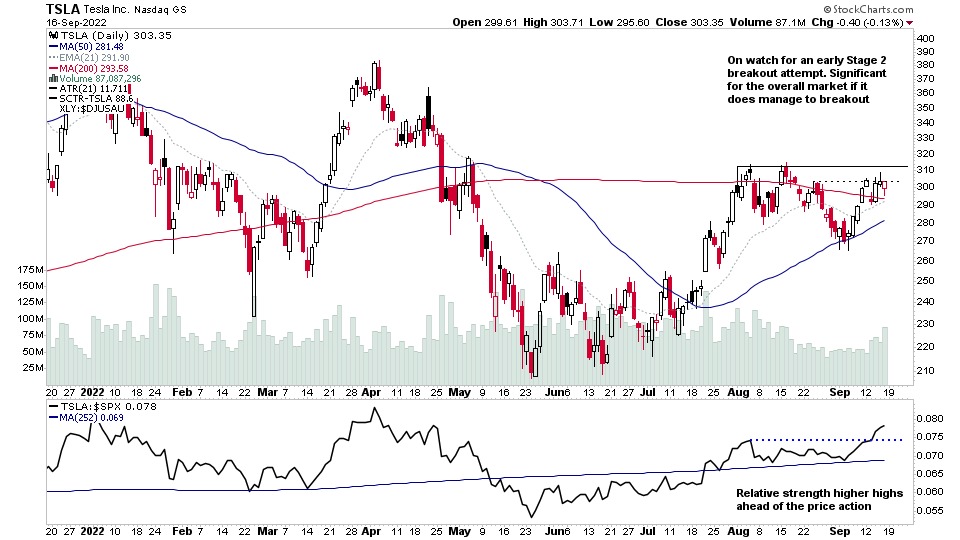
The purpose of the Relative Strength (RS) tables is to track the short, medium and long term RS changes of the individual groups to find the new leadership earlier than the crowd...
Read More
Blog
23 September, 2022
US Stocks Industry Groups Relative Strength Rankings
22 September, 2022
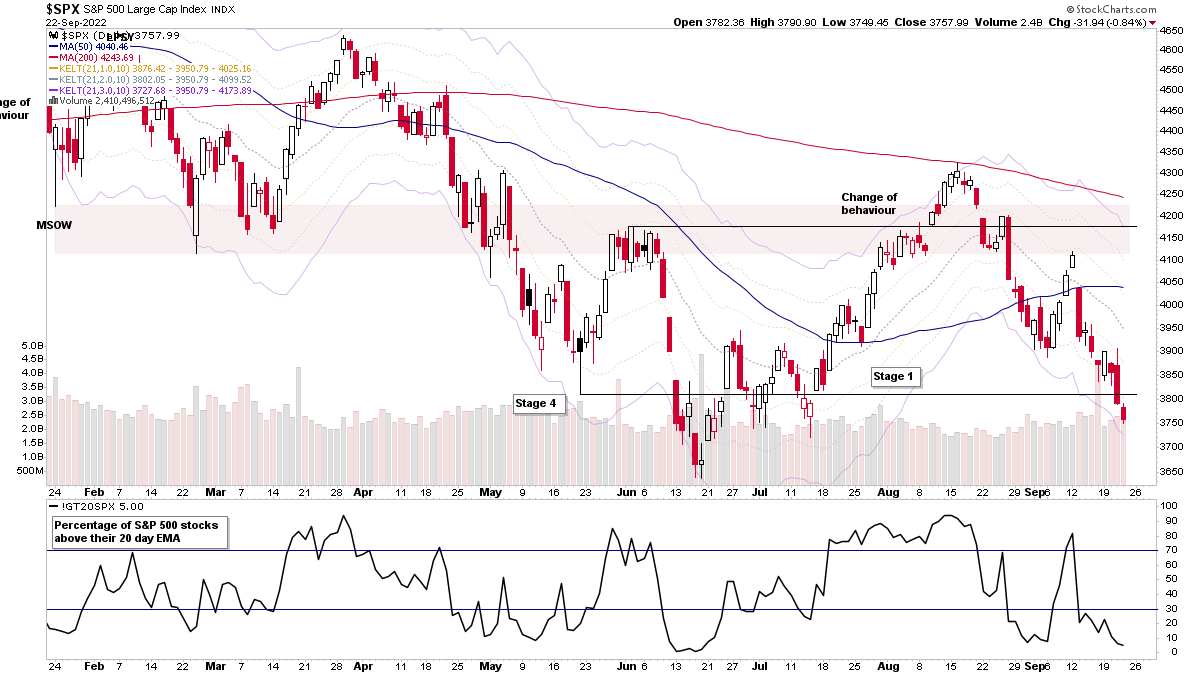
Stage Analysis Members Midweek Video – 22 September 2022 (42 mins)
Midweek review of the major US stock market indexes, sectors and leading stocks per group. Plus reviewing the stocks highlighted in the watchlist today.
Read More
20 September, 2022
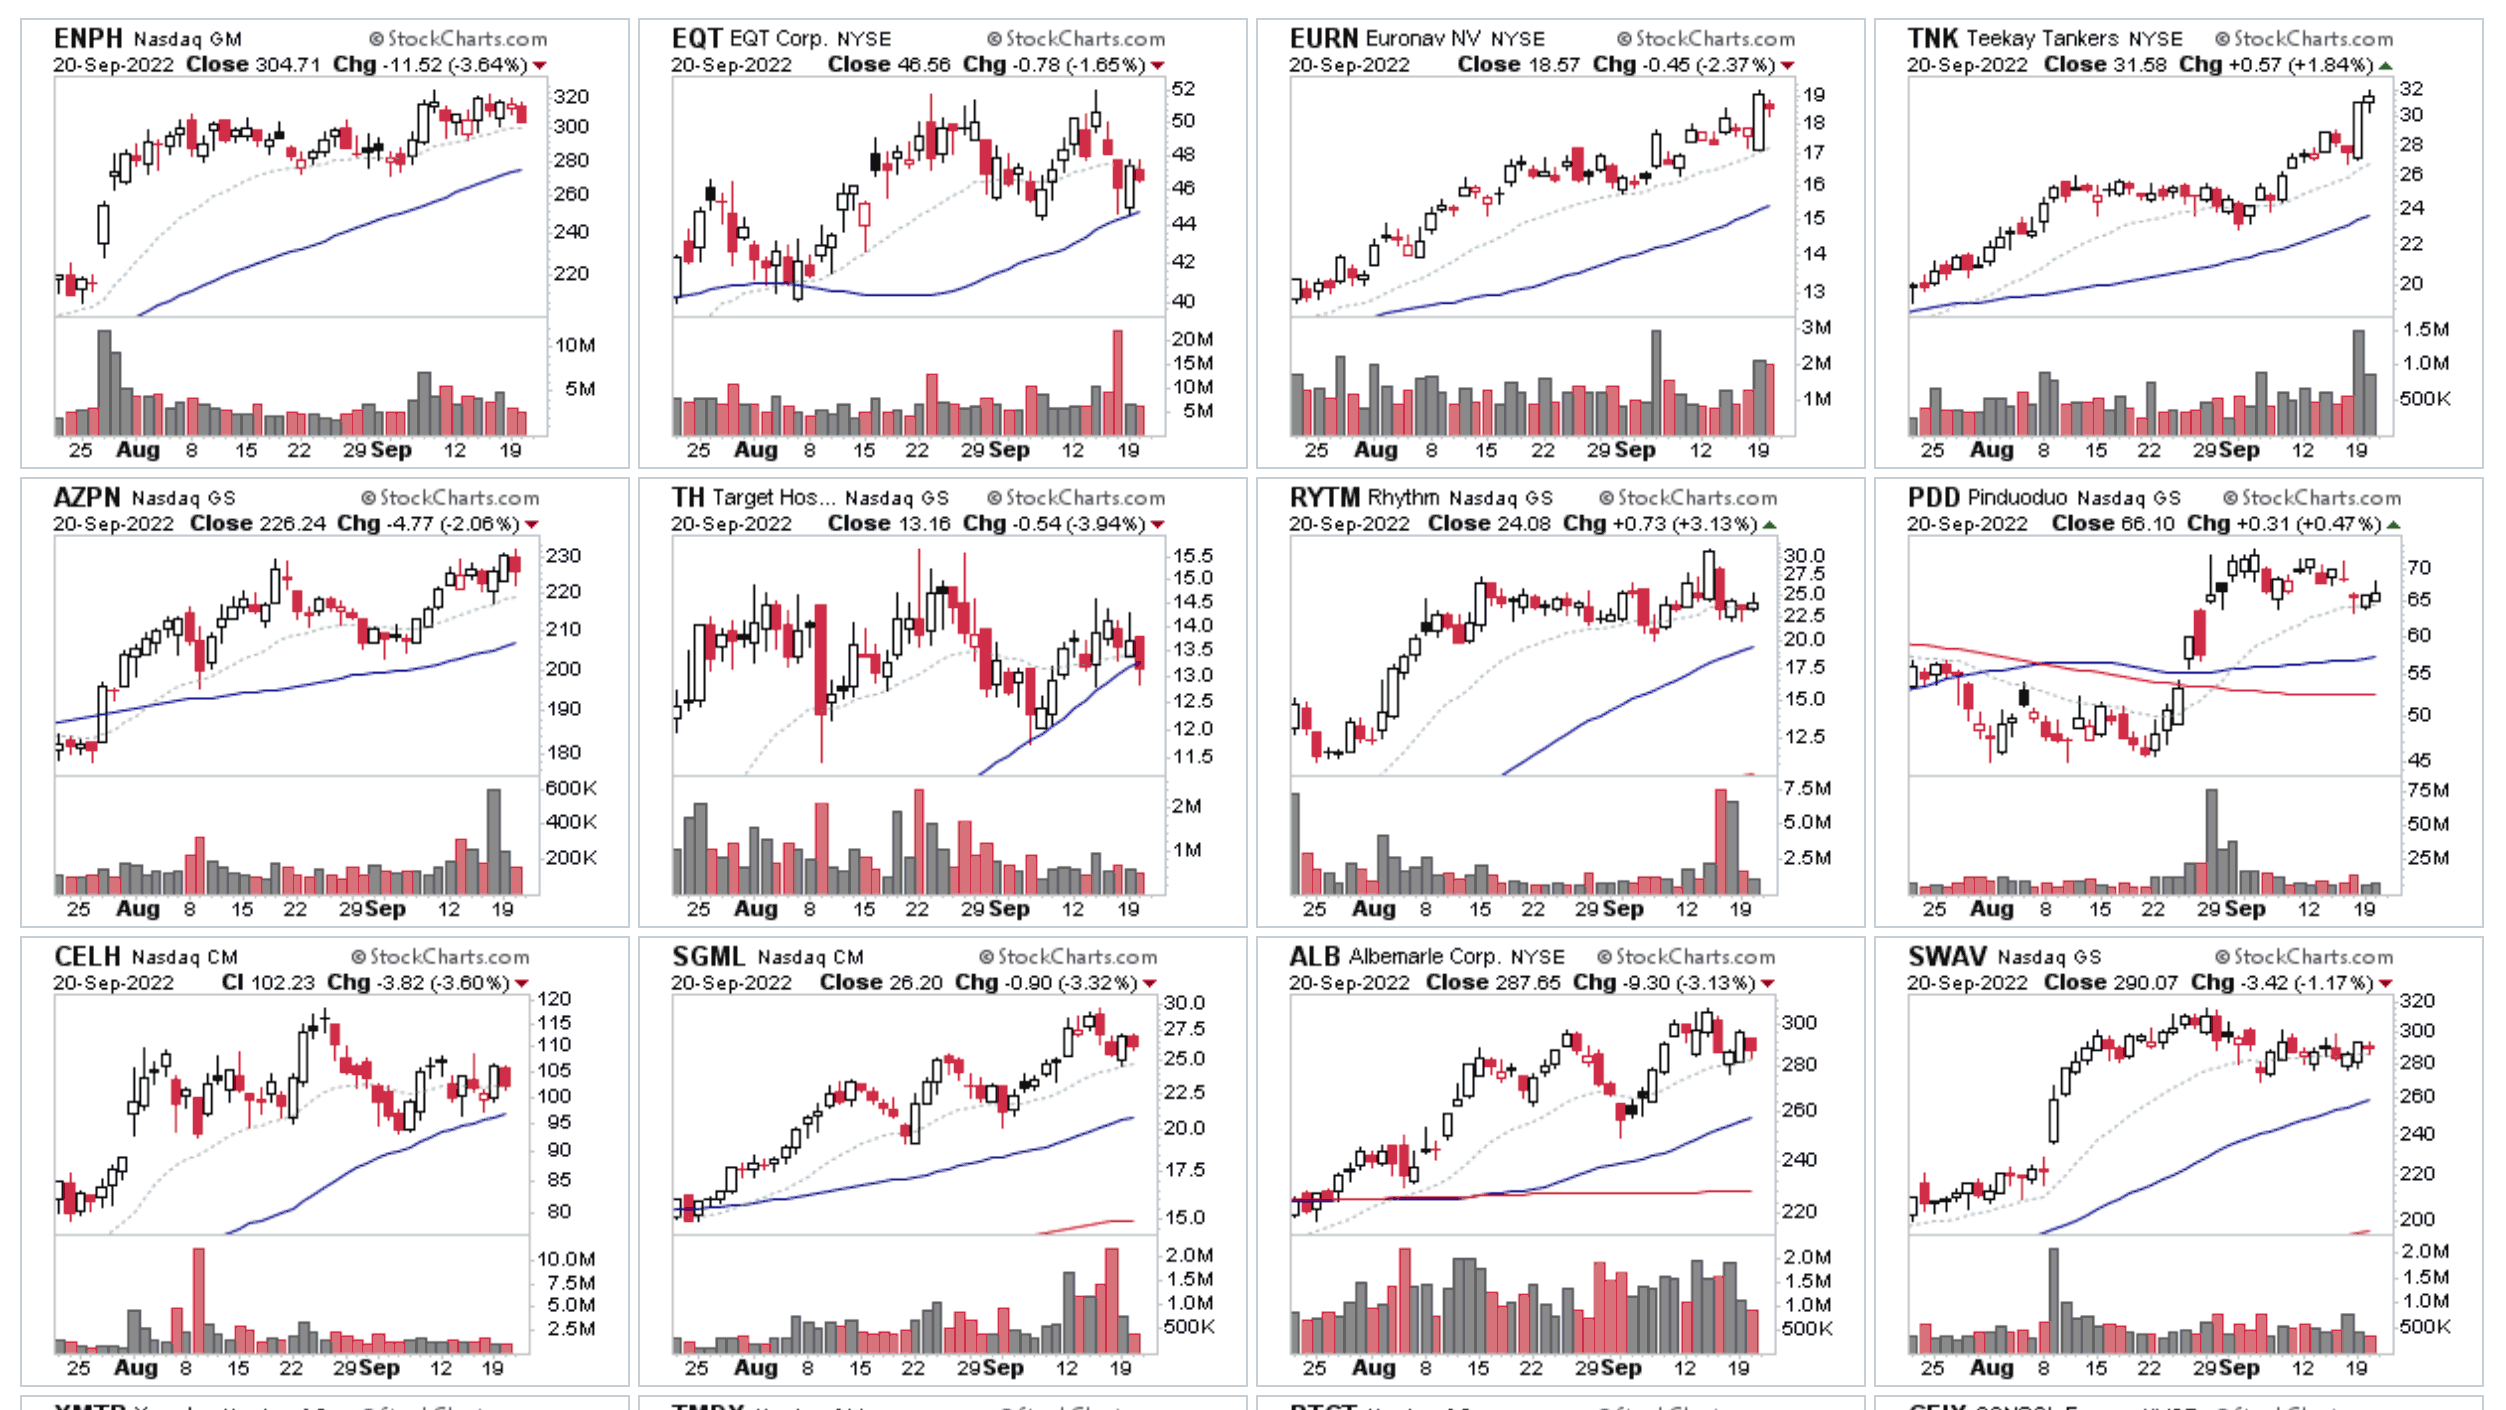
Watchlist Top 30 Relative Strength Leaders Per Group
With the Fed rate decision tomorrow, I thought it would interesting, as well as useful, to do a different type of post instead of the normal watchlist, that highlights 30 of the leading stocks using their Relative Strength (RS) score*, that have appeared in the watchlist since the beginning of August. But on a per group basis. So that there is one one result per group, to give us a broader view than just doing it on the RS score alone...
Read More
19 September, 2022
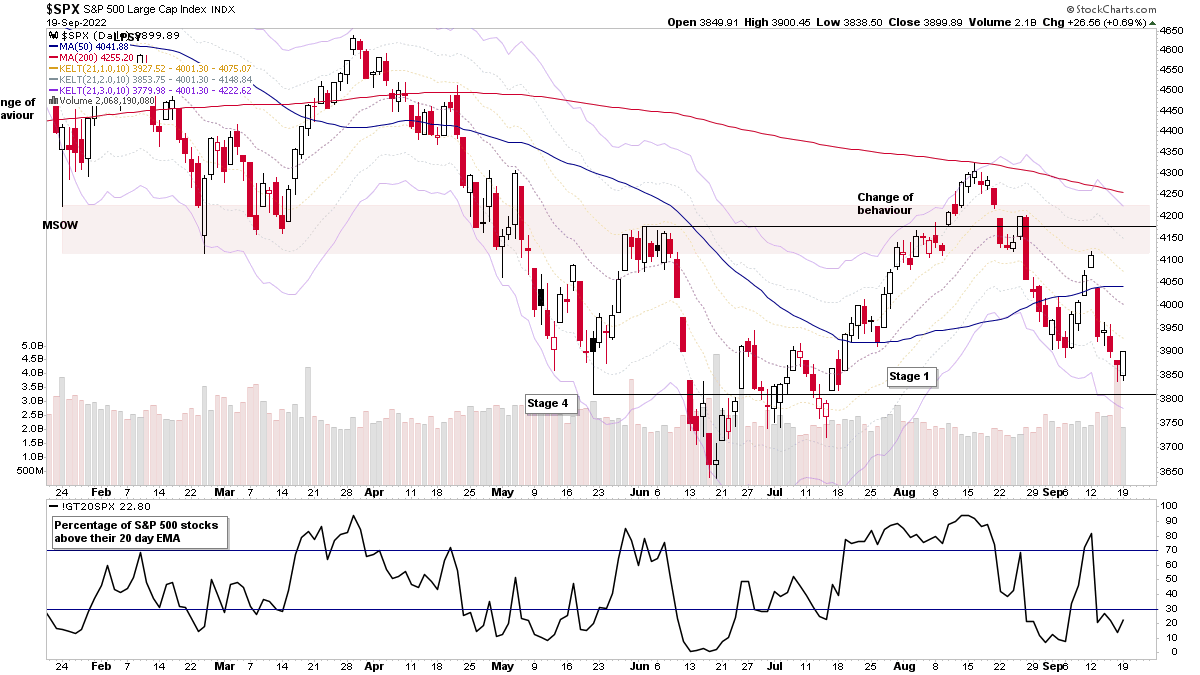
Stock Market Update and the US Stocks Watchlist – 19 September 2022
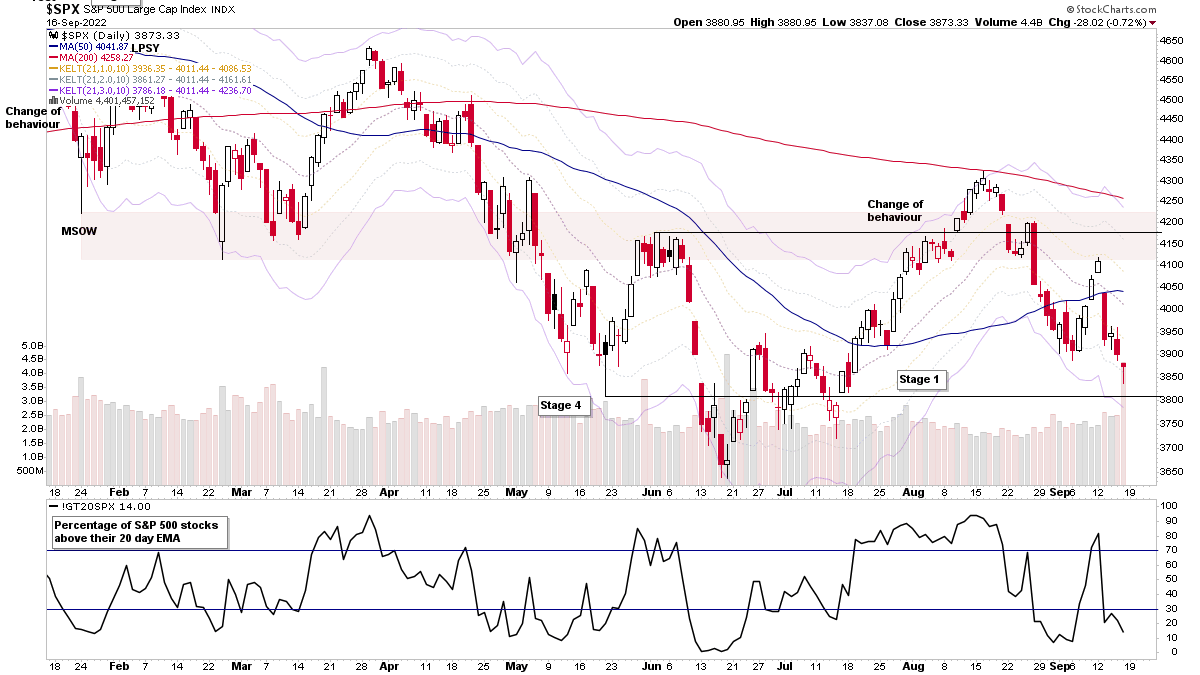
The S&P 500 attempted to begin to reverse from last weeks sharp decline, with an engulfing candle from Fridays undercut of the recent swing low within the broader range. So there is potential for a local spring, but only if it can follow through strongly...
Read More
19 September, 2022
Sector Breadth: Percentage of US Stocks Above Their 150 day (30 Week) Moving Averages
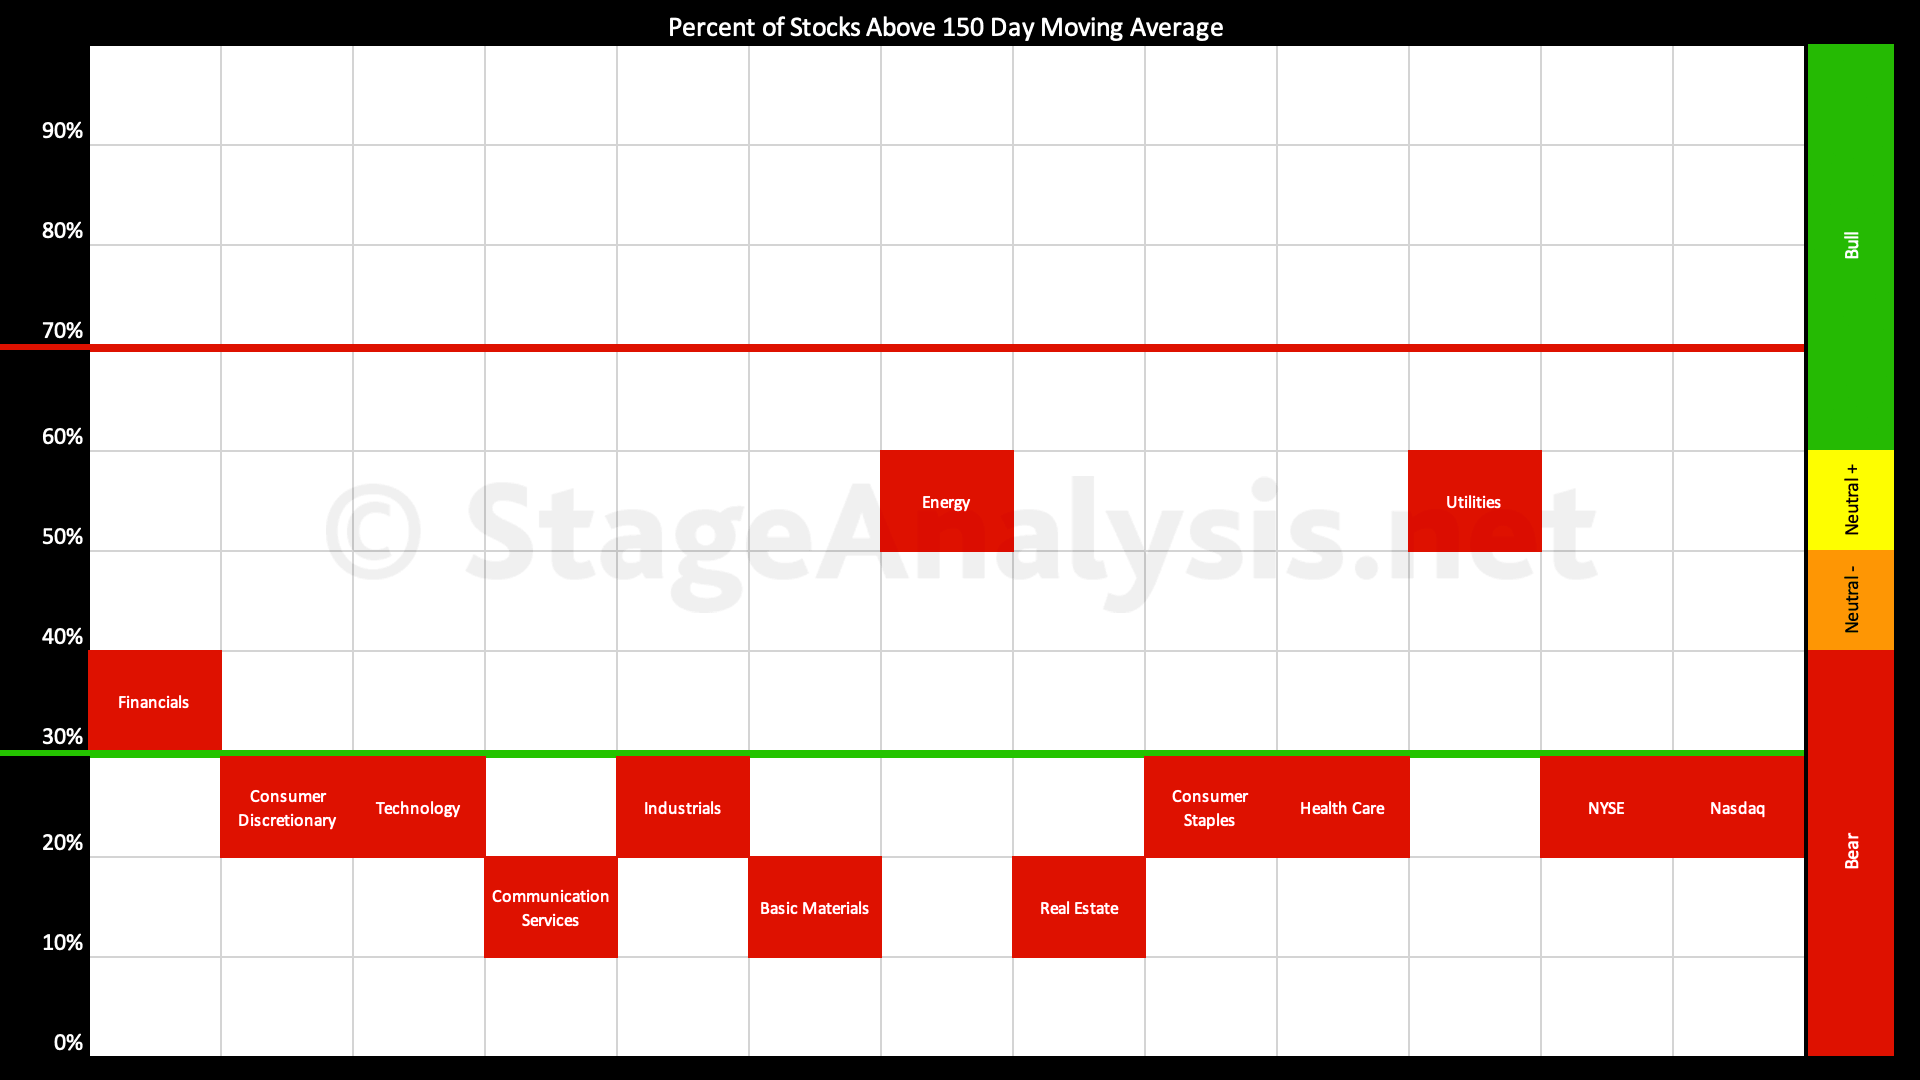
The Percentage of US Stocks Above Their 150 day Moving Averages in the 11 major sectors declined by -9.98% over the last week to close the week at 29.17%, which is back in the lower range in the Stage 4 zone. Only the Utilities and Energy sectors are in the 40% to 60% range in the Stage 1 / Stage 3 zone. However, no sectors are currently above 60%, and so there are no sectors currently in the Stage 2 zone...
Read More
19 September, 2022
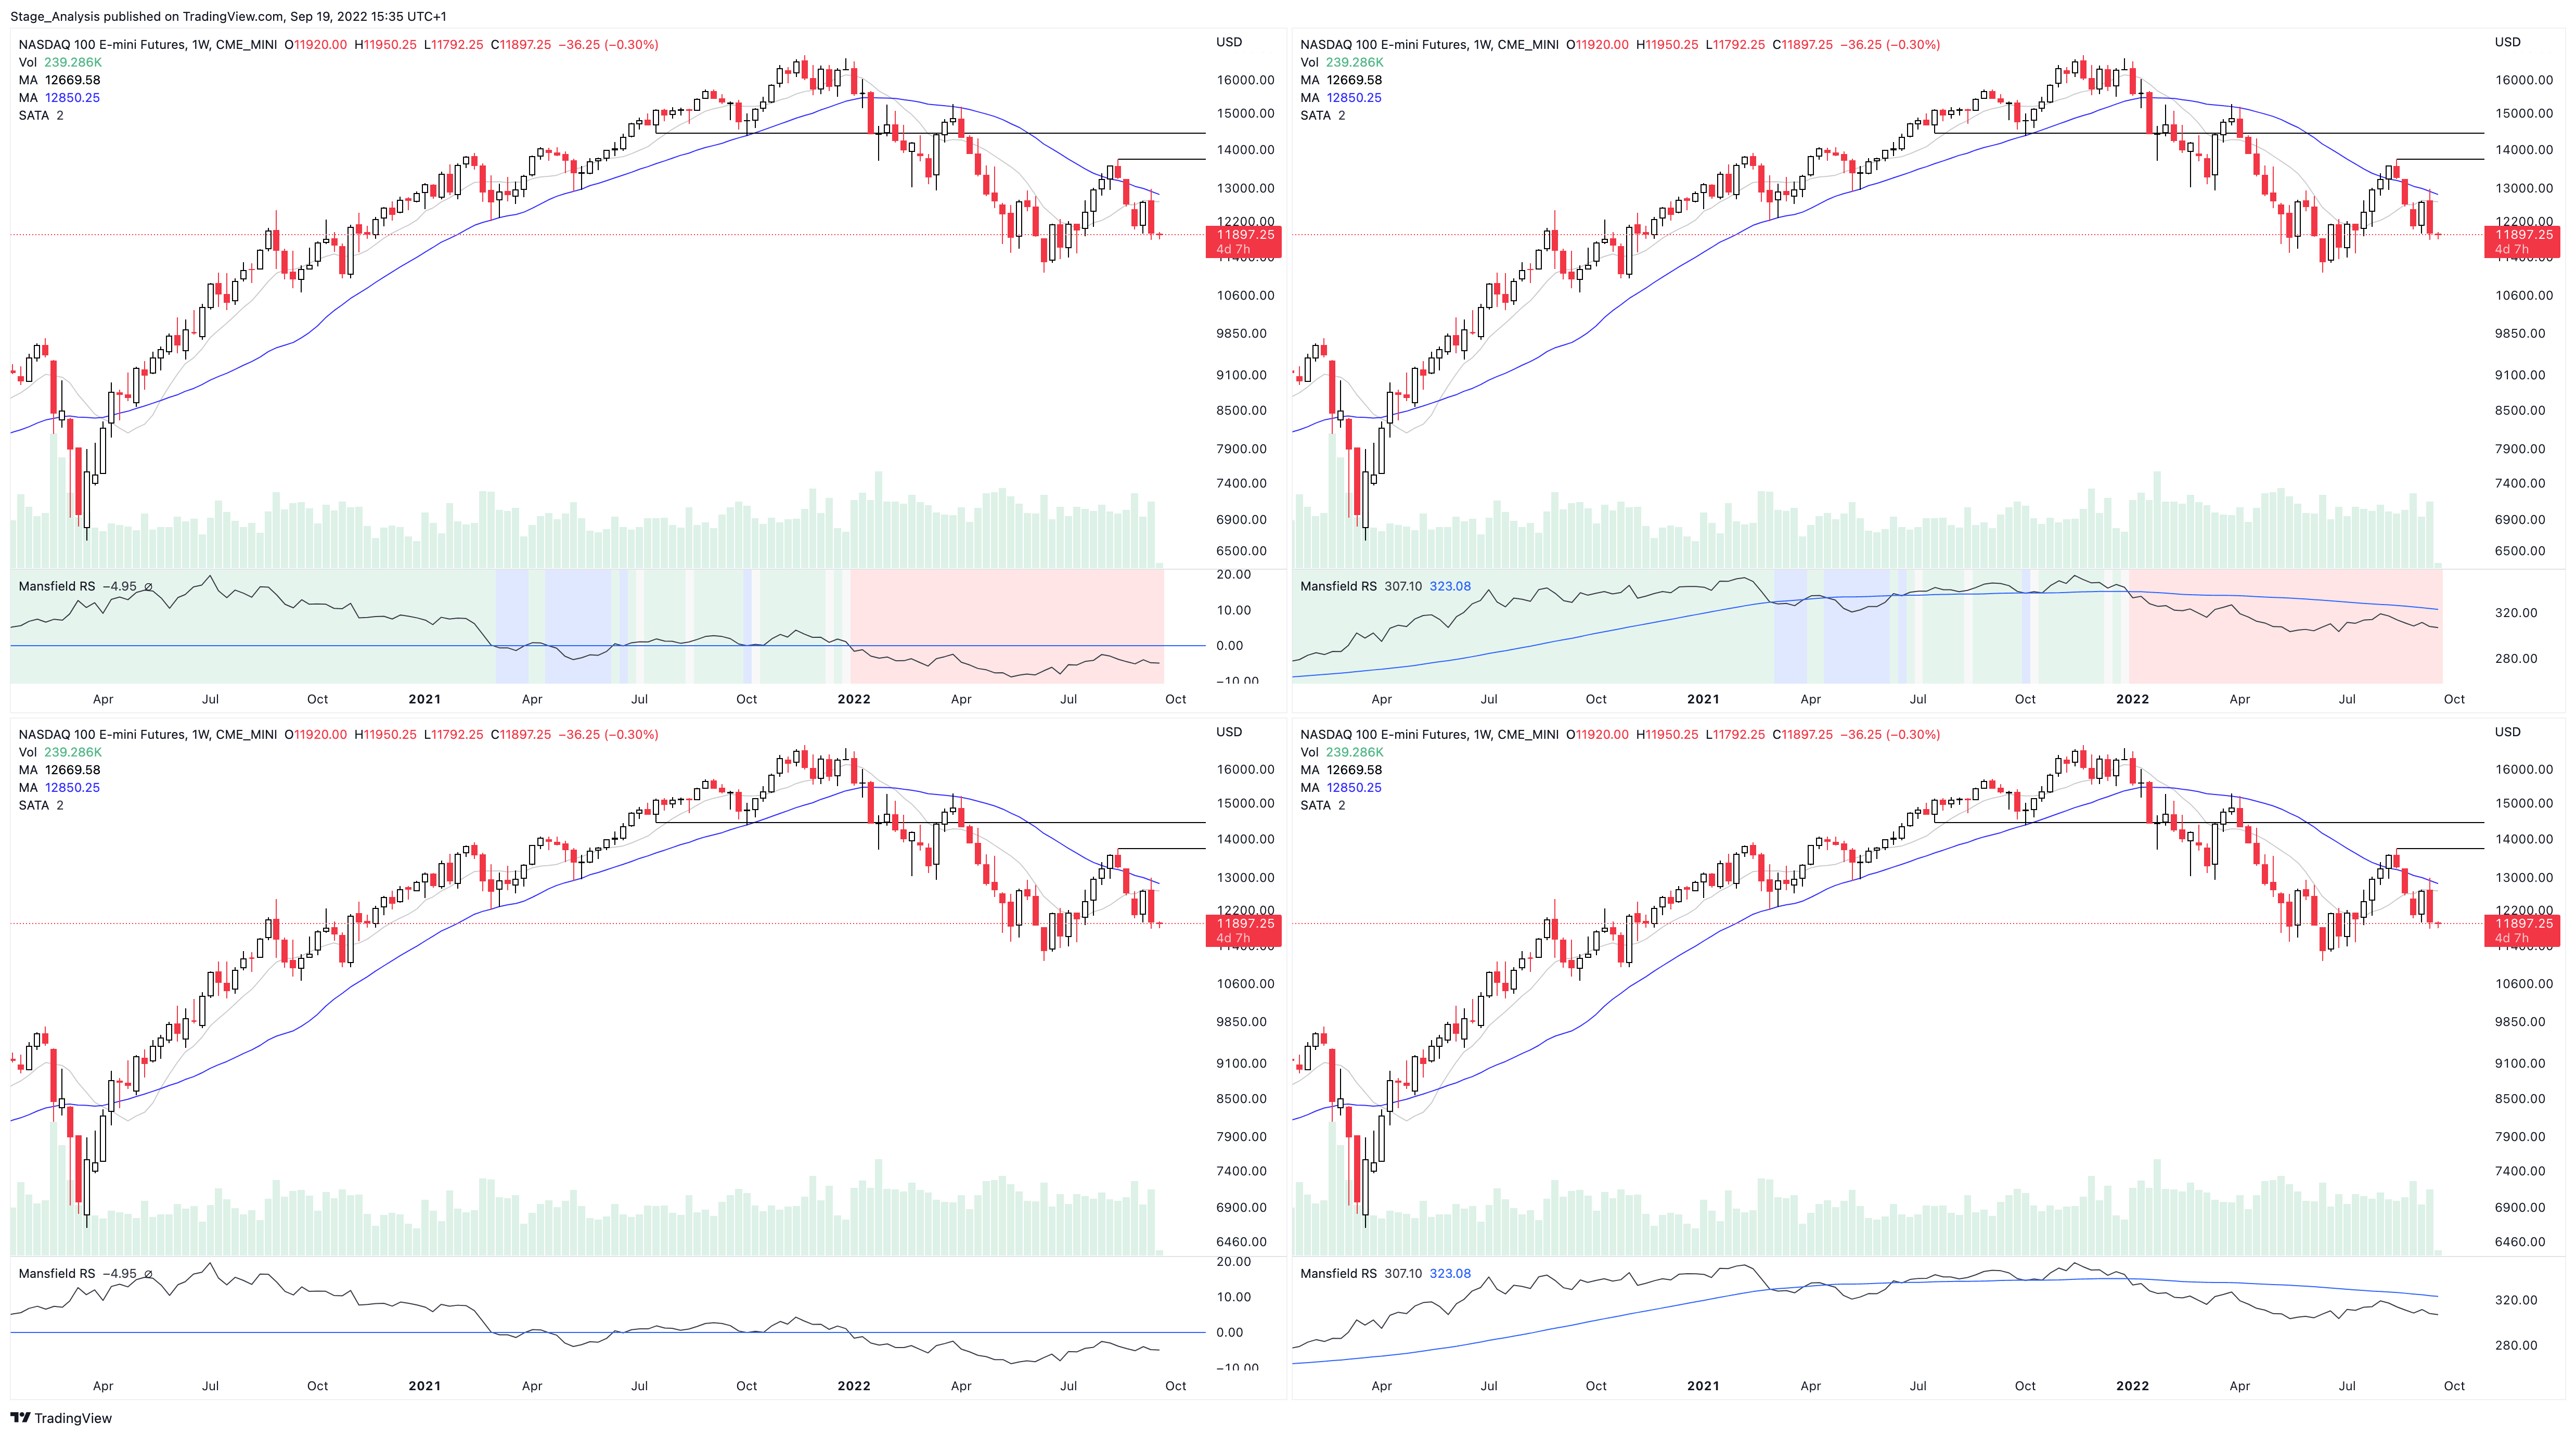
How to Setup the Mansfield Relative Strength Indicator in Tradingview
Relative Strength (RS) comparison to the major stock market indexes with sectors, industry groups and also direct RS comparisons with other stocks, is a core part of Stan Weinstein's Stage Analysis method, and was described in detail in the classic book Stan Weinstein's Secrets For Profiting in Bull and Bear Markets.
Read More
18 September, 2022
Stage Analysis Members Weekend Video – 18 September 2022 (1hr 14mins)
The regular members weekend video discussing the market, industry groups, market breadth and individual stocks from the watchlist...
Read More
18 September, 2022
IBD Industry Groups Bell Curve – Bullish Percent
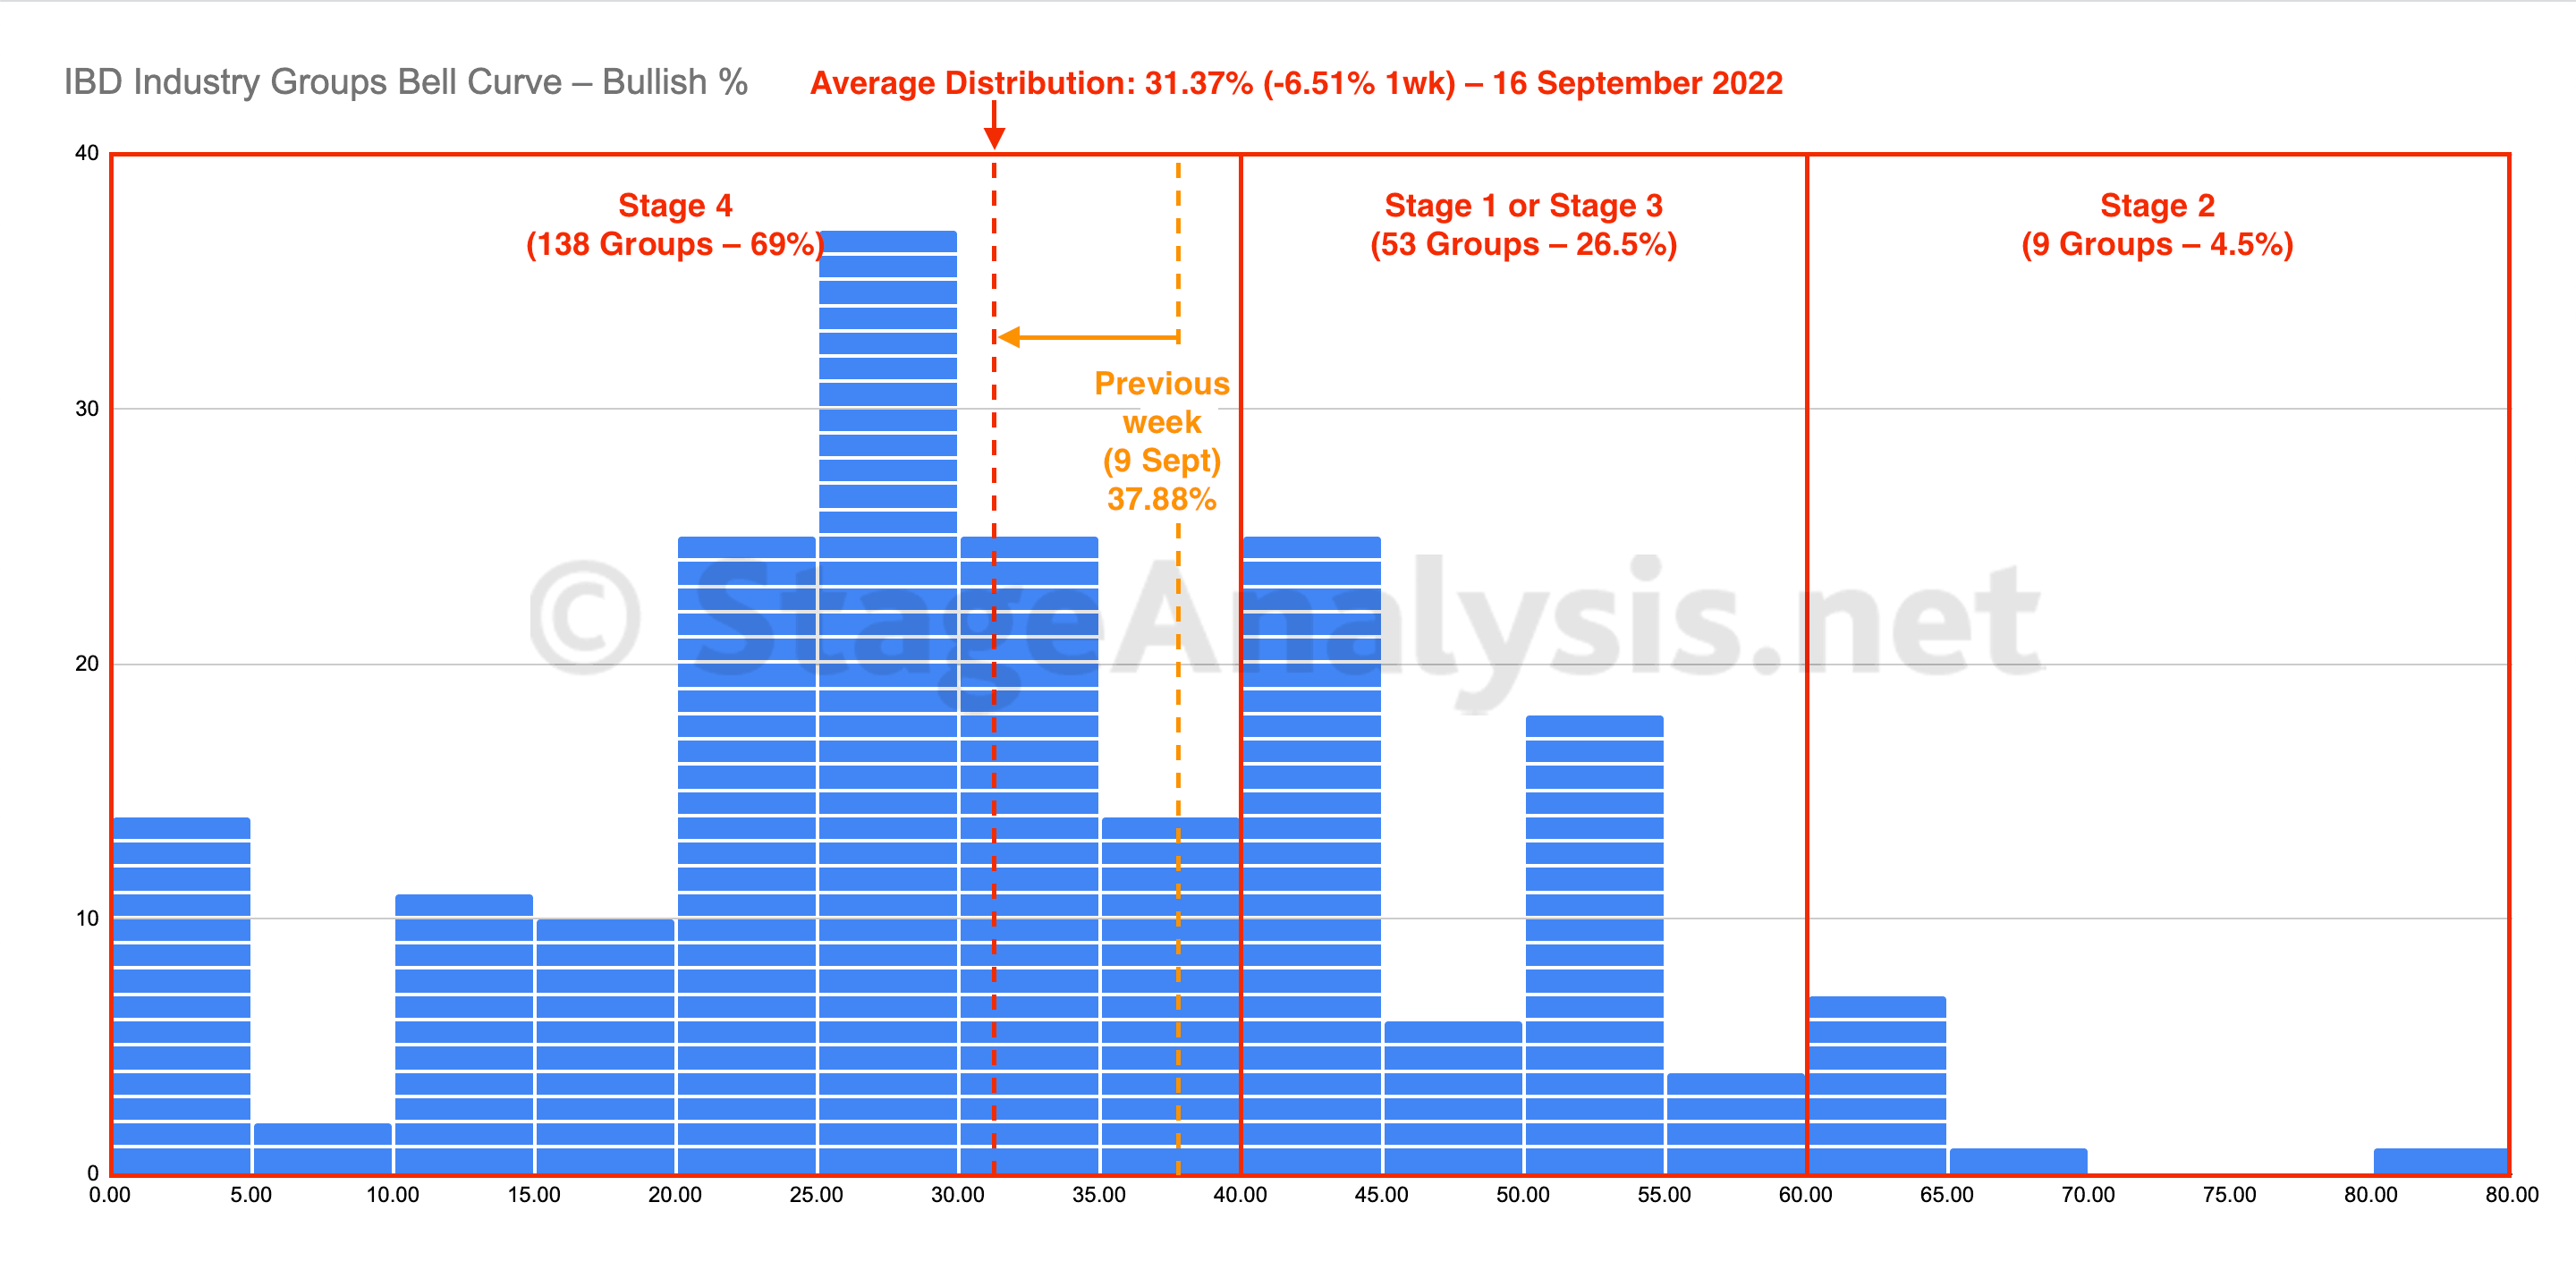
The IBD Industry Groups Bell Curve – Bullish Percent average distribution continued to decline this week, and finished the week at 31.37%, which is decline of -6.51%. So it has fallen deeper into the Stage 4 zone once more, with the majority of groups (69%) in the Stage 4 zone, and only 4.5% of the groups in the Stage 2 zone.
Read More
17 September, 2022
US Stocks Watchlist – 18 September 2022
There were 33 stocks highlighted from the US stocks watchlist scans today, which will be discussed in more detail in the weekend video...
Read More
17 September, 2022
Market Breadth: Percentage of Stocks Above their 50 Day, 150 Day & 200 Day Moving Averages Combined
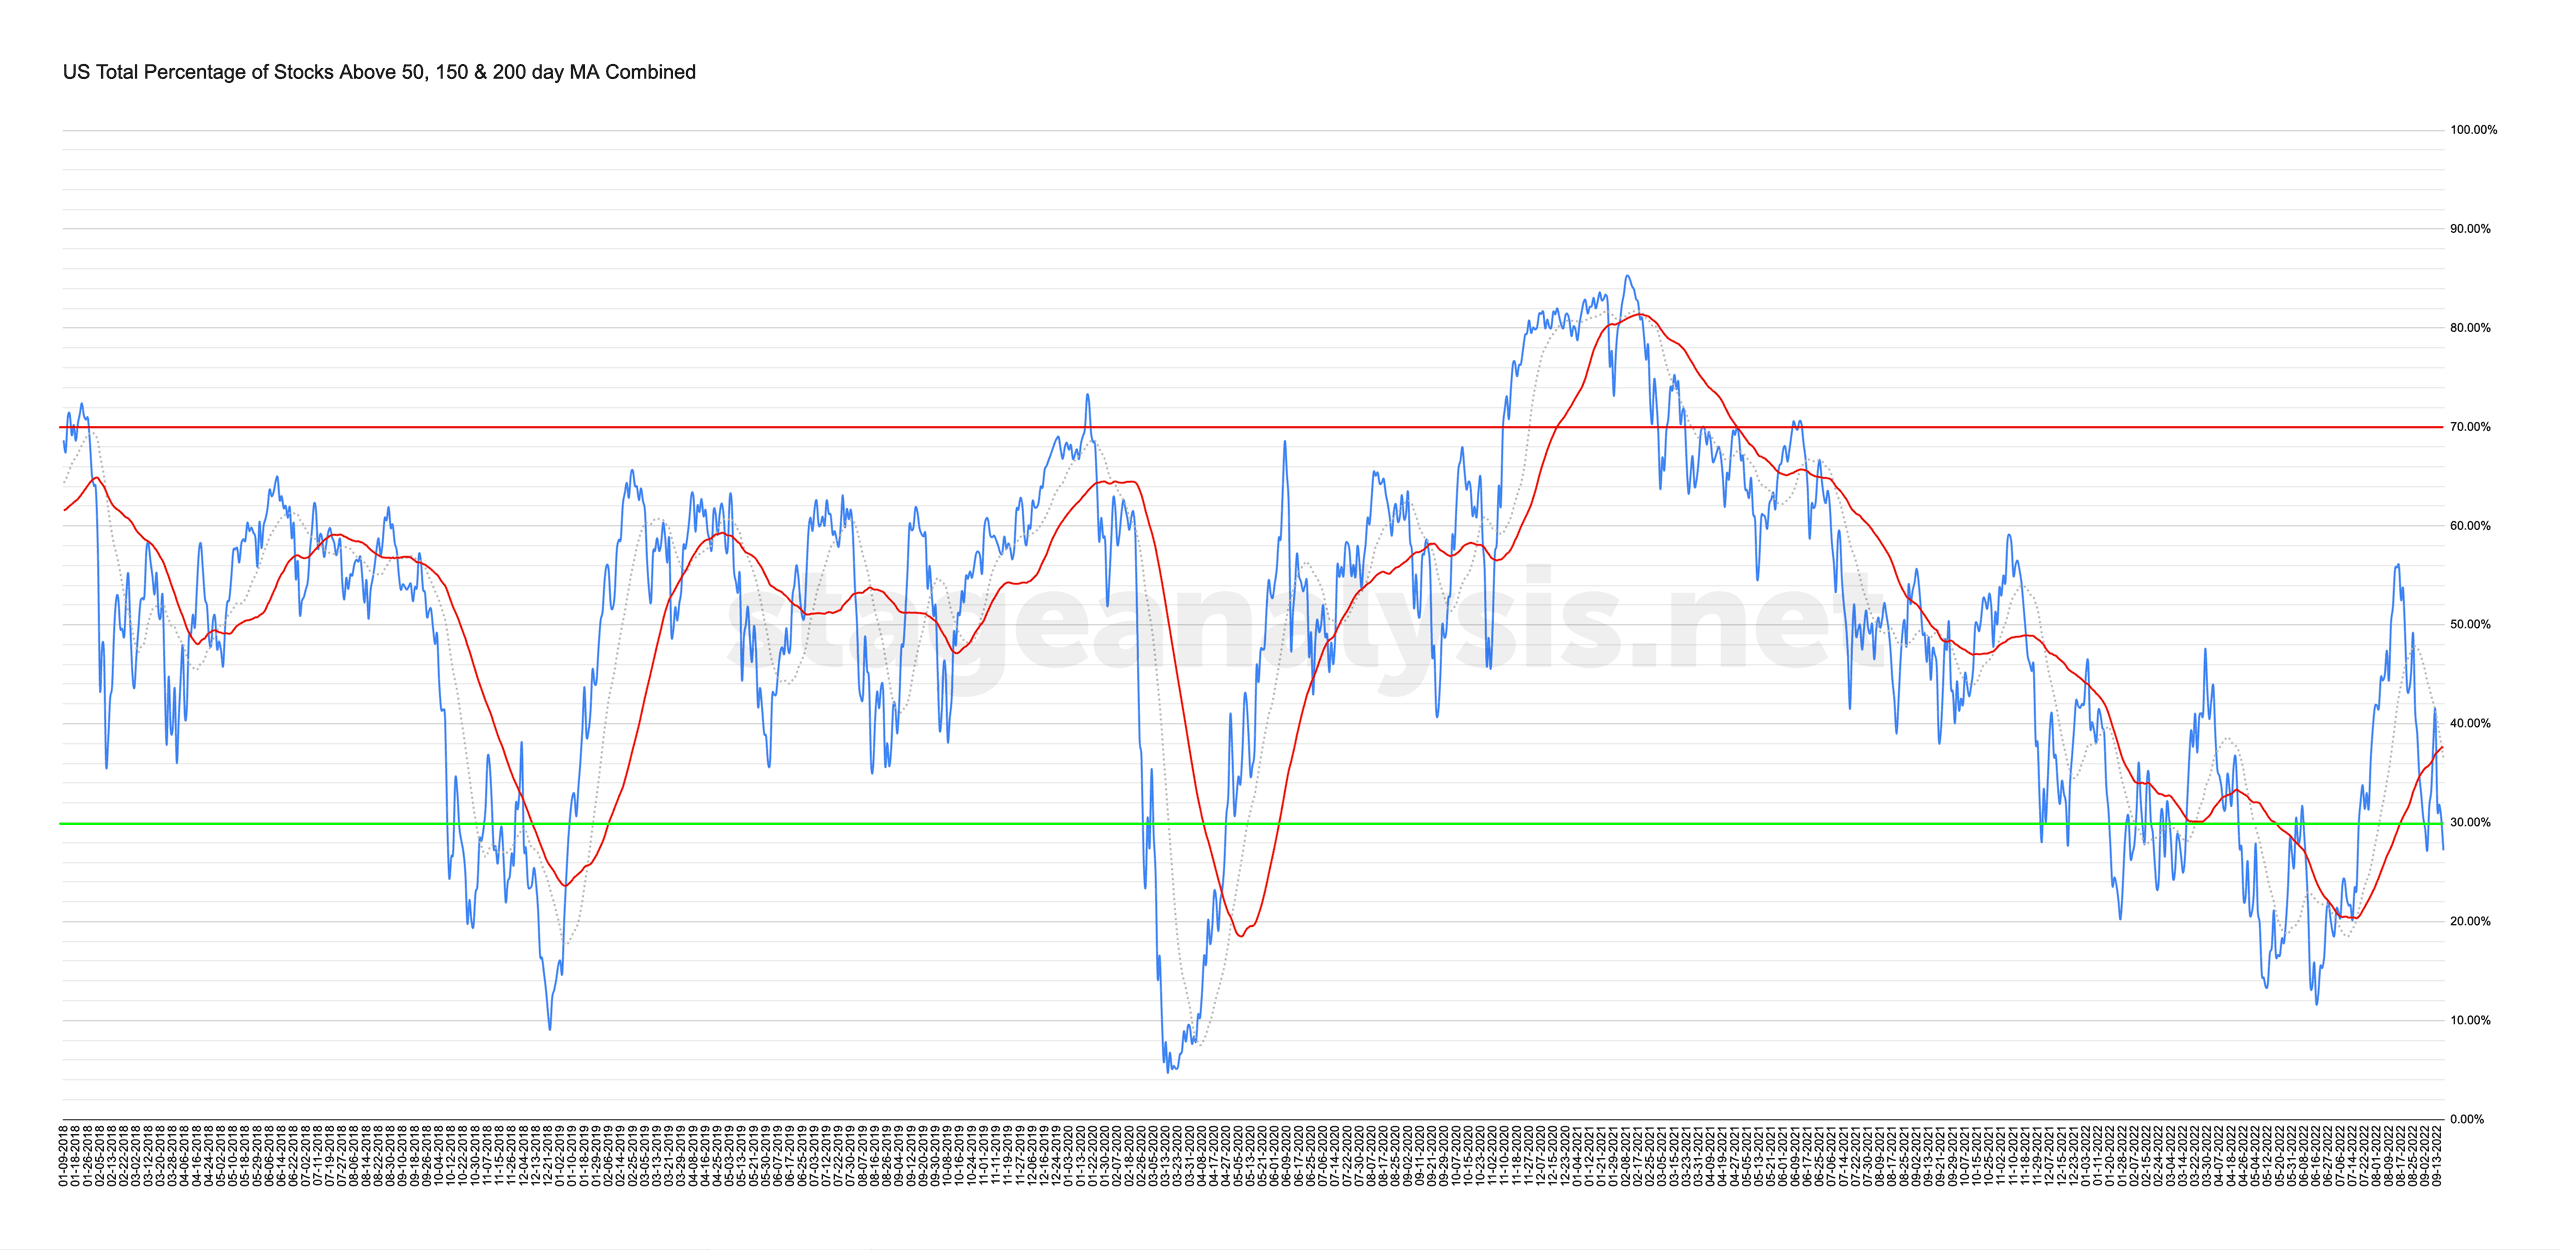
Custom Percentage of Stocks Above Their 50 Day, 150 Day & 200 Day Moving Averages Combined Market Breadth Charts for the Overall US Market, NYSE and Nasdaq for Market Timing and Strategy.
Read More

