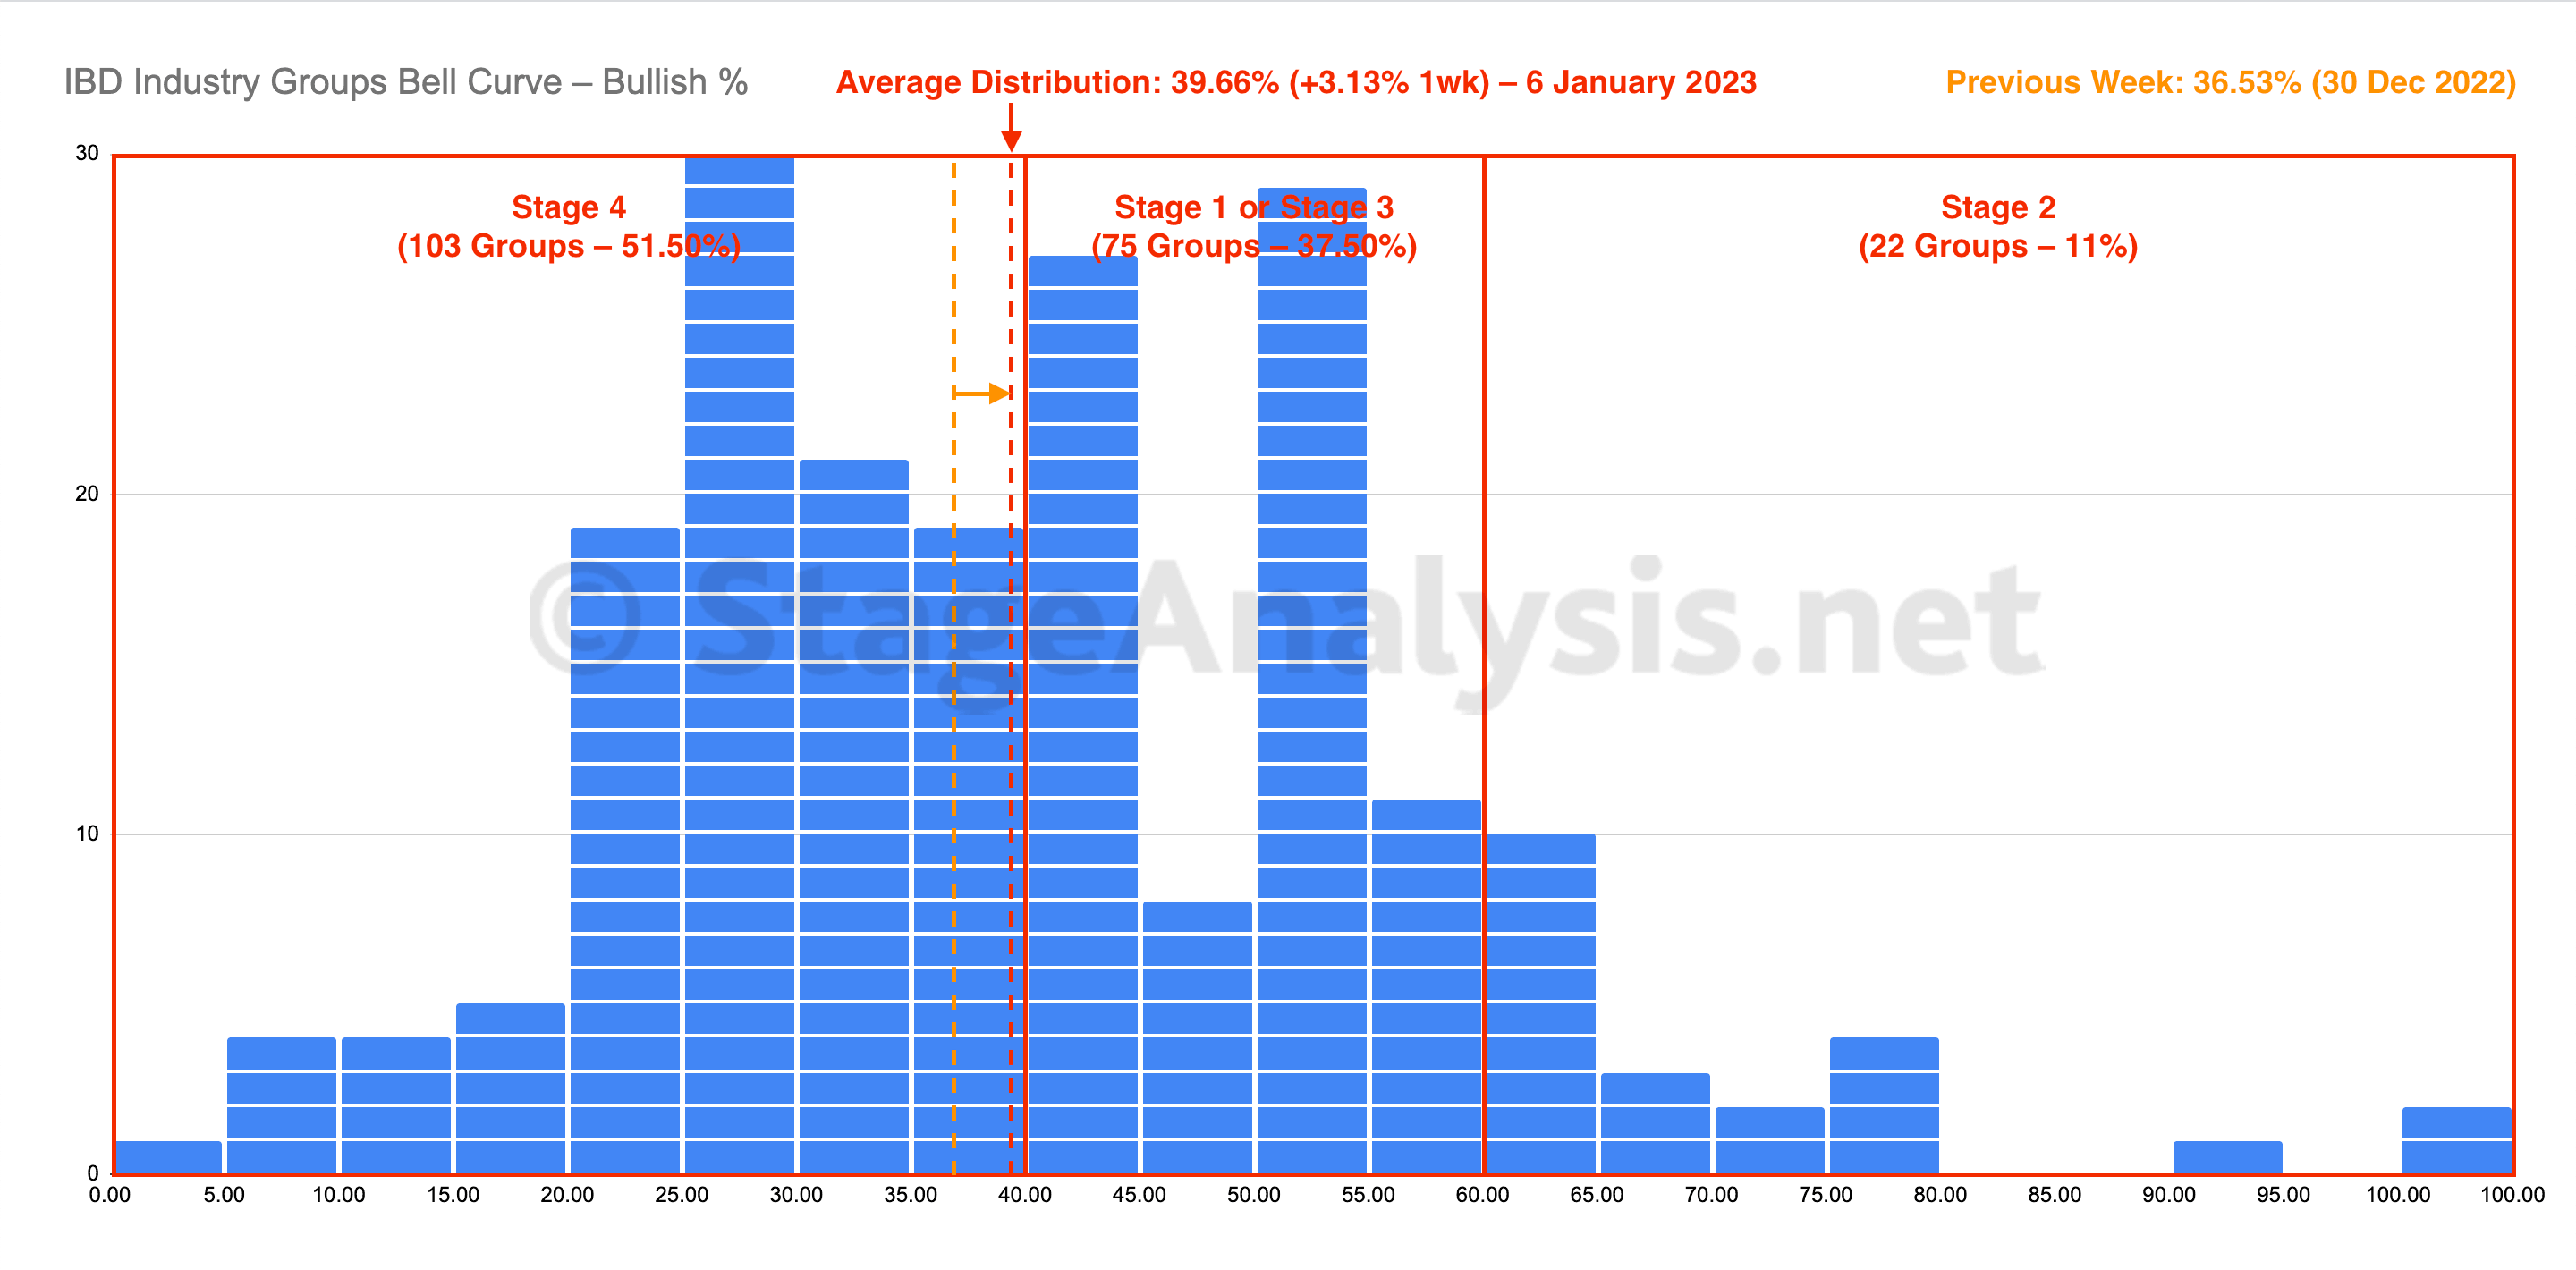
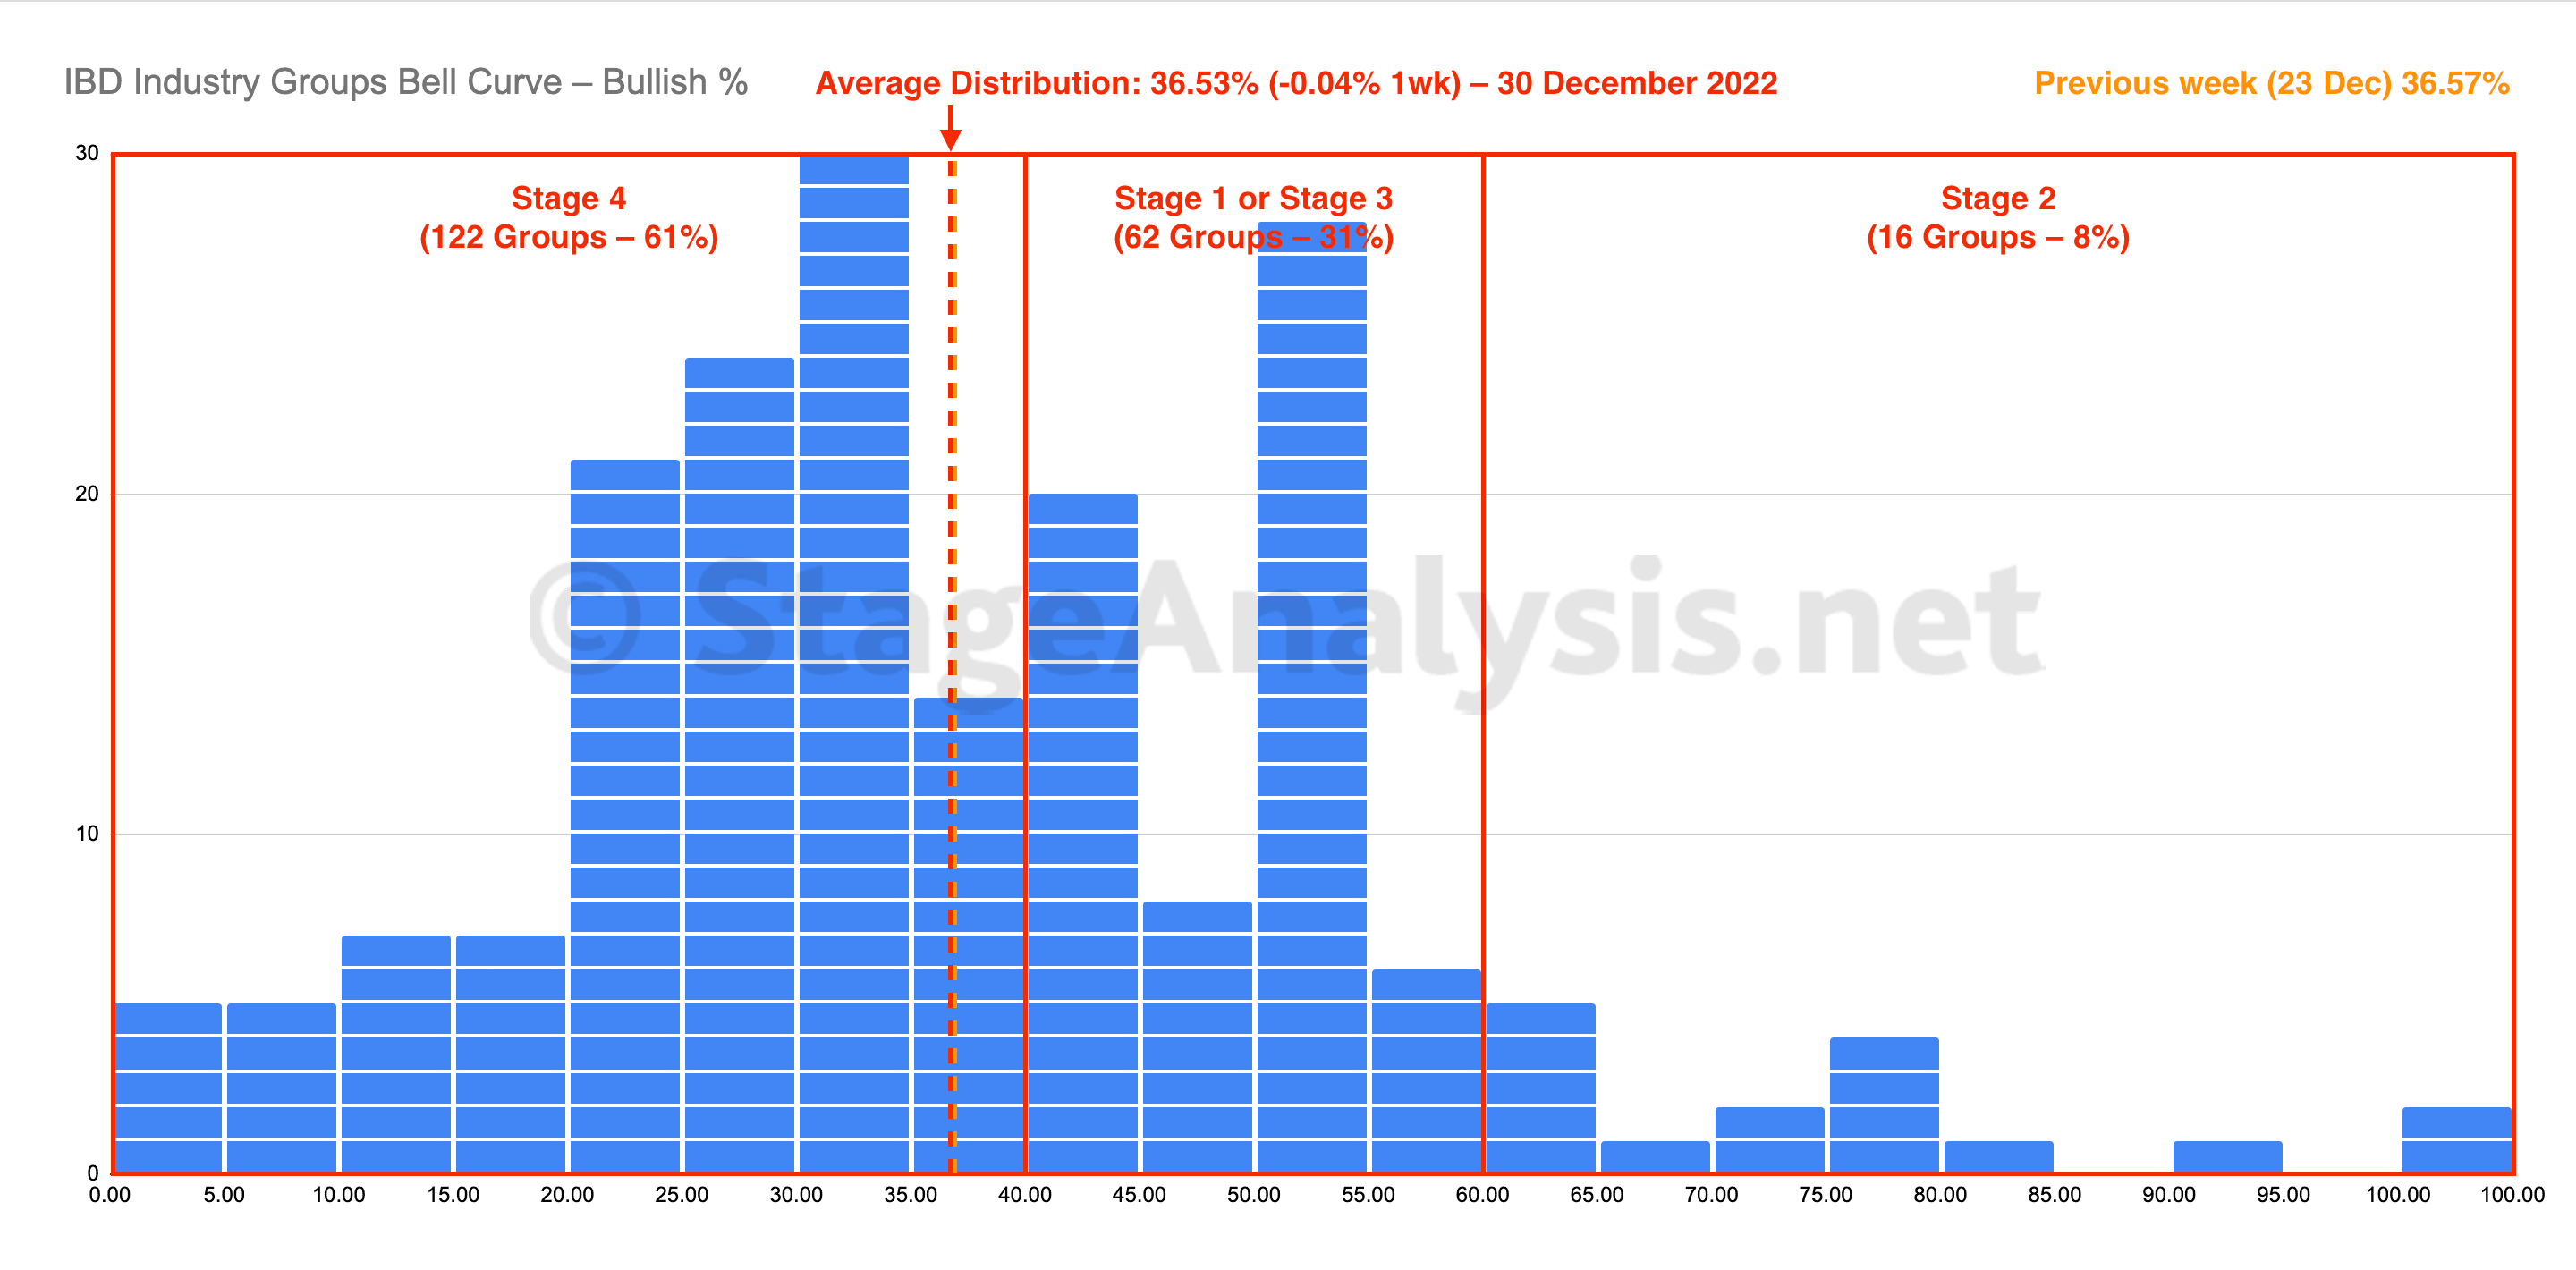
The IBD Industry Groups Bell Curve reversed slightly higher over the previous week with a +3.13% gain to close the week at 39.66%. The amount of groups in Stage 4 decreased by -19 (-9.5%), and the amount of groups in Stage 2 increased by +6 (+3%), while the amount groups in Stage 1 or Stage 3 increased by +13 (+6.5%).
Read More
Blog
07 January, 2023
IBD Industry Groups Bell Curve – Bullish Percent
07 January, 2023
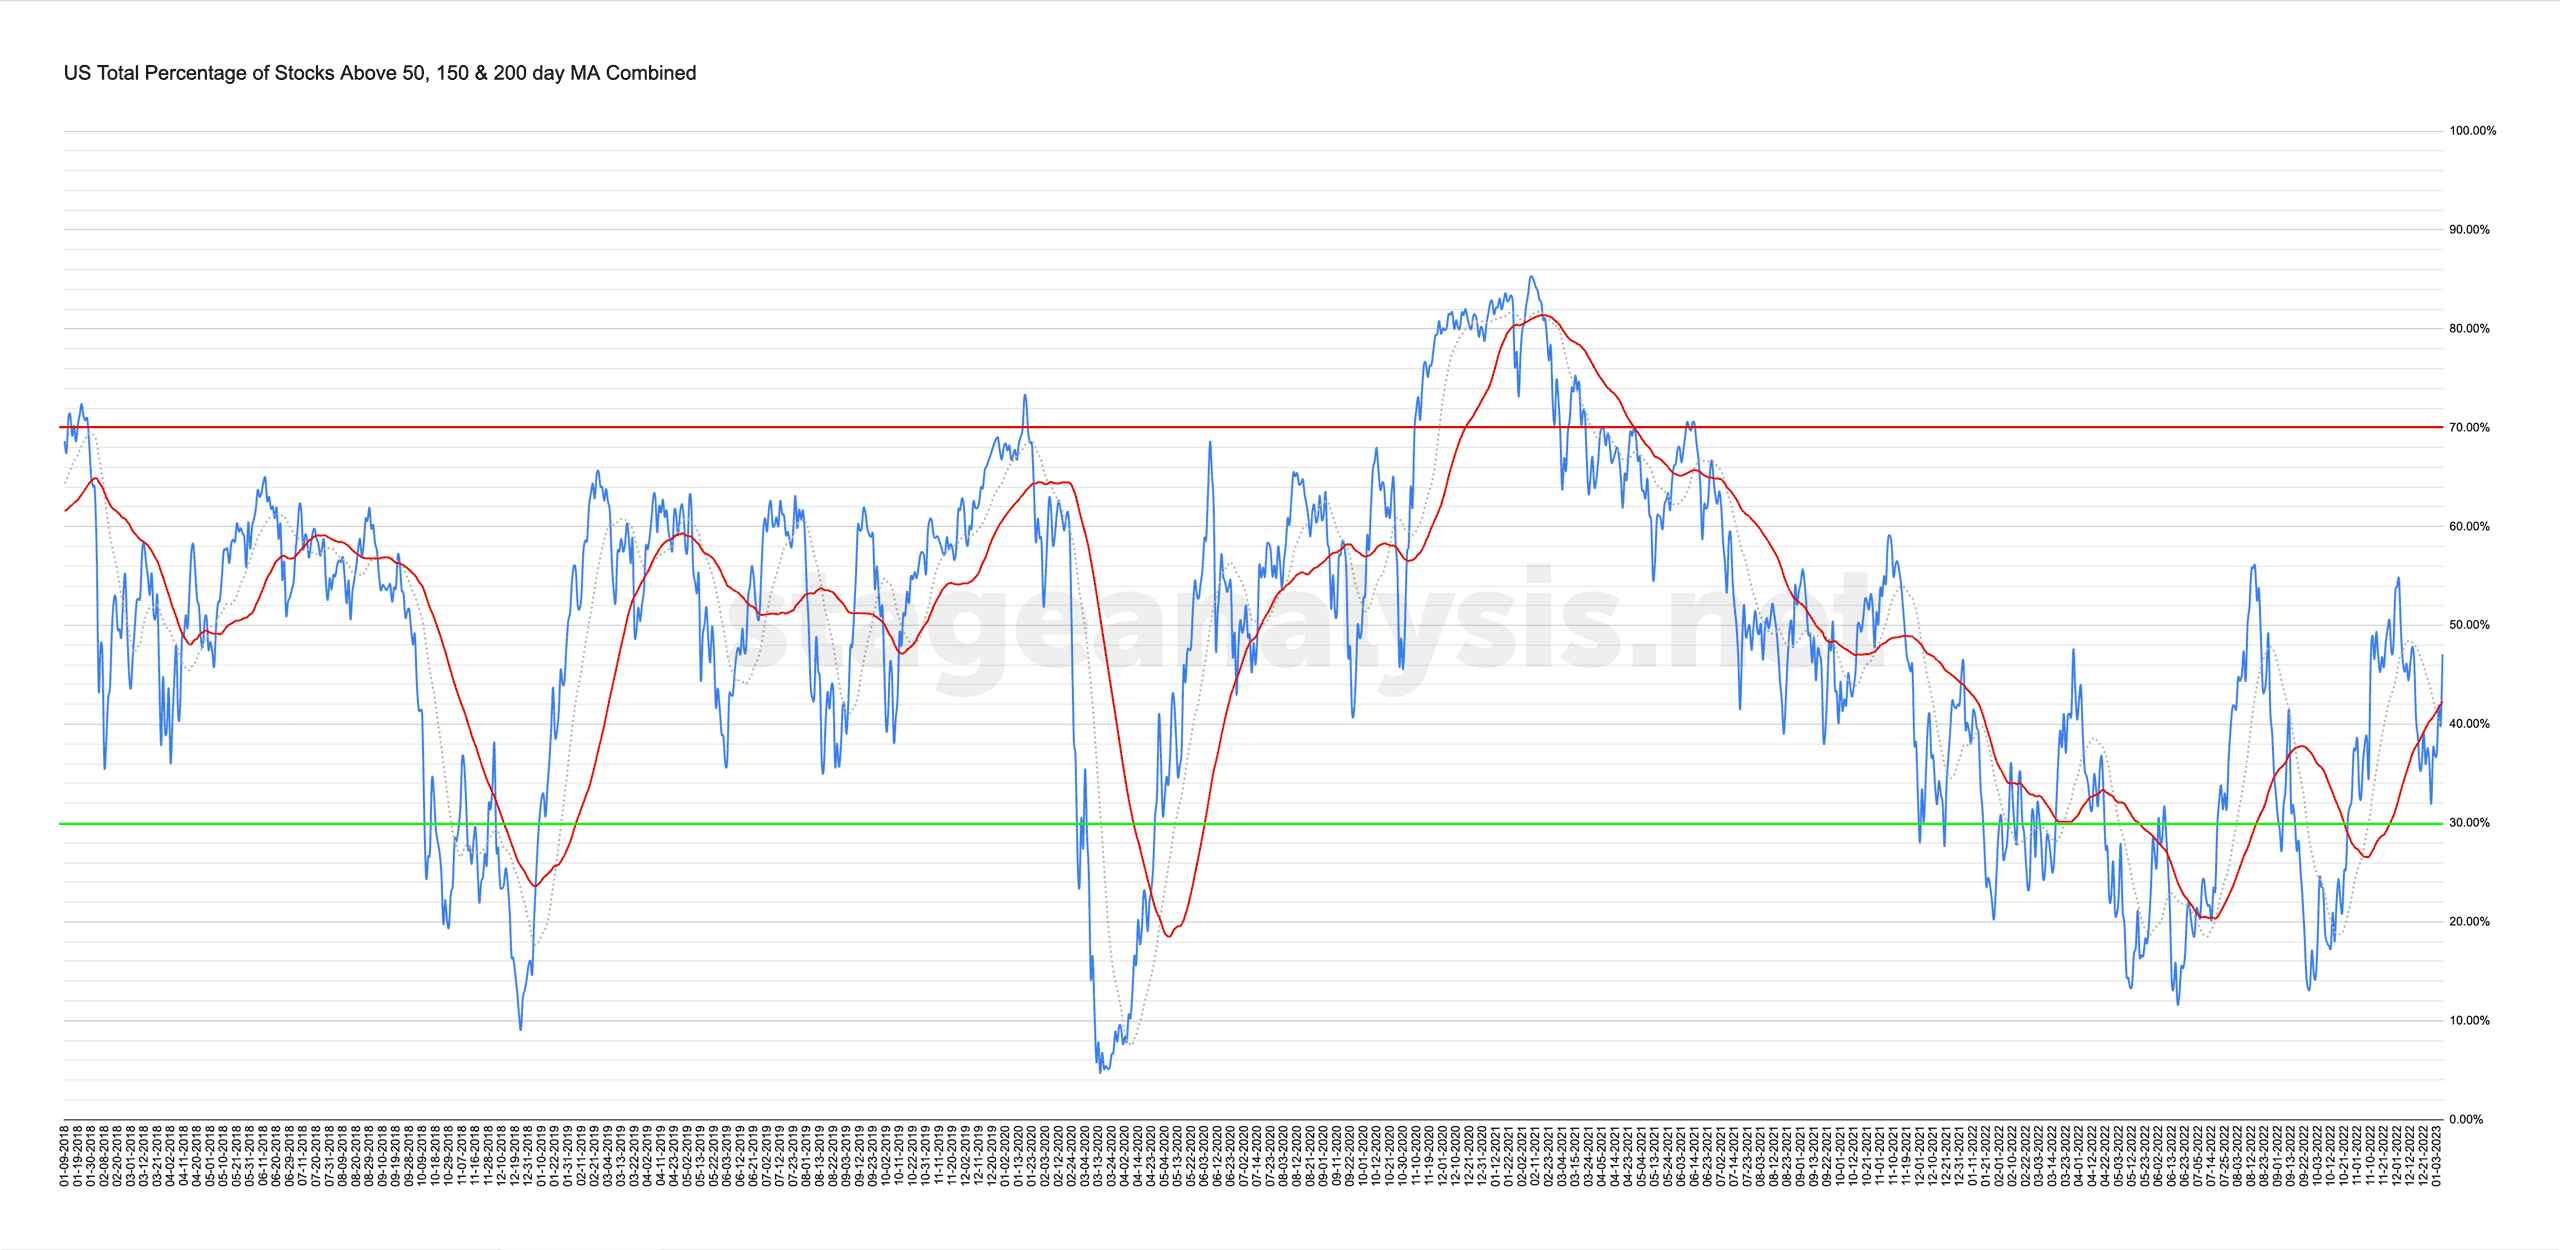
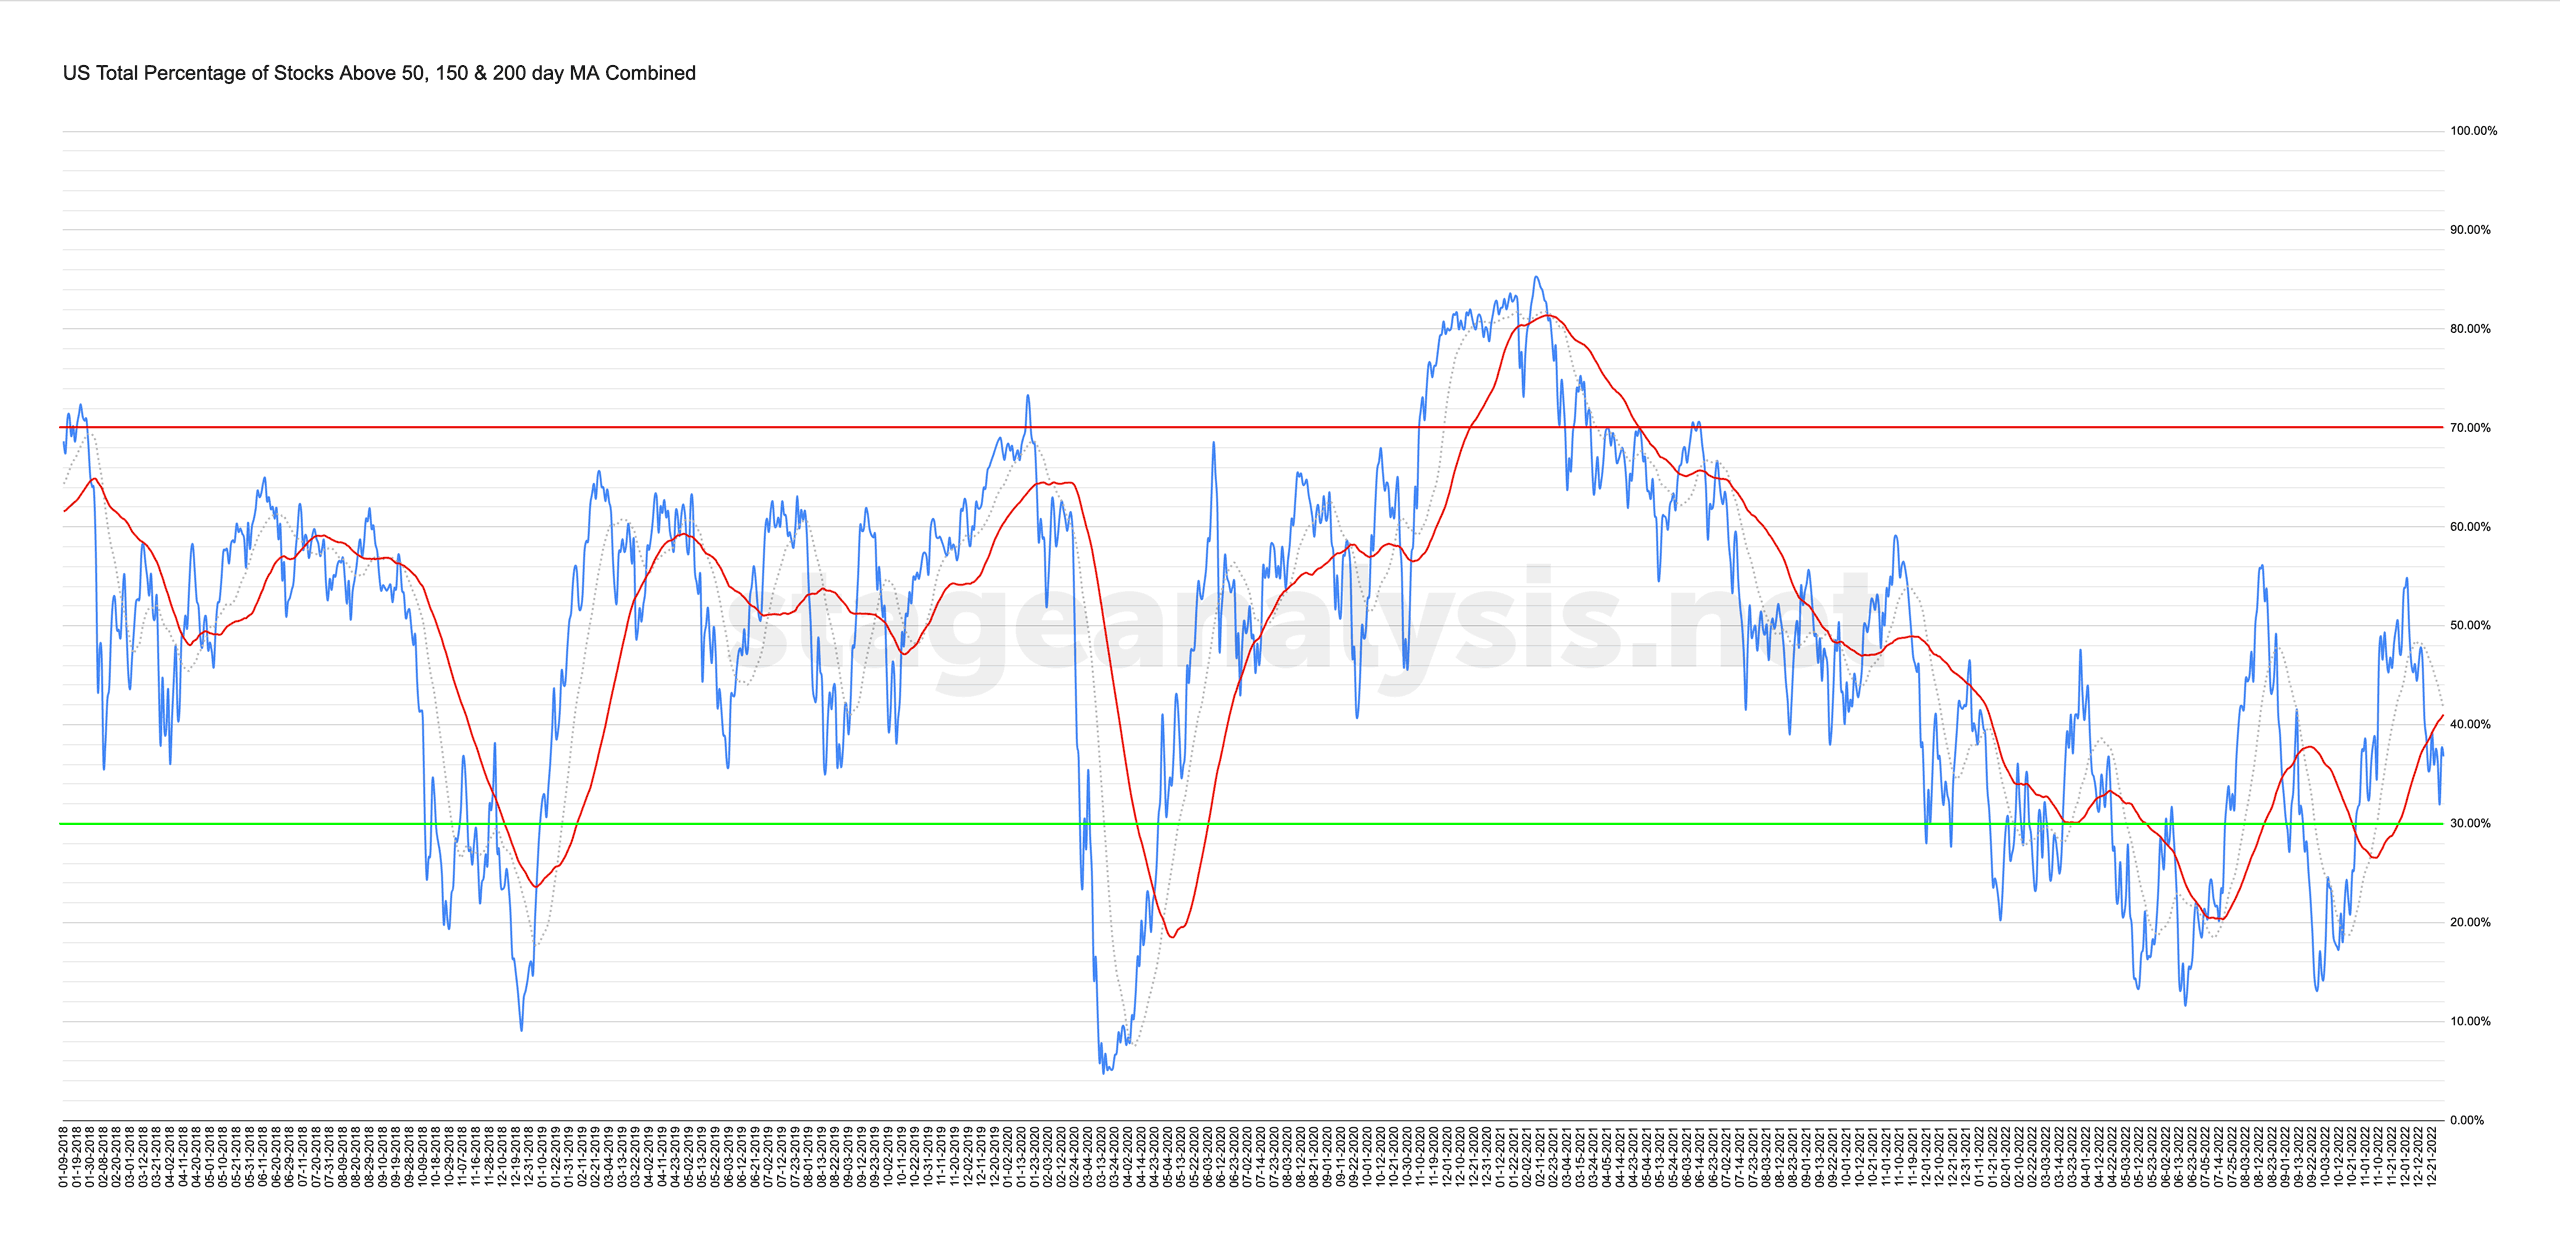
Market Breadth: Percentage of Stocks Above their 50 Day, 150 Day & 200 Day Moving Averages Combined
Custom Percentage of Stocks Above Their 50 Day, 150 Day & 200 Day Moving Averages Combined Market Breadth Charts for the Overall US Market, NYSE and Nasdaq for Market Timing and Strategy.
Read More
06 January, 2023
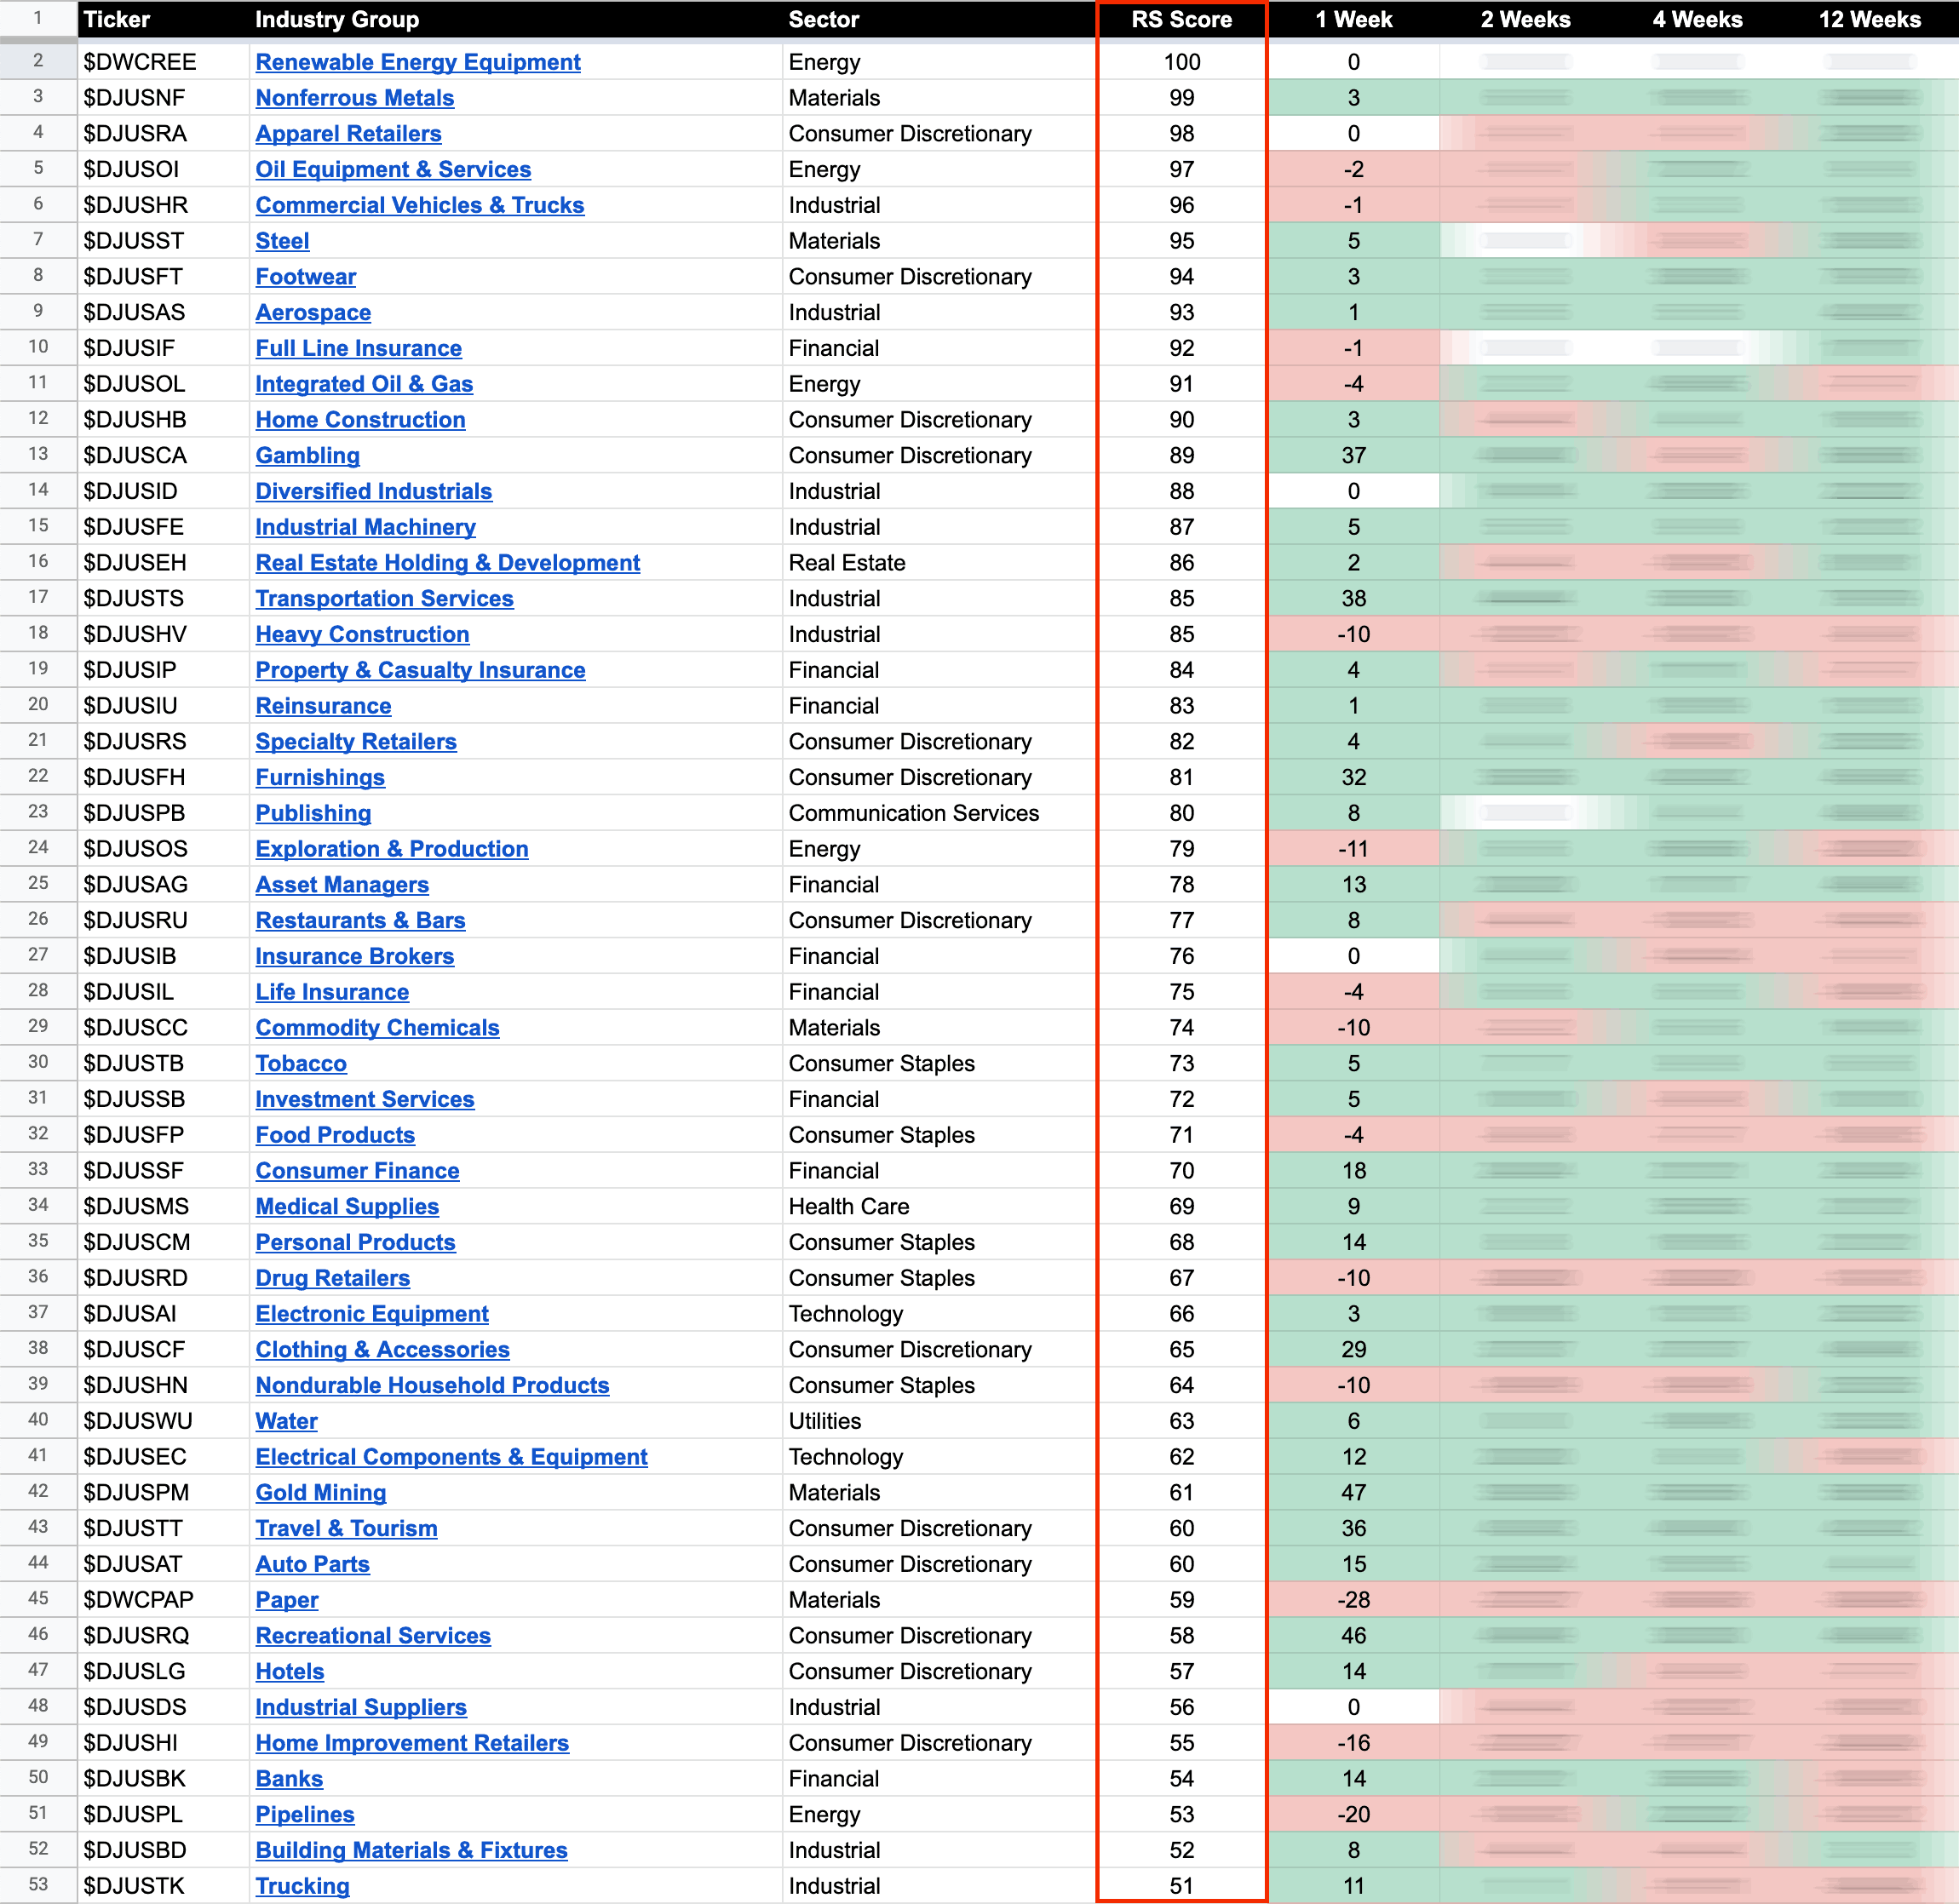
US Stocks Industry Groups Relative Strength Rankings
The purpose of the Relative Strength (RS) tables is to track the short, medium and long term RS changes of the individual groups to find the new leadership earlier than the crowd...
Read More
05 January, 2023
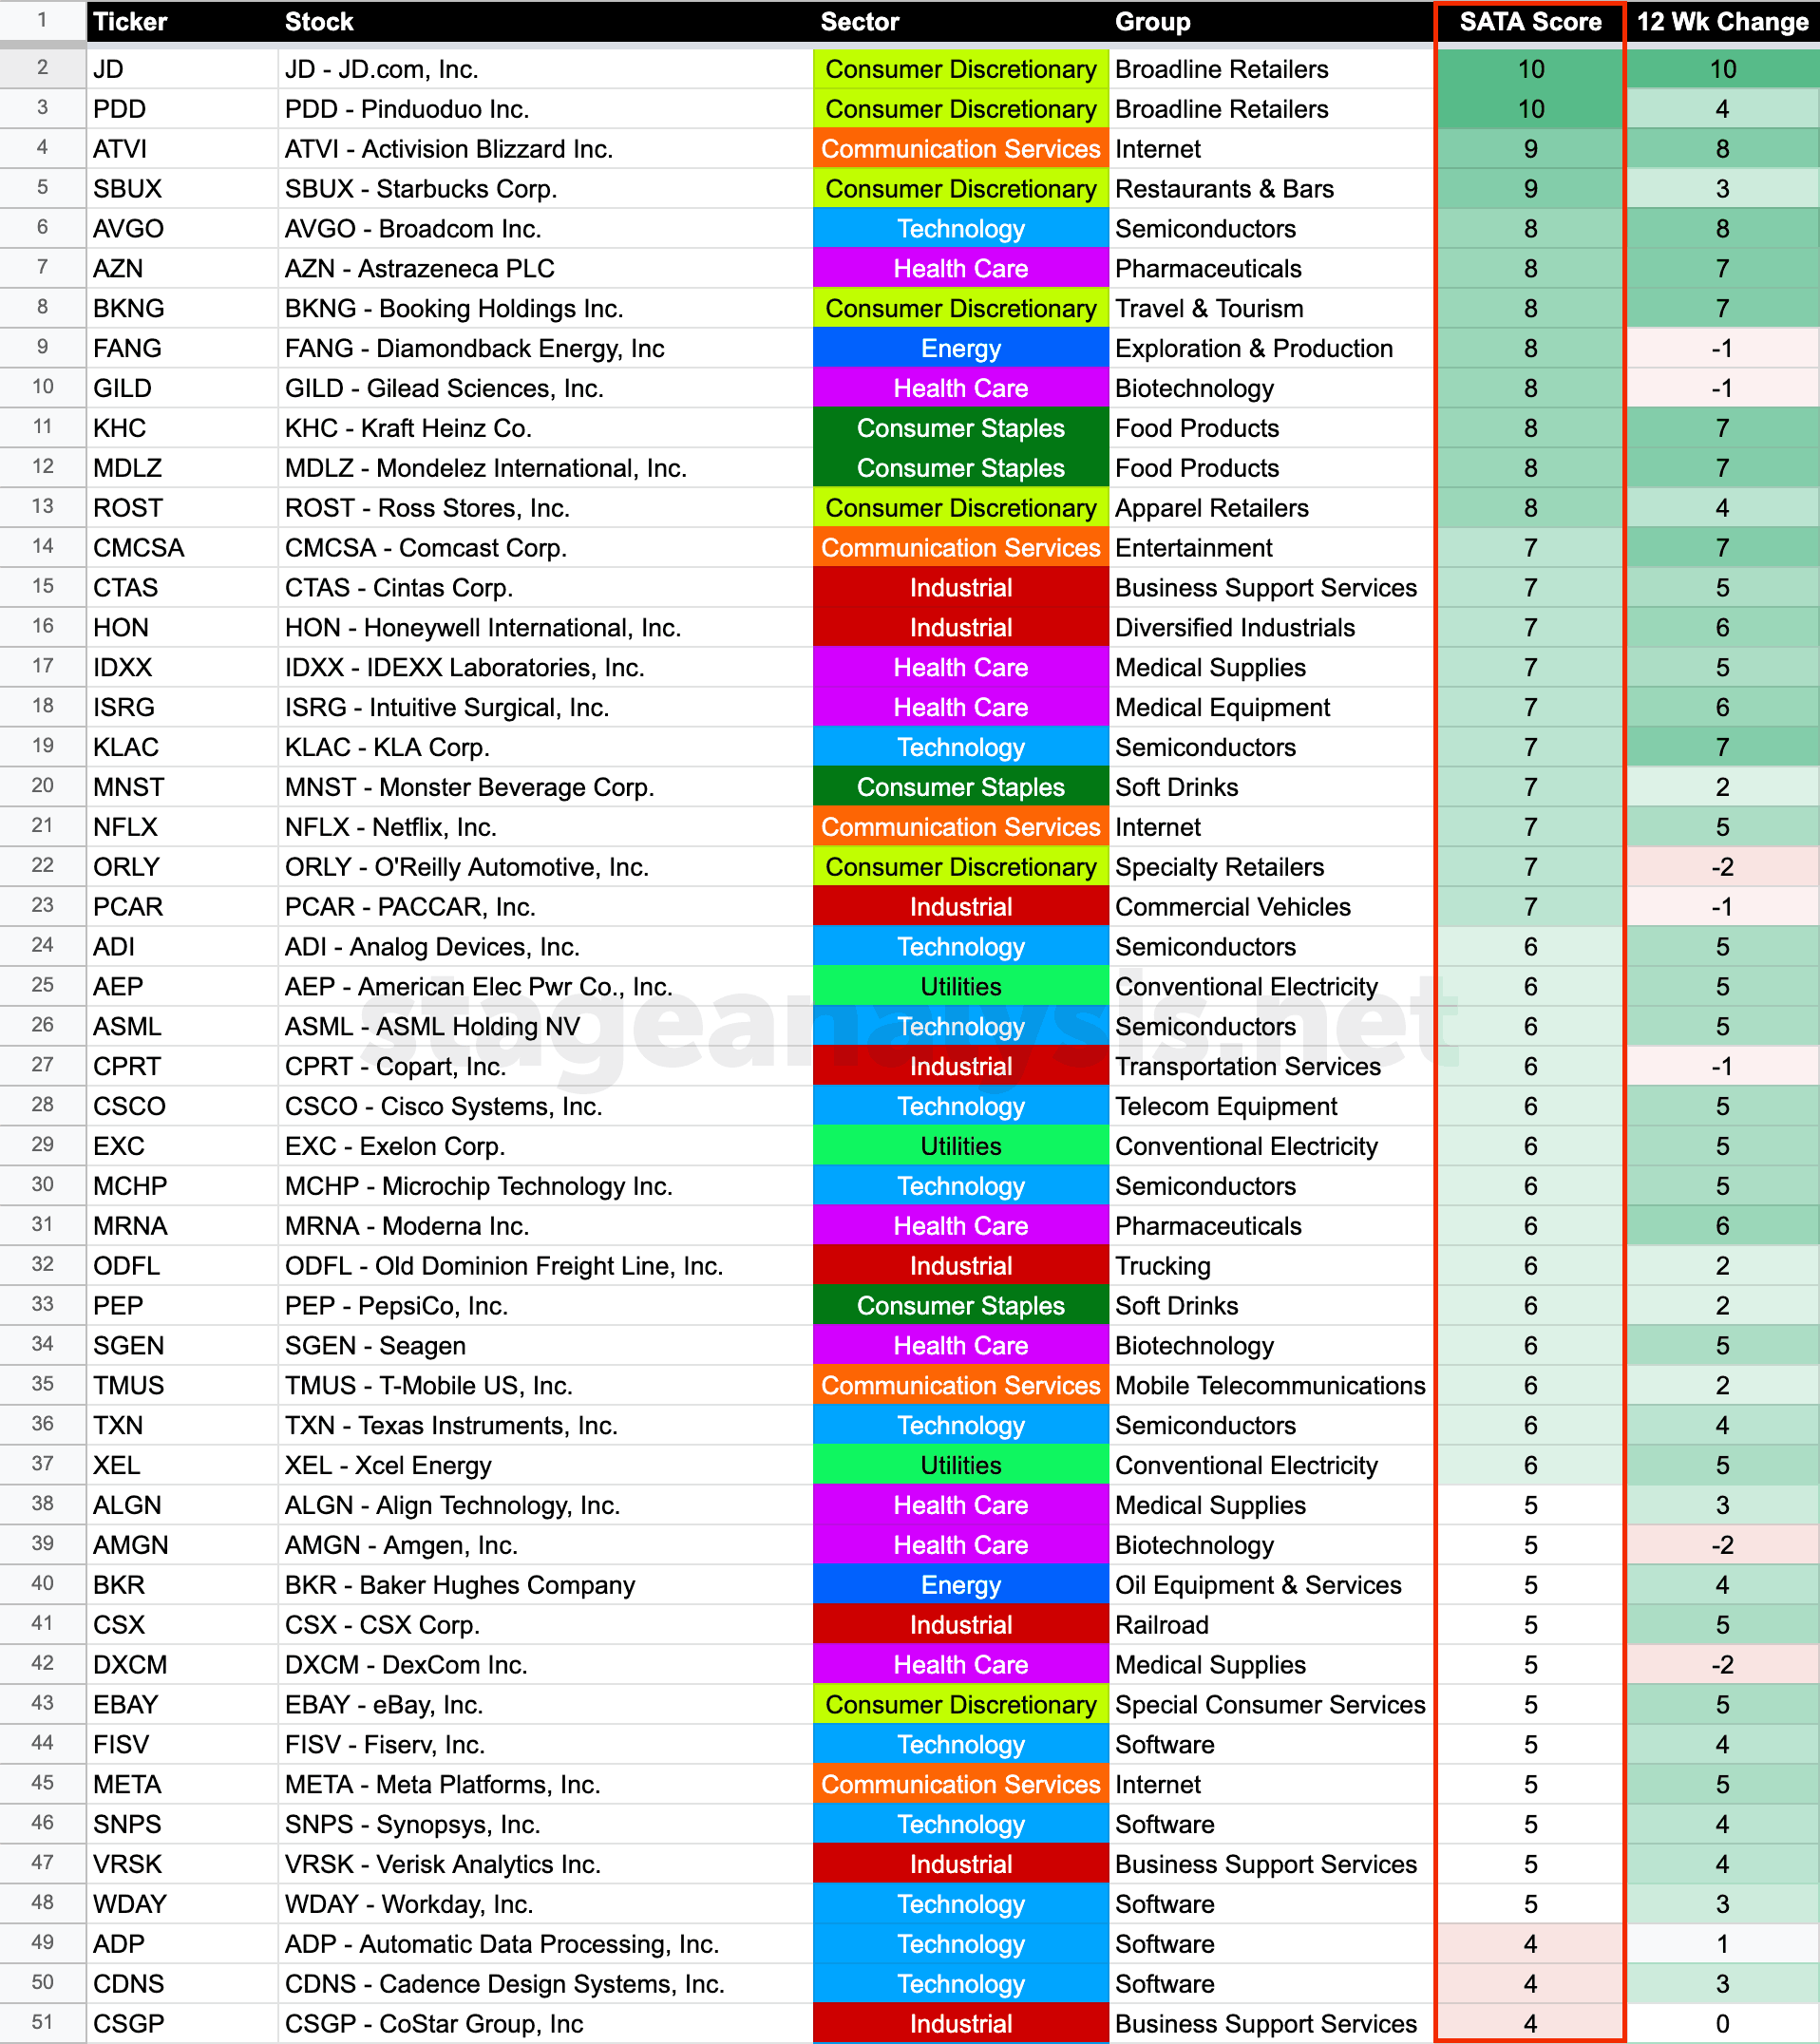
Stage Analysis Technical Attributes Scores – Nasdaq 100
We last covered the Stage Analysis Technical Attributes (SATA) weekly scores for the Nasdaq 100 back in mid November, which shows a rough guide of the Stages of the individual stocks within the Nasdaq 100. i.e. everything above a 7 would be considered in the Stage 2 zone (Positive), 4-6 in the Stage 1 or Stage 3 zone (Neutral), and 3 or below is the Stage 4 zone (Negative)...
Read More
04 January, 2023
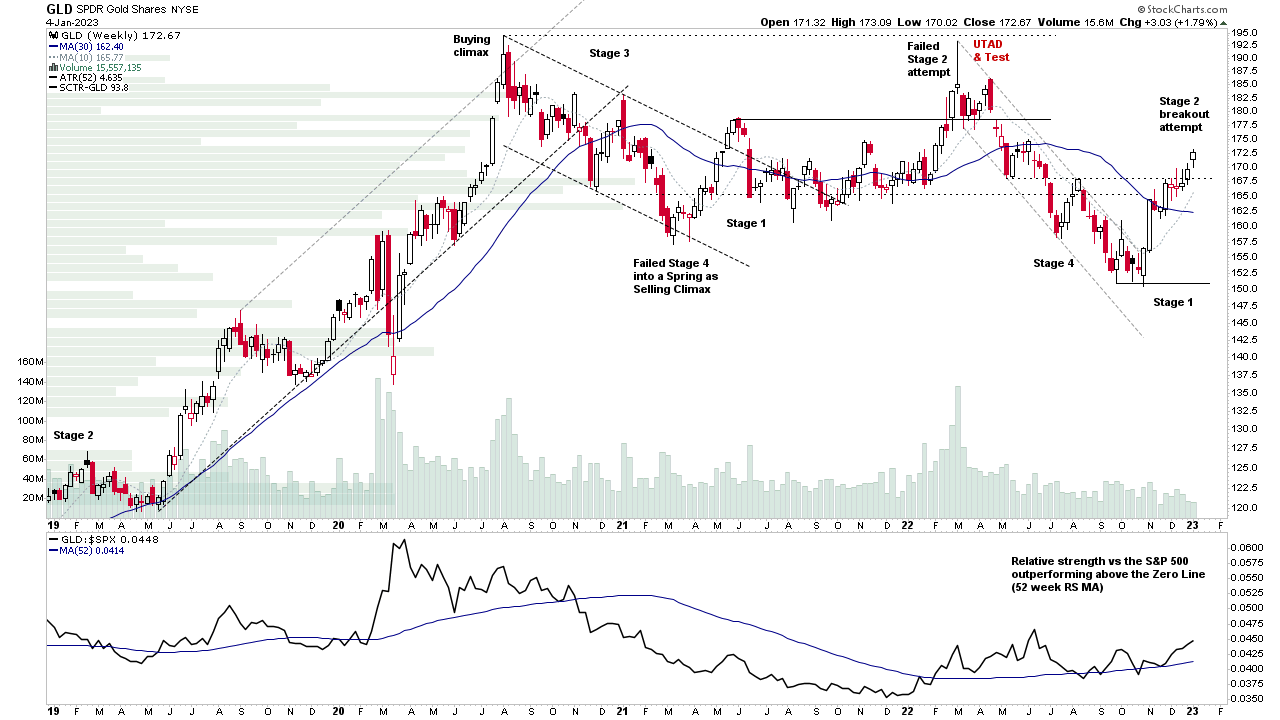
Gold Attempting To Move Into Stage 2 and the US Stocks Watchlist – 4 January 2023
A massive list today, with numerous Stage 2 breakout attempts and breakout attempts within Stage 1 bases still. Gold & Silver Mining stocks were a major theme, as physical gold futures attempts to move into Stage 2, after testing the breakout level continually for the last month...
Read More
03 January, 2023
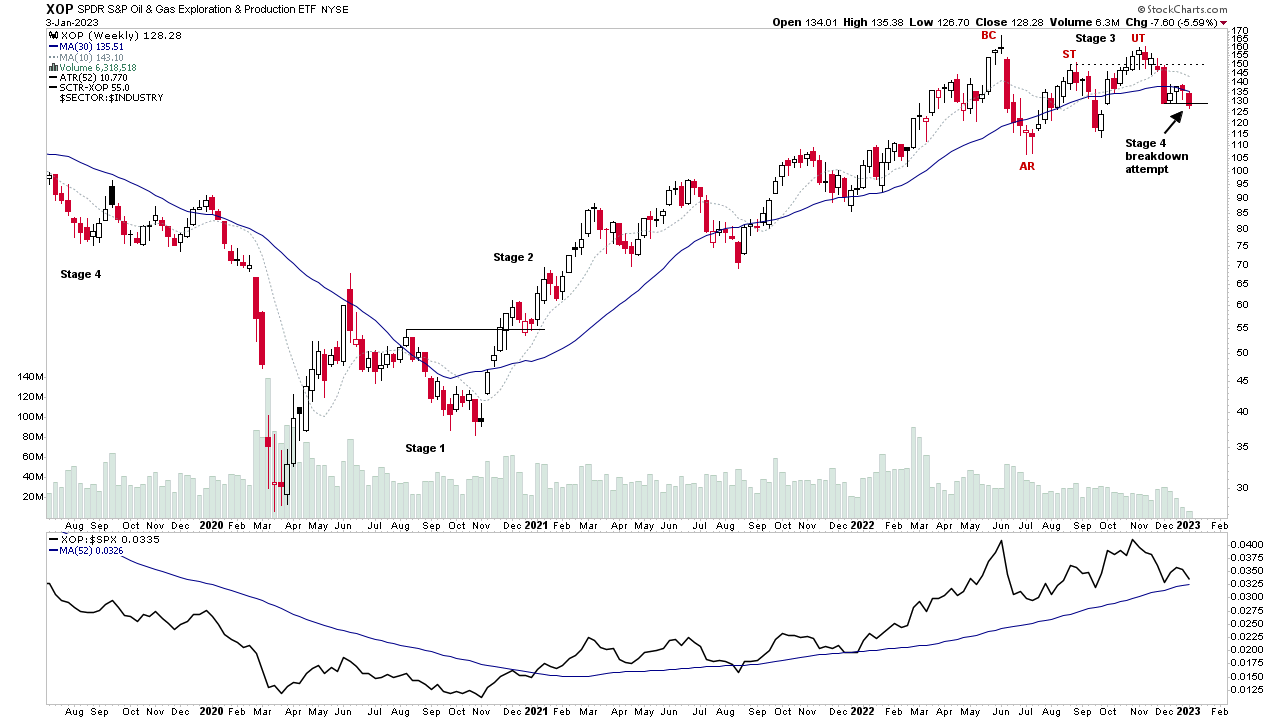
Oil & Gas Stocks – Multiple Stage 4 Breakdowns & Technical Weakness – 3 January 2023 (36mins)
The start of the new trading year in the US stock market saw multiple Stage 4 breakdown attempts in the Energy group stocks, with the Exploration and Production group stocks dominating the scans of the stocks breaking down into Stage 4 and within late Stage 3 structures...
Read More
02 January, 2023
Stage Analysis Members Video – 2 January 2023 (1hr 31mins)
The Stage Analysis members weekend video with an end of year review of the markets, and special features on the US Industry Groups Relative Strength 2022 strongest groups, and the IBD Top 5 stocks of 2022. Plus the IBD industry group bell curve, and the market breadth charts to determine the weight of evidence. Followed by the US watchlist stocks in detail on multiple timeframes.
Read More
02 January, 2023
US Stocks Watchlist – 2 January 2023
There were 36 stocks highlighted from the US stocks watchlist scans today...
Read More
01 January, 2023
IBD Industry Groups Bell Curve – Bullish Percent
The IBD Industry Groups Bell Curve was mostly unchanged on the week with only a -0.04% move, closing the week at 36.53%. The amount of groups in Stage 4 decreased by -1 (-0.5%), and the amount of groups in Stage 2 decreased by -2 (-1%), while the amount groups in Stage 1 or Stage 3 increased by -3 (+1.5%)...
Read More
31 December, 2022
Market Breadth: Percentage of Stocks Above their 50 Day, 150 Day & 200 Day Moving Averages Combined
Custom Percentage of Stocks Above Their 50 Day, 150 Day & 200 Day Moving Averages Combined Market Breadth Charts for the Overall US Market, NYSE and Nasdaq for Market Timing and Strategy.
Read More

