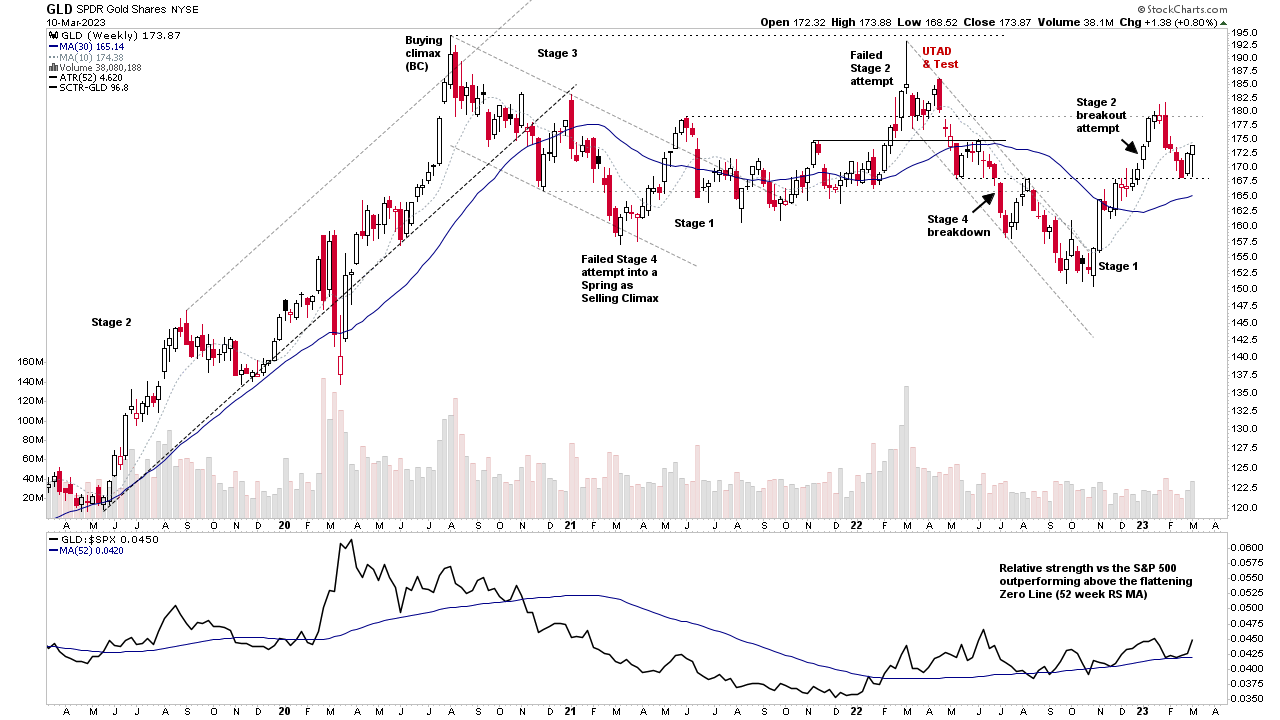
The Stage Analysis members weekend video this week begins with a discussion on Gold as it attempts to rebound around its prior Stage 2 breakout level in the turn with the US Dollar Index attempting to rollover at its Stage 4 breakdown level. Then a discussion of the Stage 4 breakdowns in the Bank indexes and different ETFs that cover them. Before the more regular weekly content of the Major Indexes Update, Futures and US Treasuries, IBD Industry Groups Bell Curve – Bullish Percent, US Stocks Industry Groups RS Rankings, Market Breadth Update – Weight of Evidence and some of the weeks Stage 2 Breakout attempts against the overall market action.
Read More
Blog
12 March, 2023
Stage Analysis Members Video – 12 March 2023 (1hr 29mins)
11 March, 2023
IBD Industry Groups Bell Curve – Bullish Percent
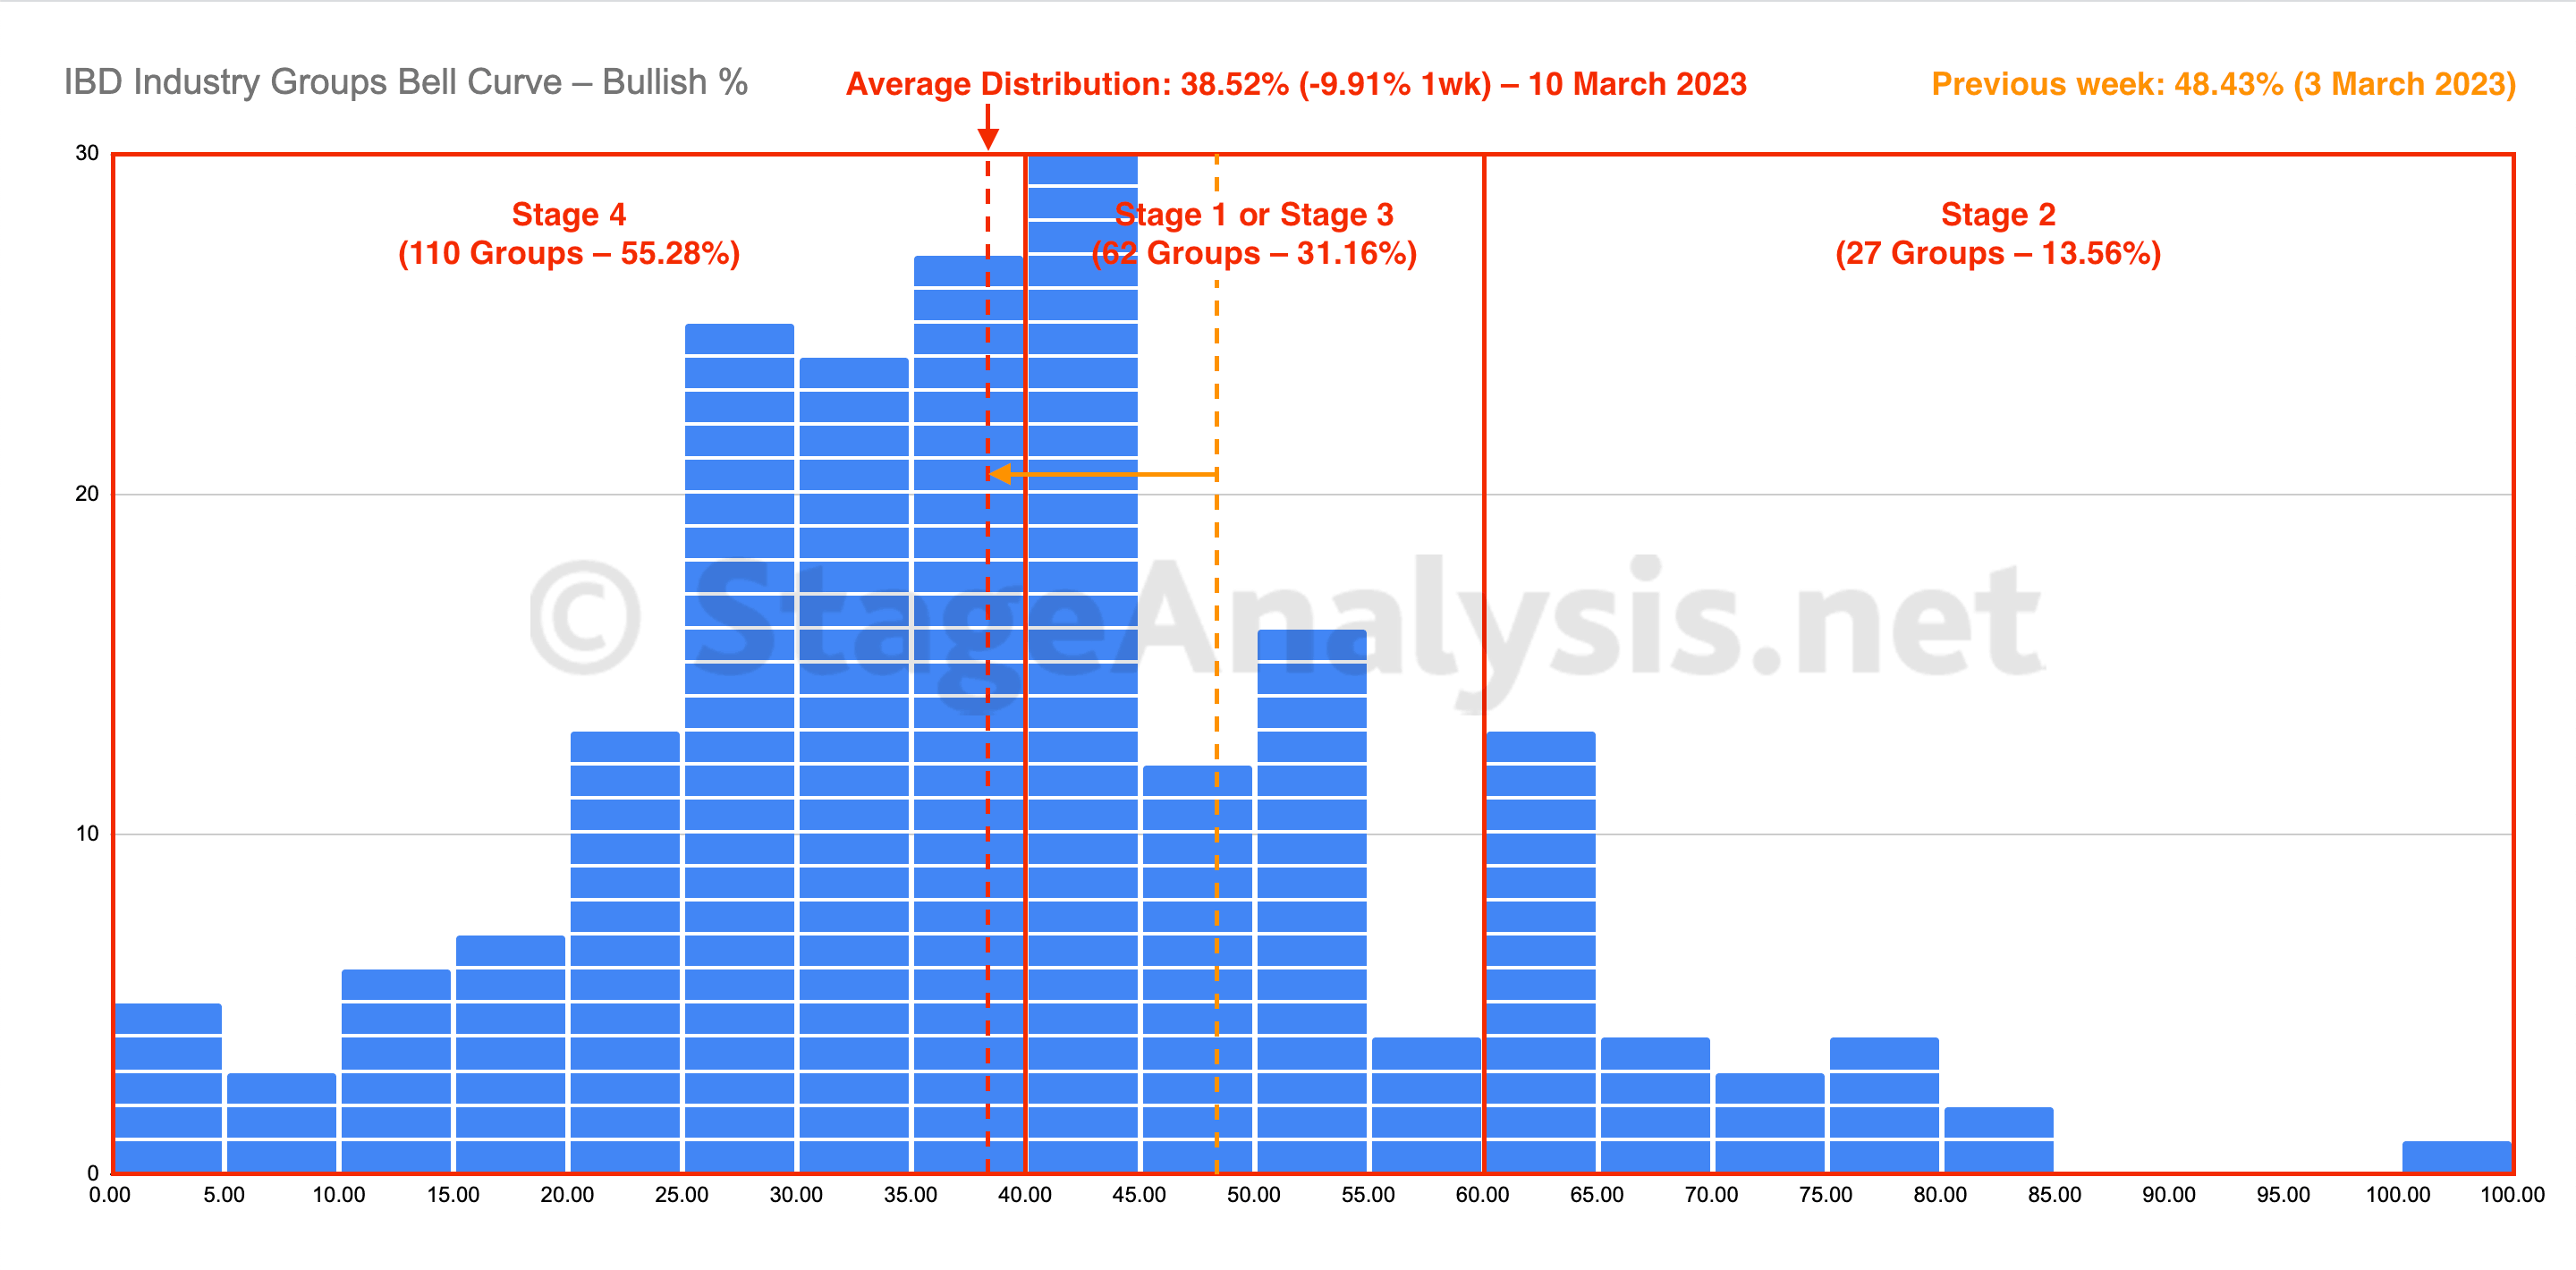
The IBD Industry Groups Bell Curve declined for a fifth week, losing -9.91% to finish at 38.52% overall. The amount of groups in Stage 4 increased by 52 (+26%), and the amount of groups in Stage 2 decreased by 27 (-13.6%), while the amount groups in Stage 1 or Stage 3 decreased by 25 (-12.6%)...
Read More
11 March, 2023
Market Breadth: Percentage of Stocks Above their 50 Day, 150 Day & 200 Day Moving Averages Combined
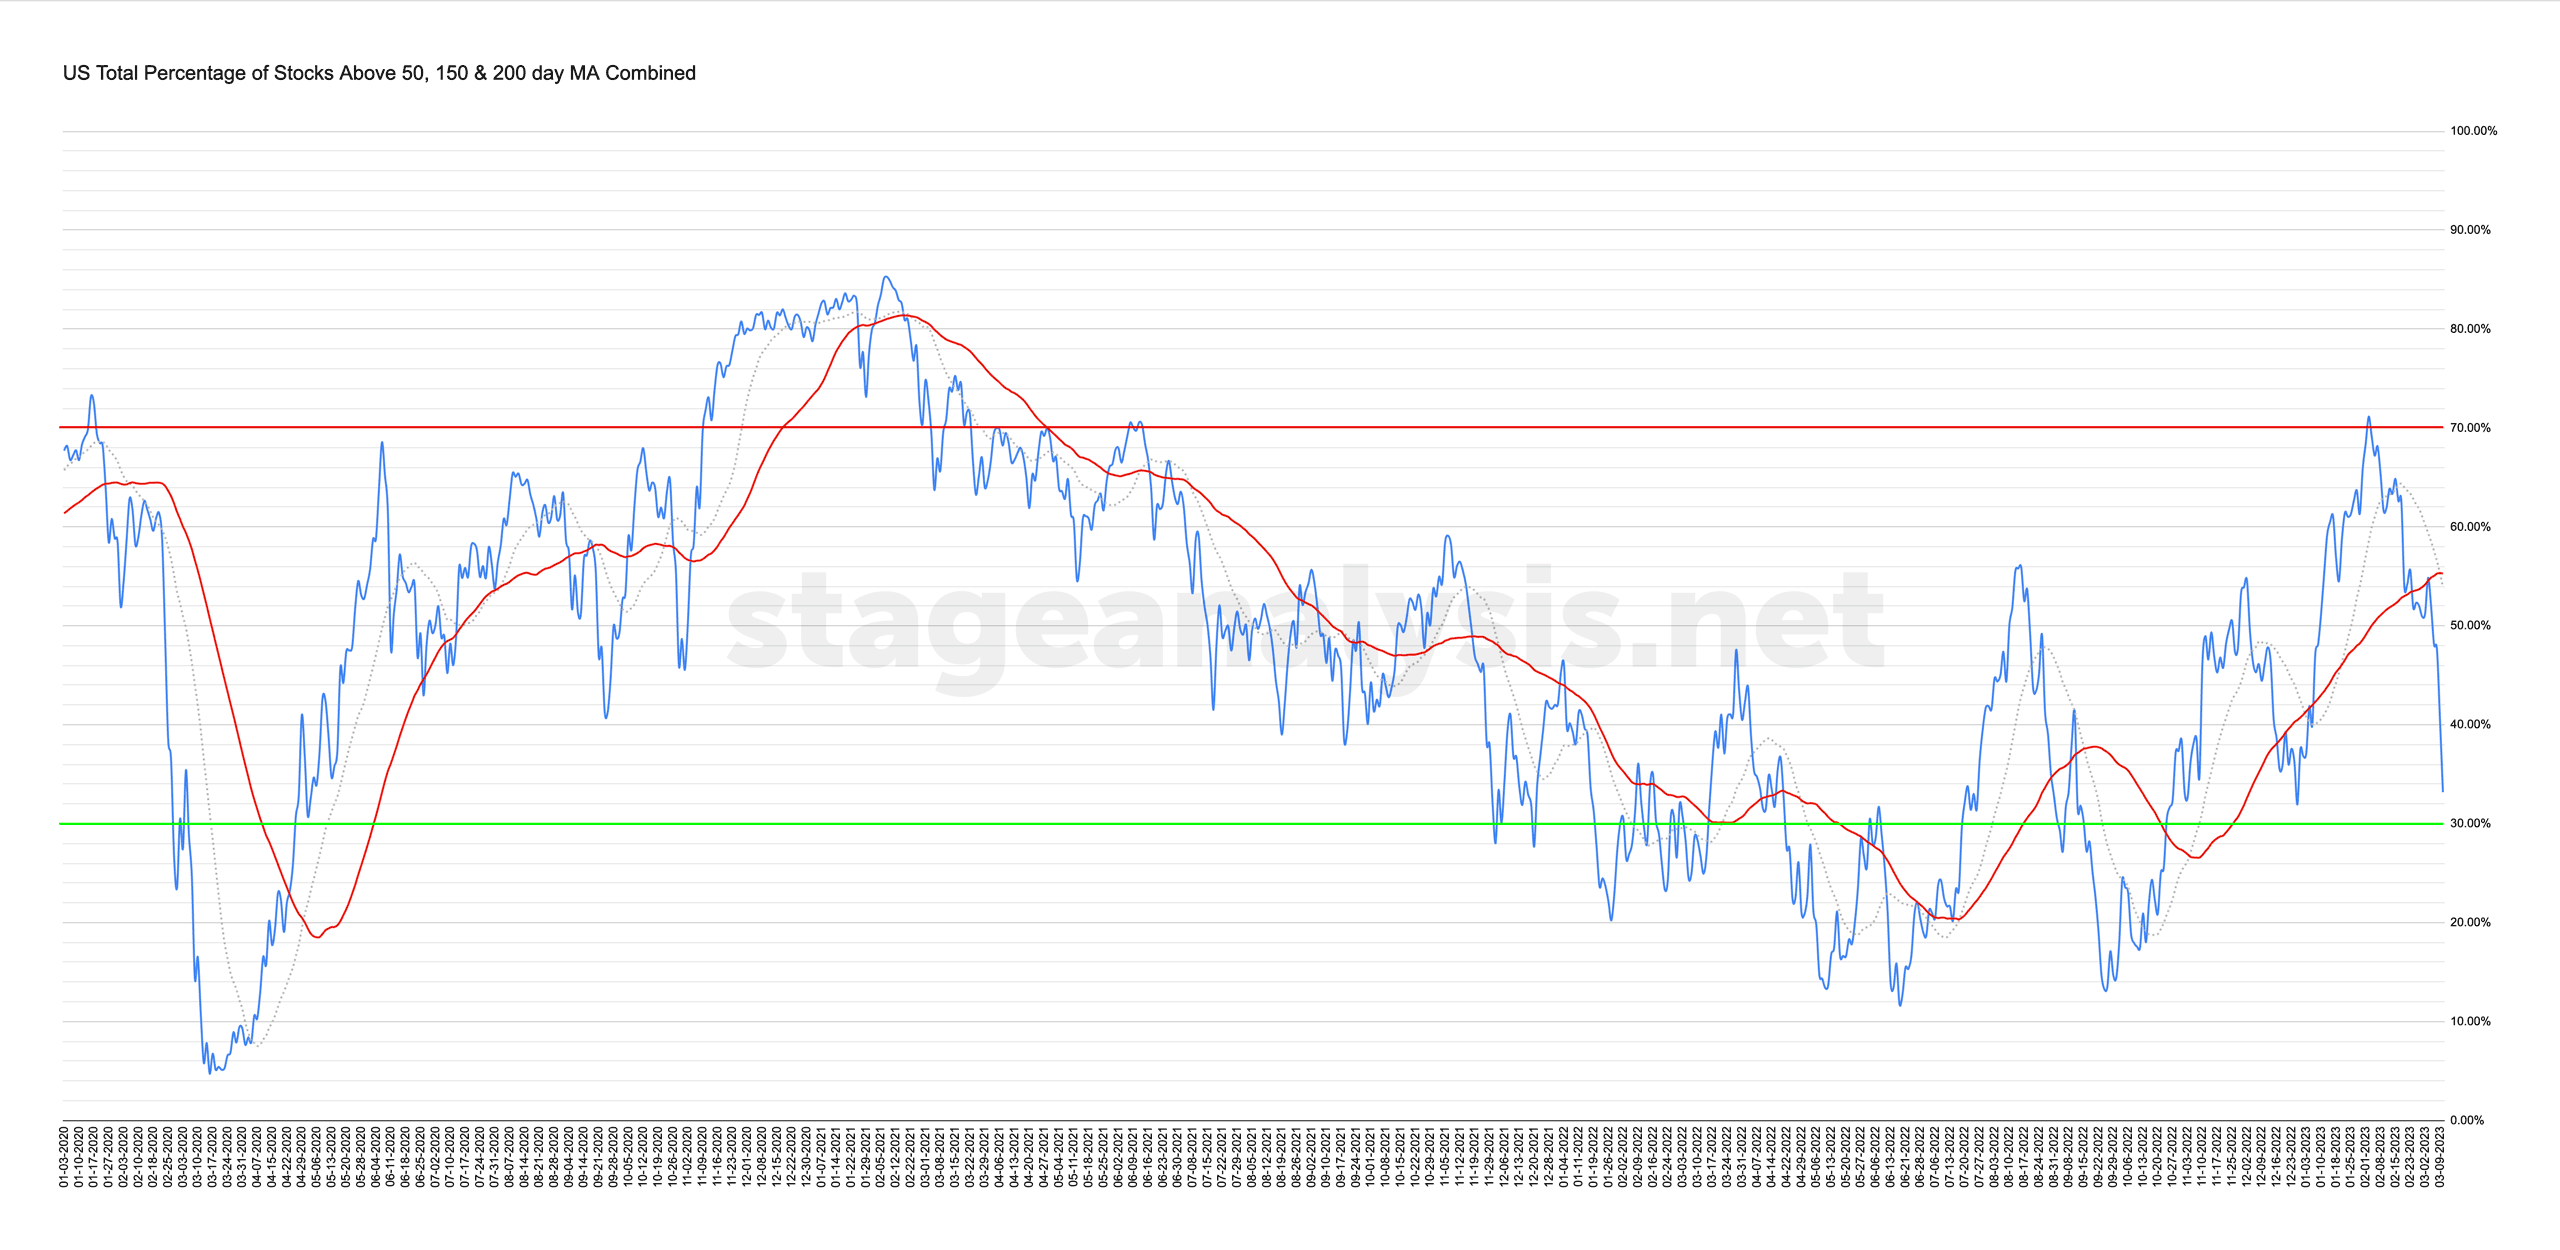
Custom Percentage of Stocks Above Their 50 Day, 150 Day & 200 Day Moving Averages Combined Market Breadth Charts for the Overall US Market, NYSE and Nasdaq for Market Timing and Strategy.
Read More
10 March, 2023
US Stocks Industry Groups Relative Strength Rankings
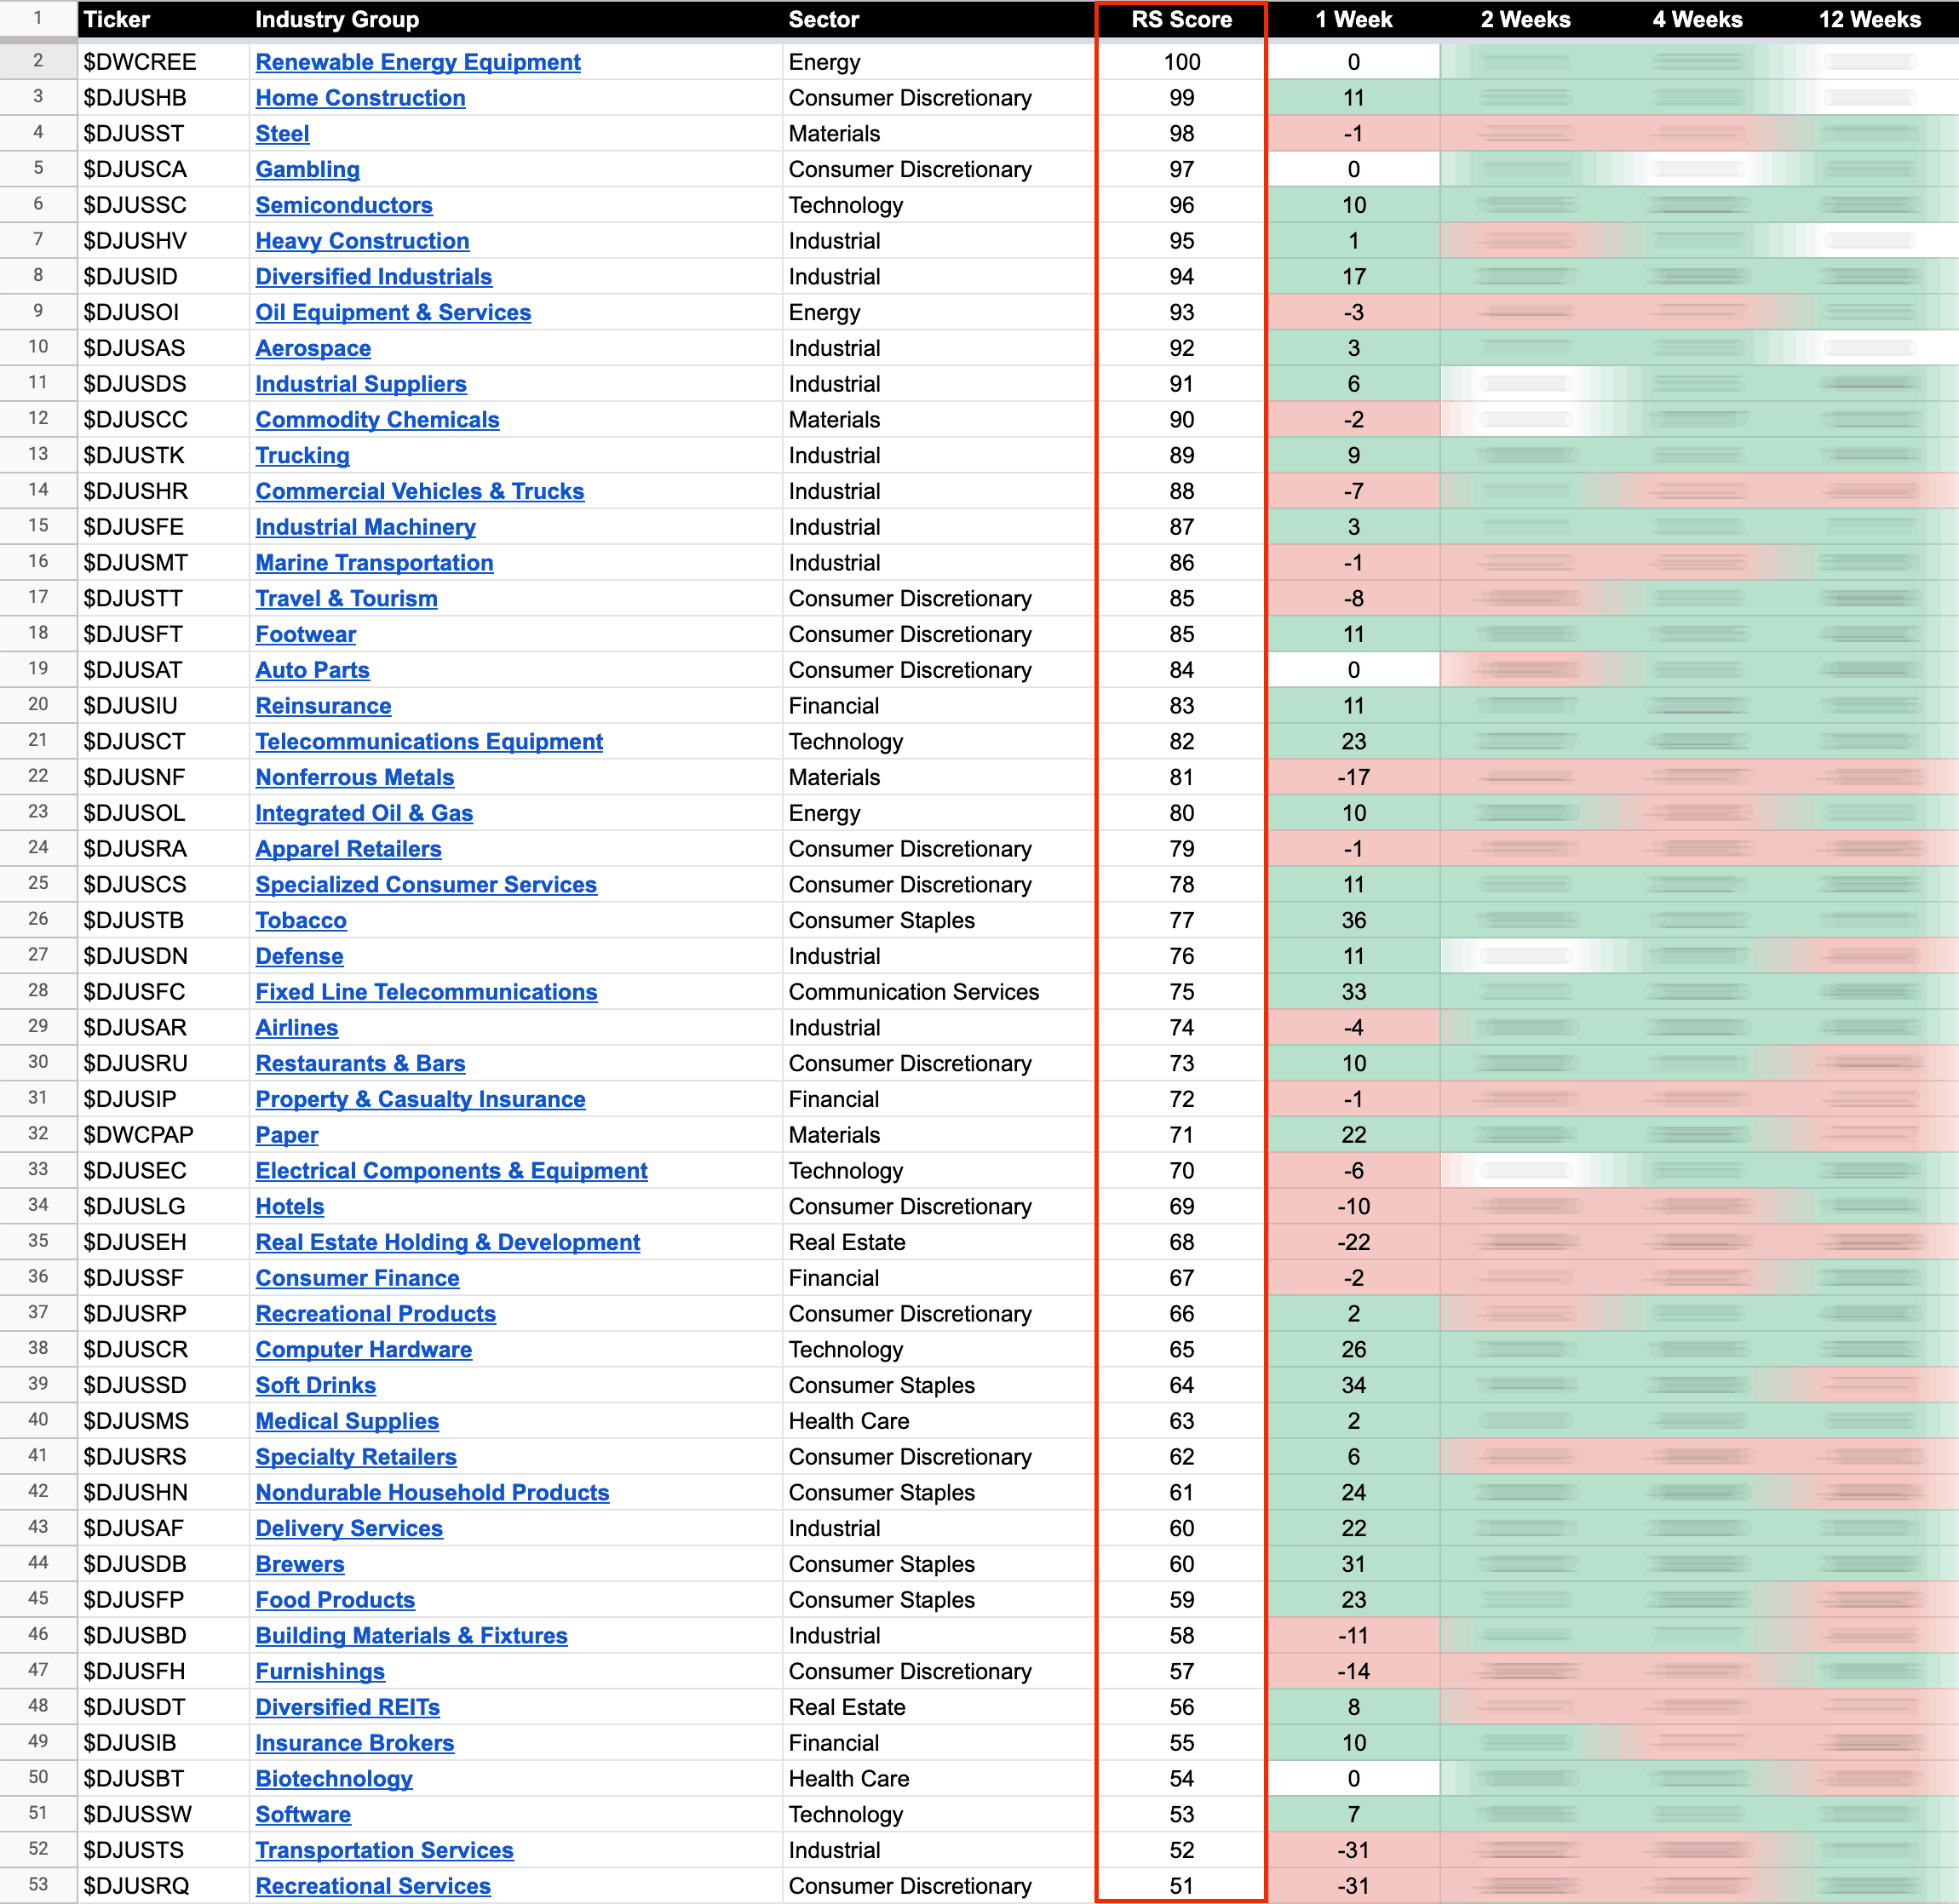
The purpose of the Relative Strength (RS) tables is to track the short, medium and long term RS changes of the individual groups to find the new leadership earlier than the crowd...
Read More
08 March, 2023
US Stocks Watchlist – 8 March 2023
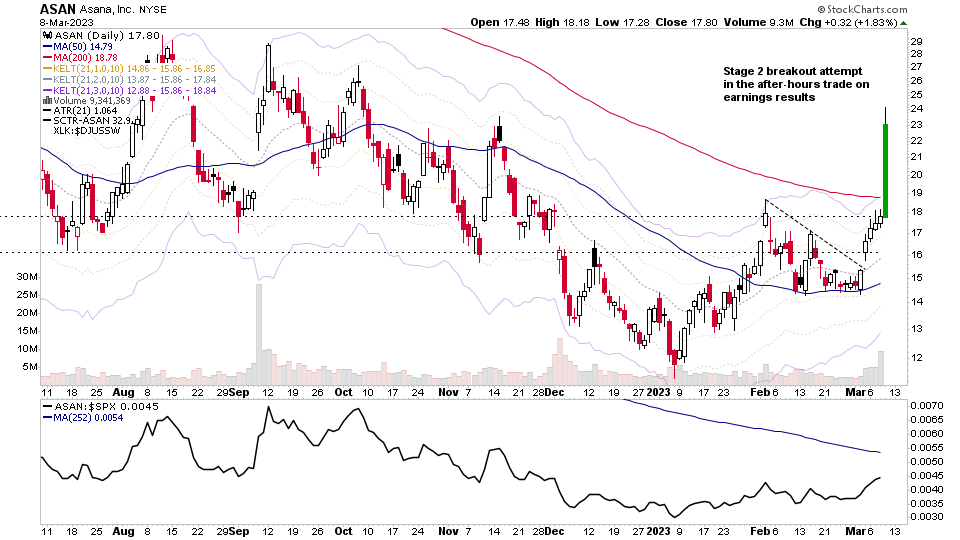
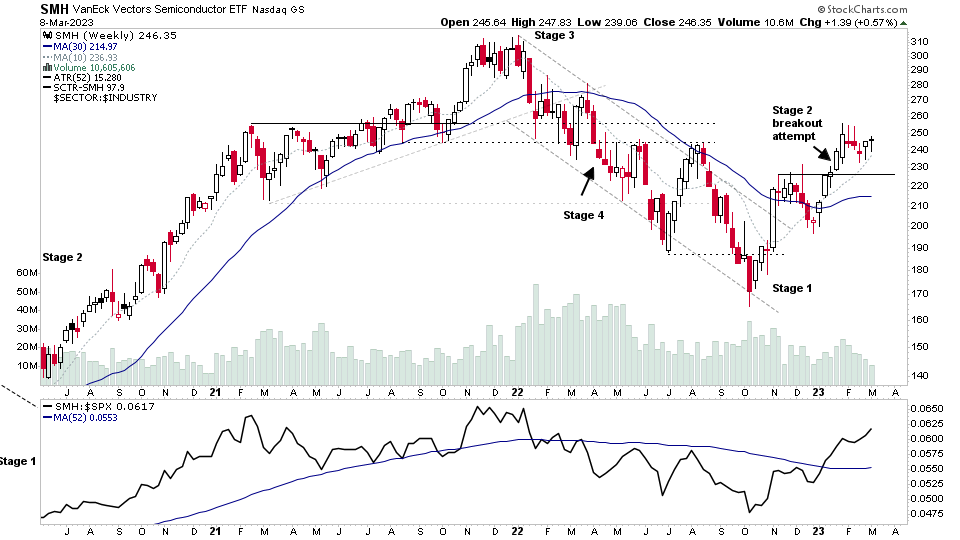
Semiconductors continues to be the major group theme of the last weeks watchlist scans with around 20% of the group highlighted, with many in the early Stage 2 backup zone...
Read More
08 March, 2023
Stage Analysis Members Video – 8 March 2023 (50 mins)
The Stage Analysis members midweek video discussing the S&P 500, Nasdaq Composite, Russell 2000 and short-term market breadth indicators. Plus a detailed look at the US Watchlist Stocks from today and yesterdays post in more detail with live markups on multiple timeframes.
Read More
07 March, 2023
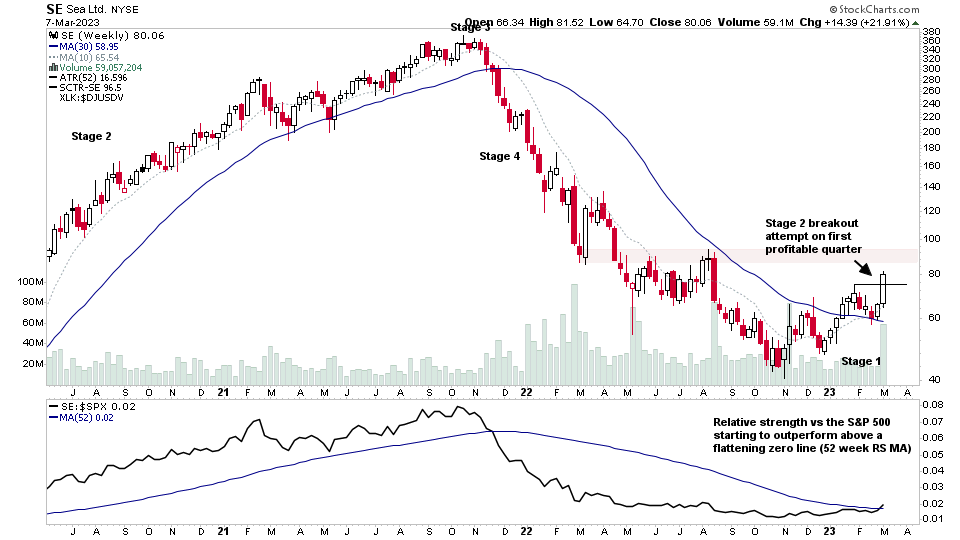
Stage 2 Breakout Attempt in SE and the US Stocks Watchlist – 8 March 2023
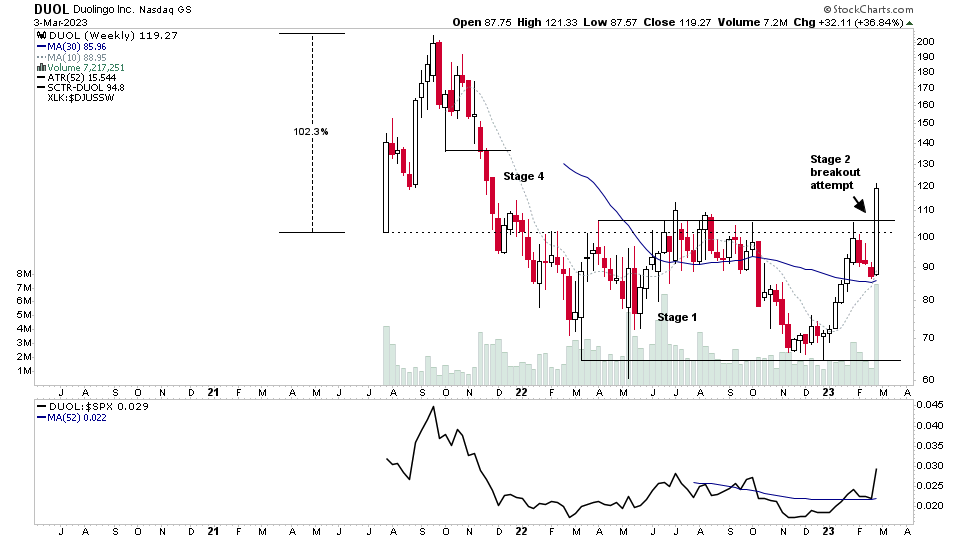
SE (Sea Ltd) is in focus today with a strong Stage 2 breakout attempt following earnings results before the open, in which it had its first profitable quarter, which was a significant surprise over the analyst estimates, and so is a potential change of character for the stock...
Read More
06 March, 2023
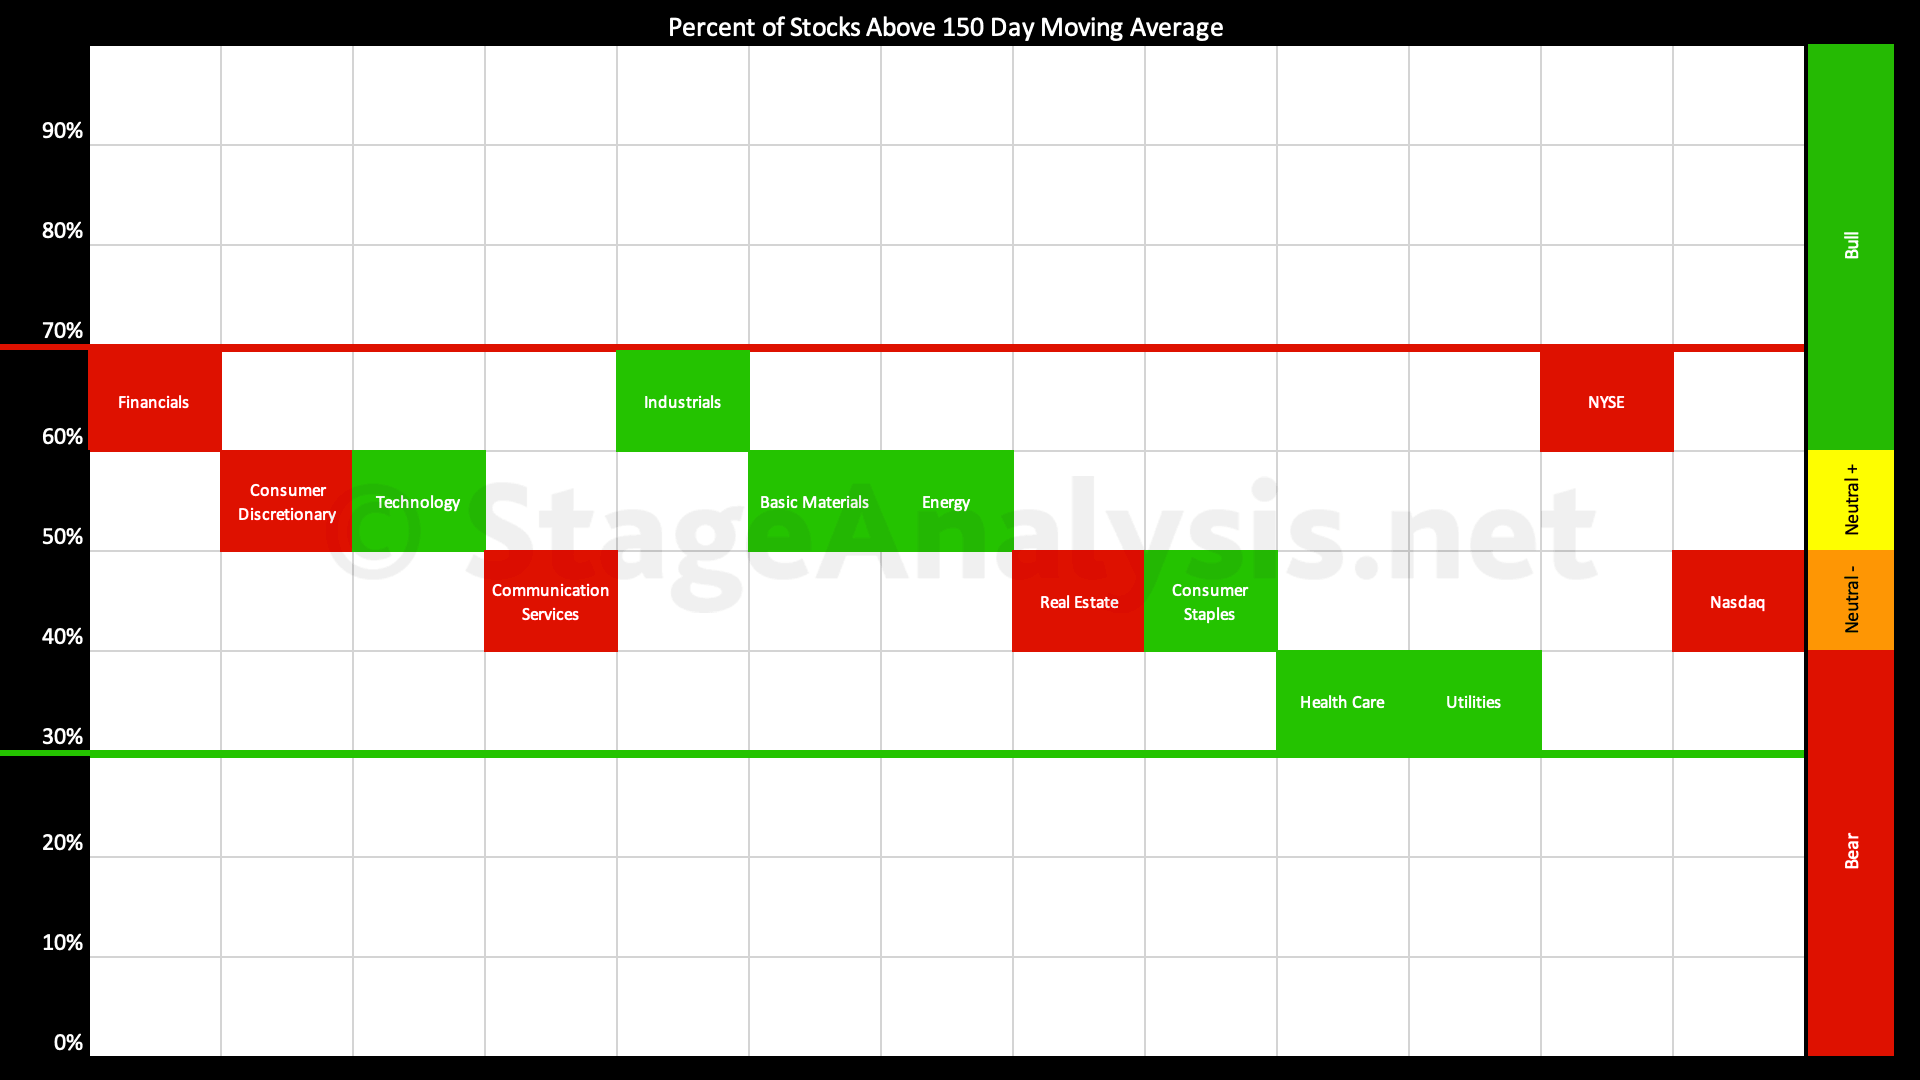
Sector Breadth: Percentage of US Stocks Above Their 150 day (30 Week) Moving Averages
The Percentage of US Stocks Above Their 150 day Moving Averages in the 11 major sectors has pulled back since the previous post, decreasing by -9.22% to 51.19% overall, which moves it back into the middle of the range, which is the neutral zone.
Read More
06 March, 2023
IBD Industry Groups Bell Curve – Bullish Percent
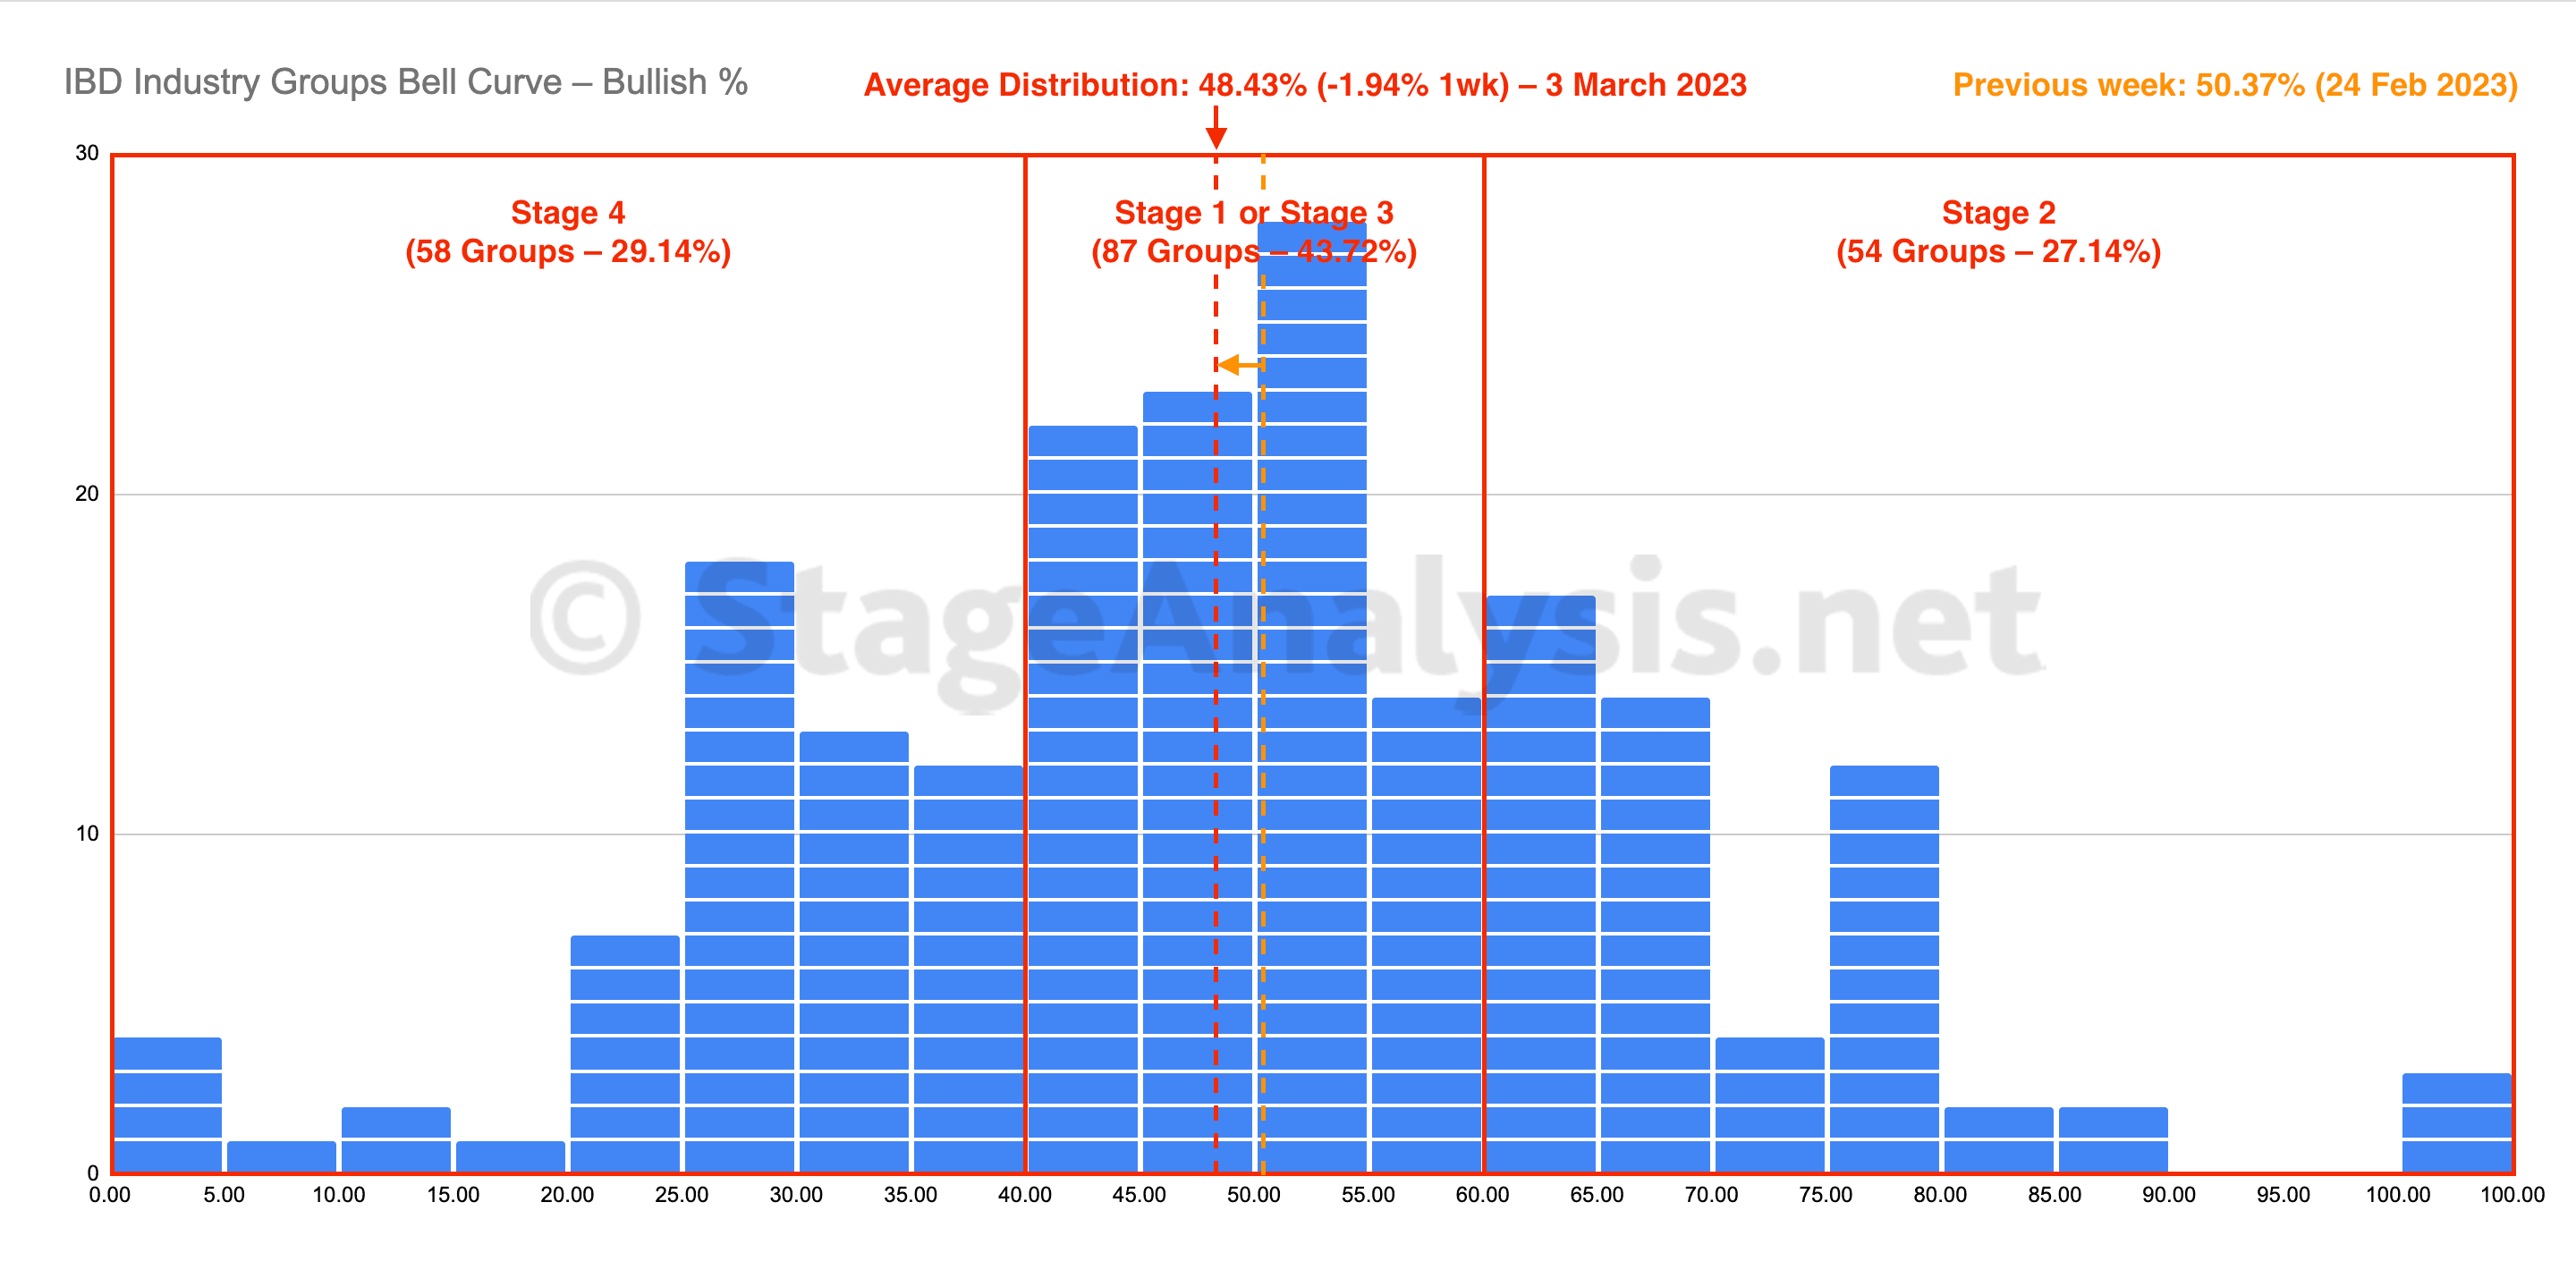
The IBD Industry Groups Bell Curve declined for a fourth week, losing -1.94% to finish at 48.43% overall. The amount of groups in Stage 4 was increased by 8 (+4%), and the amount of groups in Stage 2 decreased by 1 (-0.5%), while the amount groups in Stage 1 or Stage 3 decreased by 8 (-4%).
Read More
05 March, 2023
Stage Analysis Members Video – 5 March 2023 (1hr 4mins)
The Stage Analysis members weekend video with the major US Indexes, futures charts, US Industry Groups RS Rankings, the Market Breadth Update to help to determine the Weight of Evidence and discussion of some the recent breakouts and stocks in Stage 2.
Read More

