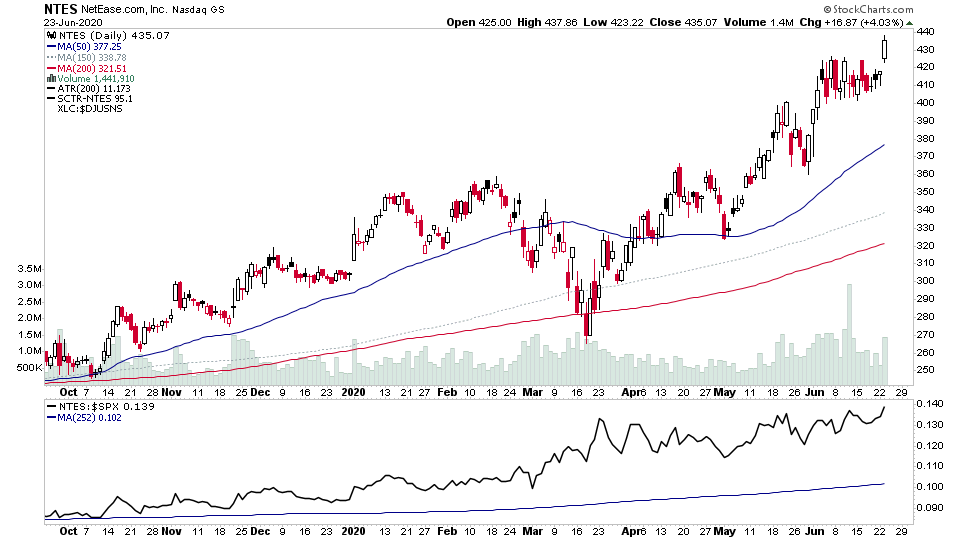
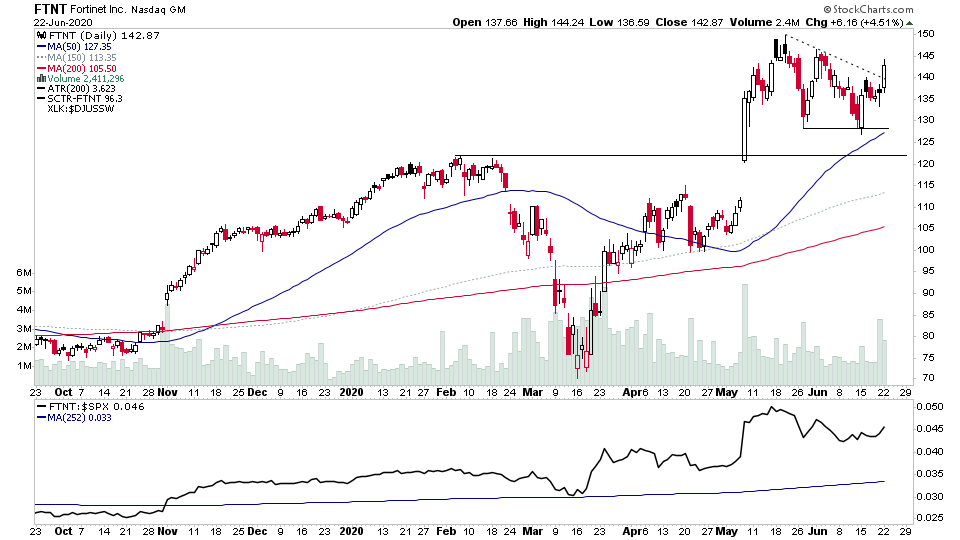
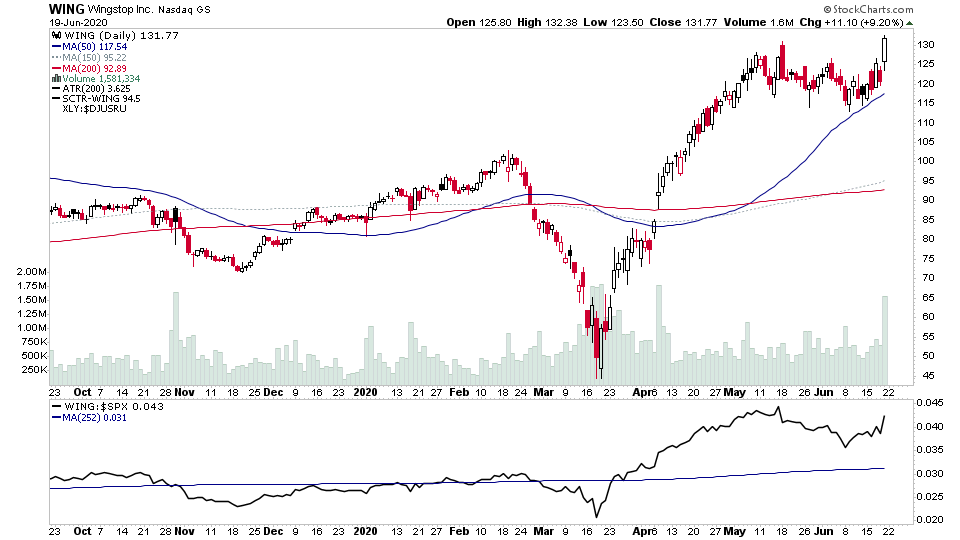
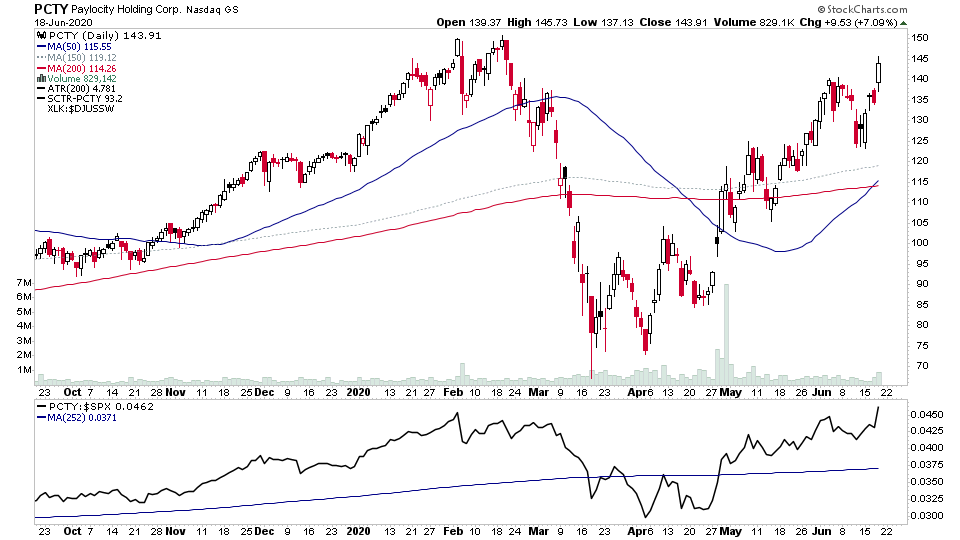
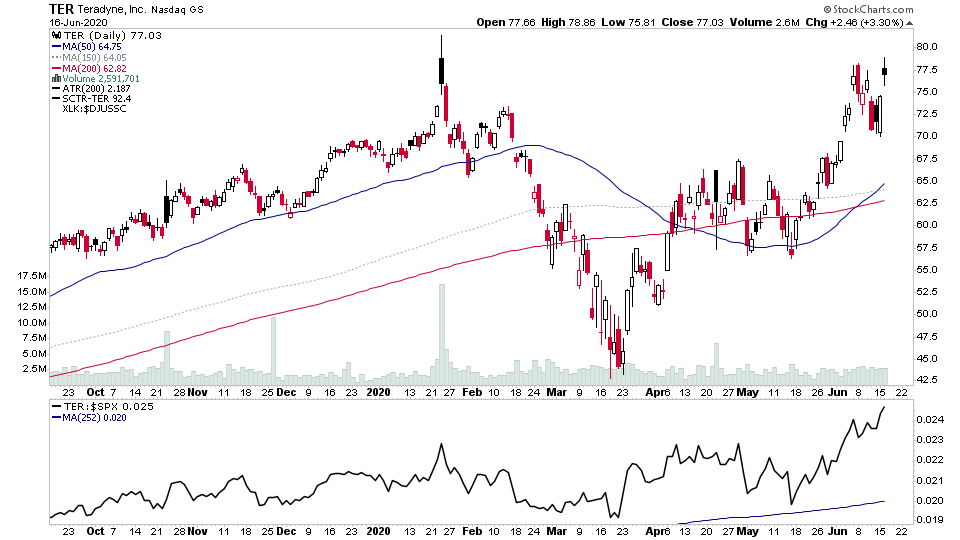
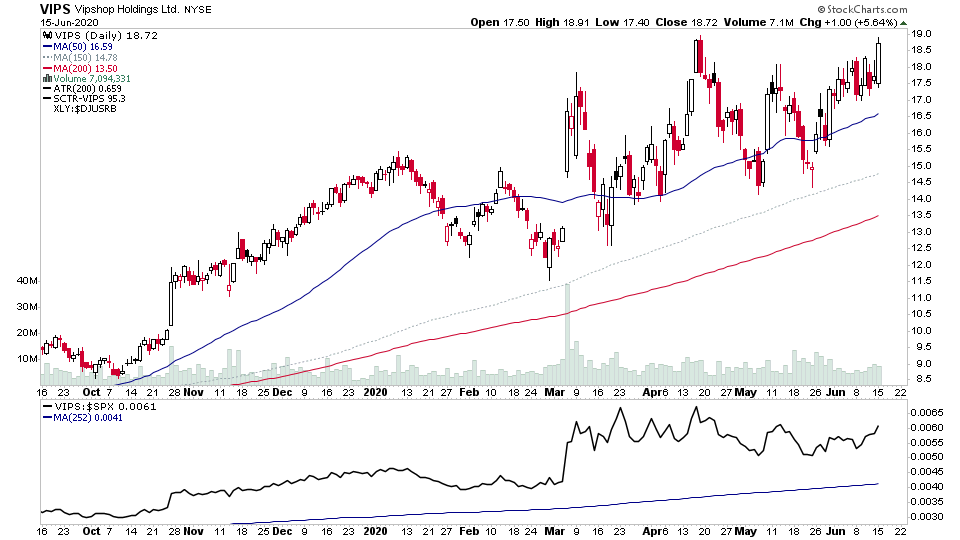
I saw a lot of nervousness on the twitter feed today, with people talking about pullbacks. But from my perspective we've just had one, as we saw a -6.7% pullback in the Nasdaq over the last few weeks and then made a new high today. So until the breakouts start failing again the short term trend remains up, and today saw seven big name stocks including four of the FAANG stocks attempting to breakout again, although they all closed fairly weakly.
Read More
Blog
23 June, 2020
US Breakout Stocks Watchlist - 23 June 2020
22 June, 2020
US Breakout Stocks Watchlist - 22 June 2020
Another strong list today with multiple stocks at or near to actionable levels. A few standouts from tonights list are FTNT*, BOX, GDDY, MSFT
Read More
21 June, 2020
US Breakout Stocks Watchlist - 21 June 2020
This weekends scans produced a fairly big list, with a few near actionable points. The bulk of the weekends watchlist picks look to be in the health care and biotechnology sectors though.
Read More
18 June, 2020
US Breakout Stocks Watchlist - 18 June 2020
For the watchlist from Thursdays scans - ABM, AYX, EDIT, HEAR, MTCH, NBIX, NDAQ, PAYC, PCTY, PZZA, SEDG, TMUS
Read More
17 June, 2020
US Breakout Stocks Watchlist - 17 June 2020
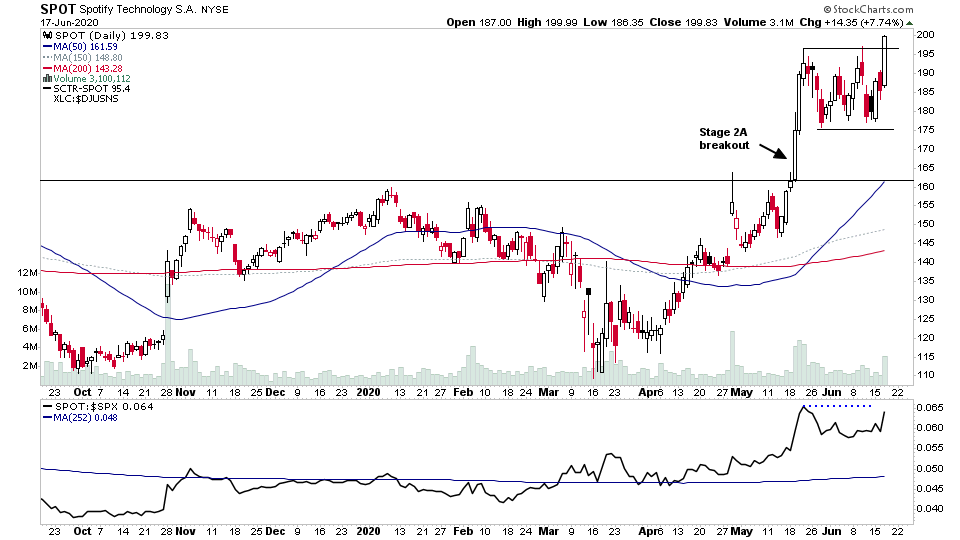
For the watchlist from Wednesdays scans - AJG, ATVI, DADA, NFLX, NVDA, SNE, SPOT
Read More
16 June, 2020
US Breakout Stocks Watchlist - 16 June 2020
Another one of those days where the market was gapped up on the open, and then spent the majority of the day going lower.
Read More
15 June, 2020
US Breakout Stocks Watchlist - 15 June 2020
There were a few charts of interest today which I posted on my twitter page: twitter.com/stageanalysis including the VIX and some more fun with google sheets, which I've been experiementing with recently, as you can get free stock data that automatically updates with a 20 min delay. So i've set up my entire trade spreadsheet on their now so that I can see the portfolio updates automatically, and have included volume, average volume etc, which is really useful info to have intraday in a spreadsheet.
Read More
14 June, 2020
US Breakout Stocks Watchlist - 14 June 2020
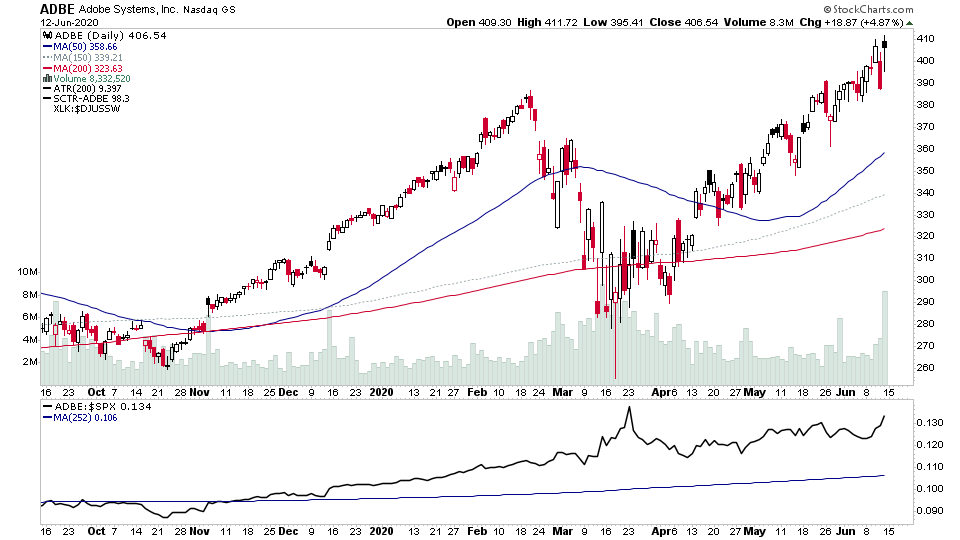
Only a couple for the watchlist from the weekend scans - ADBE, CCXI
Read More
14 June, 2020
US Stock Market. Bullish Percent Index to Bear Alert Status. What does the Weight of Evidence Say?
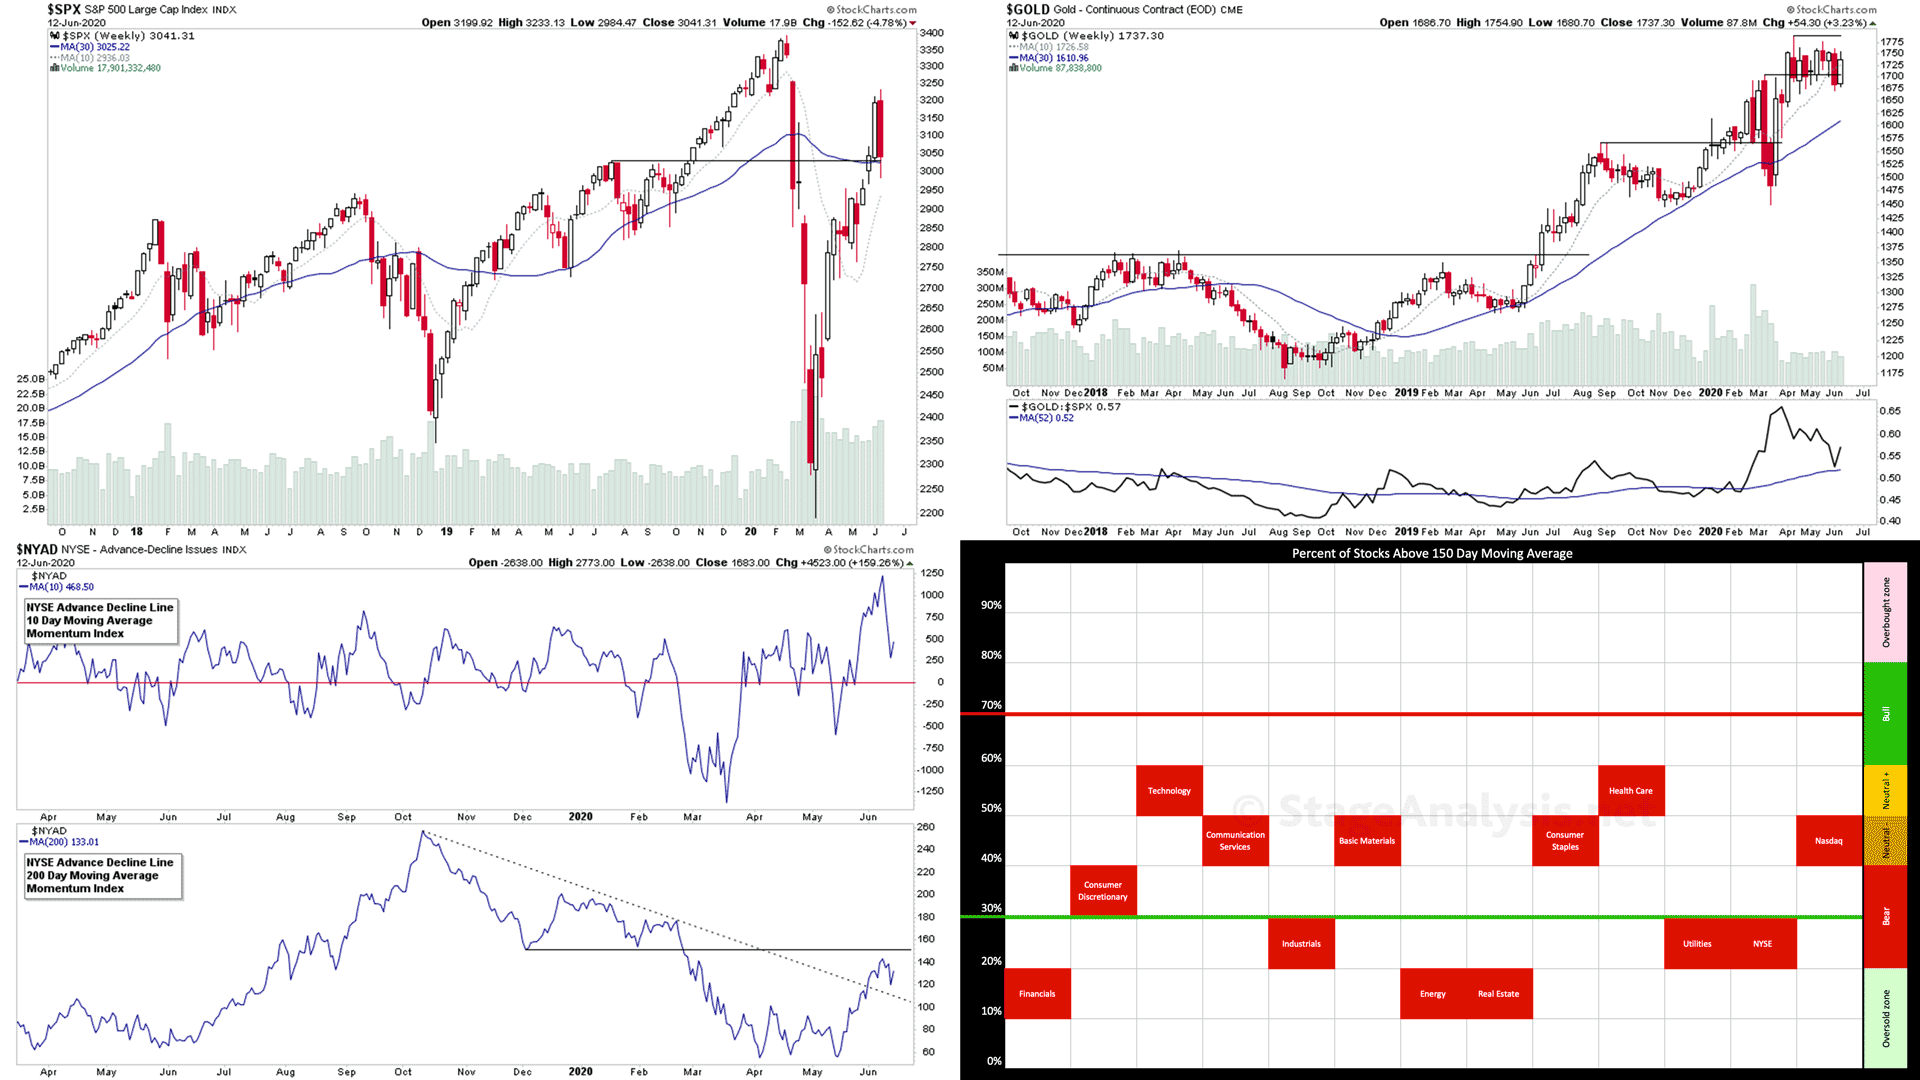
Weekend update of the major US stock market indexes and indicators. A weekly look beneath the surface of the US stock market, featuring the key market breadth charts for timing trading stocks and the stock market indexes, such as the NYSE Bullish Percent Index, the Advance Decline Line, the New Highs - New Lows etc and some custom breadth indicators of my own in order to determine what the "Weight of Evidence" is suggesting in terms of the US stock market direction and how to allocate your money.
Read More
11 June, 2020
US Breakout Stocks Watchlist - 11 June 2020
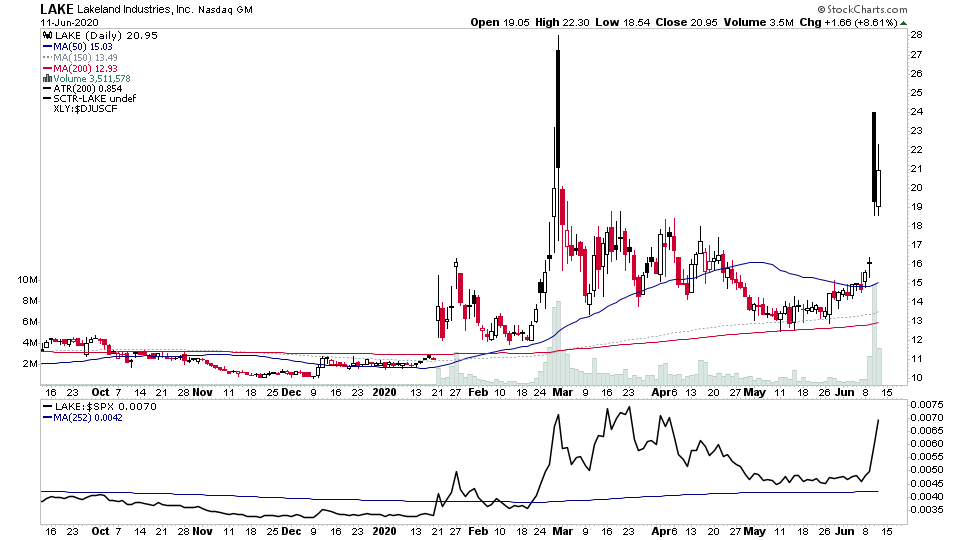
LAKE is the only addition to the watchlist tonight after a heavy down down across the board.
Read More

