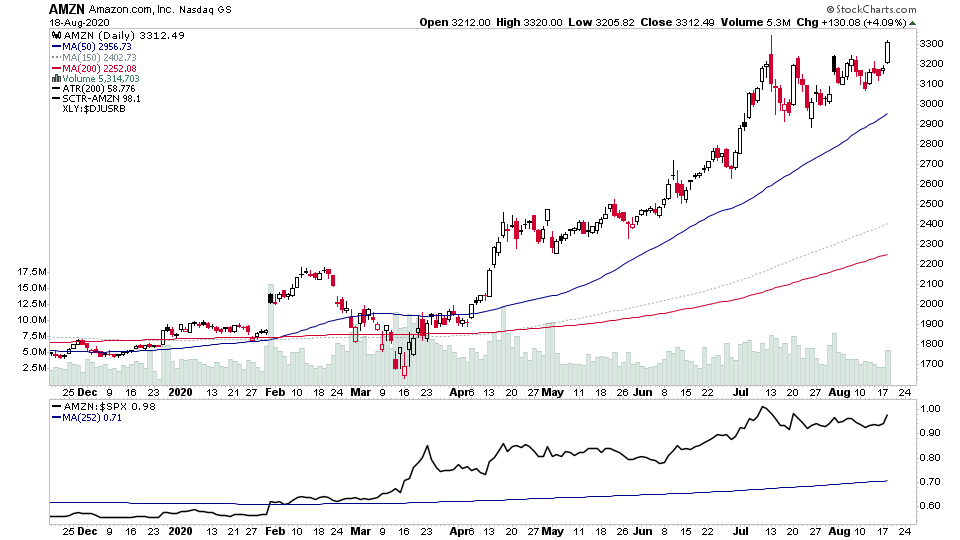
For the watchlist from Tuesdays scans - ADBE, AEYE, AJG, AMZN, BILI, CRM, CRSP, EVTC, GOOG, LPSN, NFLX, NTES, NVTA, OKTA, PDD, PTON, SPWR, ZM
Read More
Blog
18 August, 2020
US Breakout Stocks Watchlist - 18 August 2020
17 August, 2020
US Breakout Stocks Watchlist - 17 August 2020
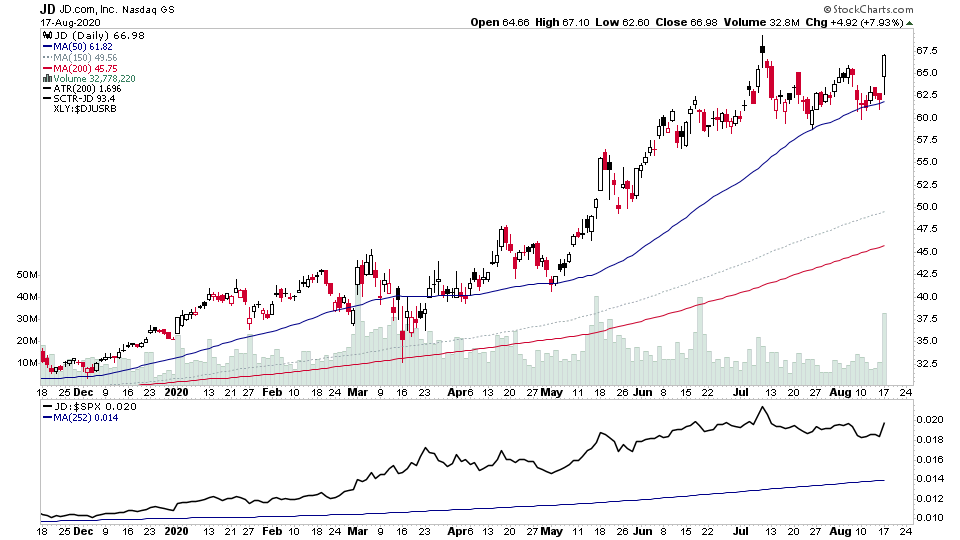
I was cautious going into today with the lack of breakouts in the weekend scans. But the market came back to life again and we have numerous stocks for the watchlist tonight. Plus a group move with multiple homebuilders attempting to breakout.
Read More
16 August, 2020
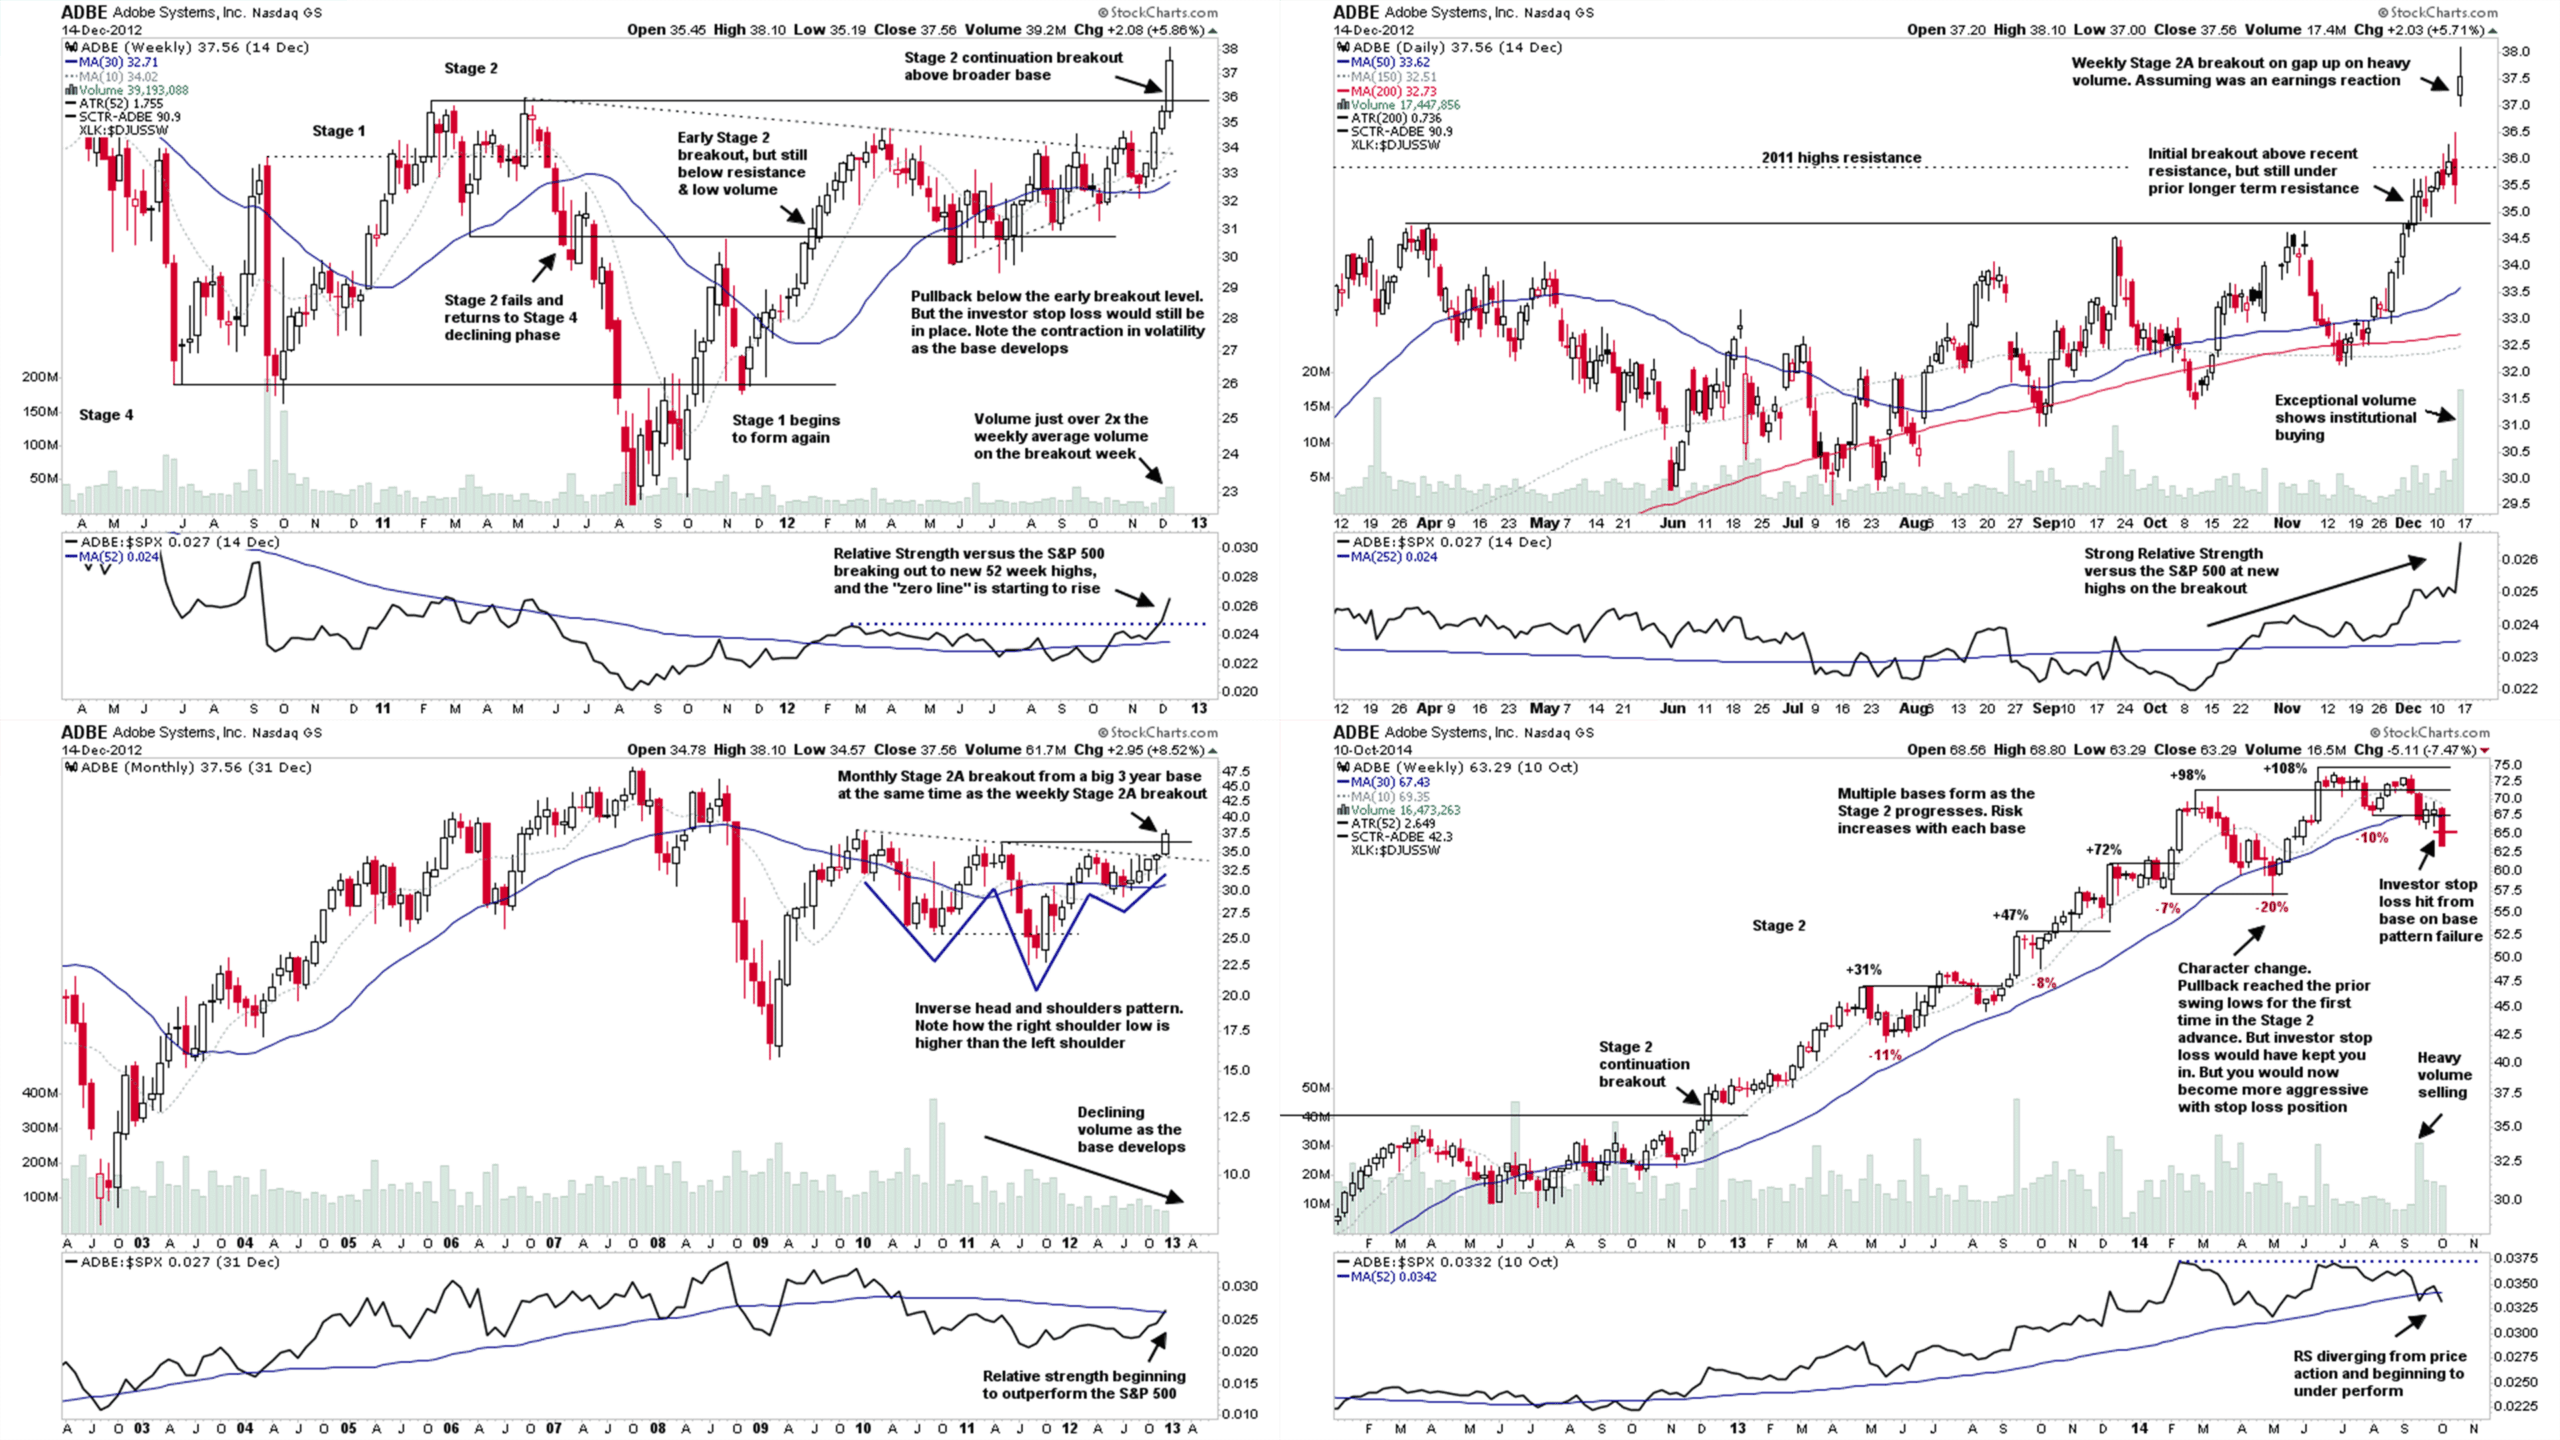
MODEL STOCKS #1 – Historical Multi-Timeframe Stage Analysis of the $ADBE 2012-2014 Stage 2 Advancing Phase
First video of a new series studying past leaders Stage 2 advances
Read More
13 August, 2020
US Breakout Stocks Watchlist - 13 August 2020
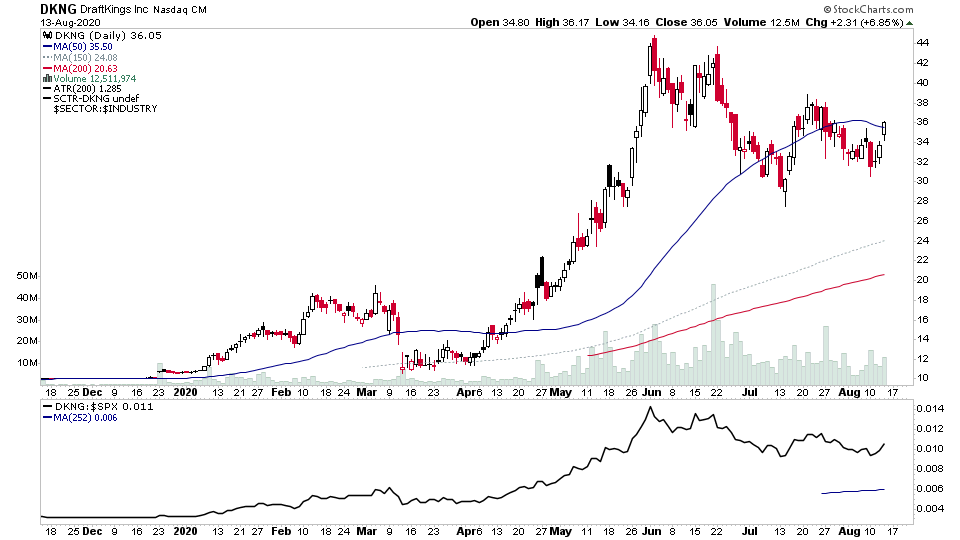
For the watchlist from Thursdays scans - APD, BE, CDLX, CGNX, CMG, CSIQ, DKNG, FND, GRMN, HALO, HUBS, KLAC, NSTG
Read More
12 August, 2020
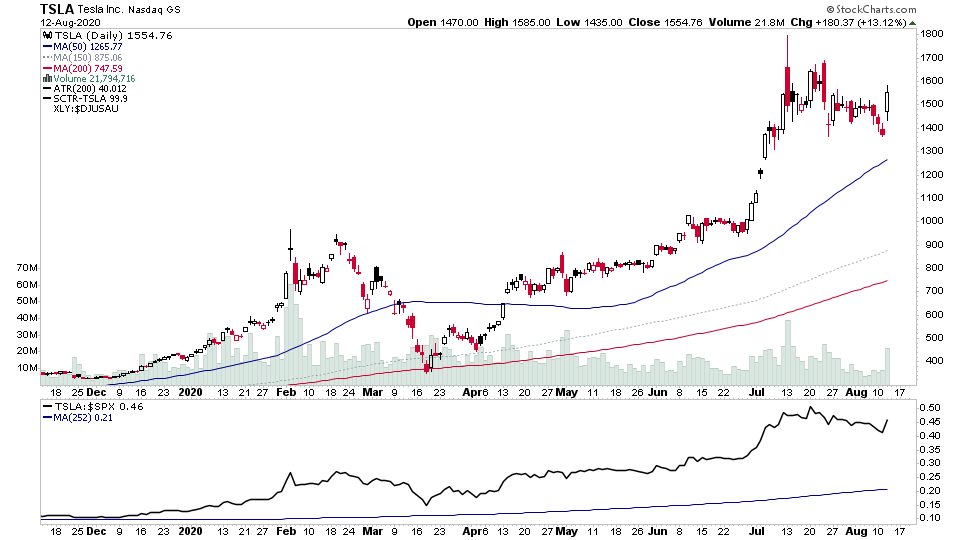
US Breakout Stocks Watchlist - 12 August 2020
An interesting mix tonight with stocks from a broad range of sectors in the watchlist...
Read More
11 August, 2020
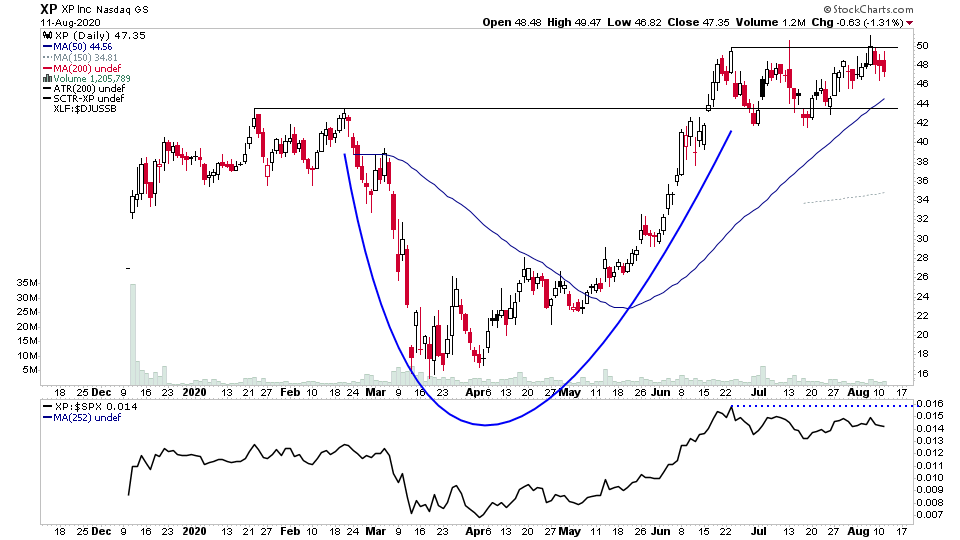
US Breakout Stocks Watchlist - 11 August 2020
For the watchlist from Tuesdays scans - ALB, APEI, AVYA, ETFC, FTV, GGG, SPOT, XP, V
Read More
10 August, 2020
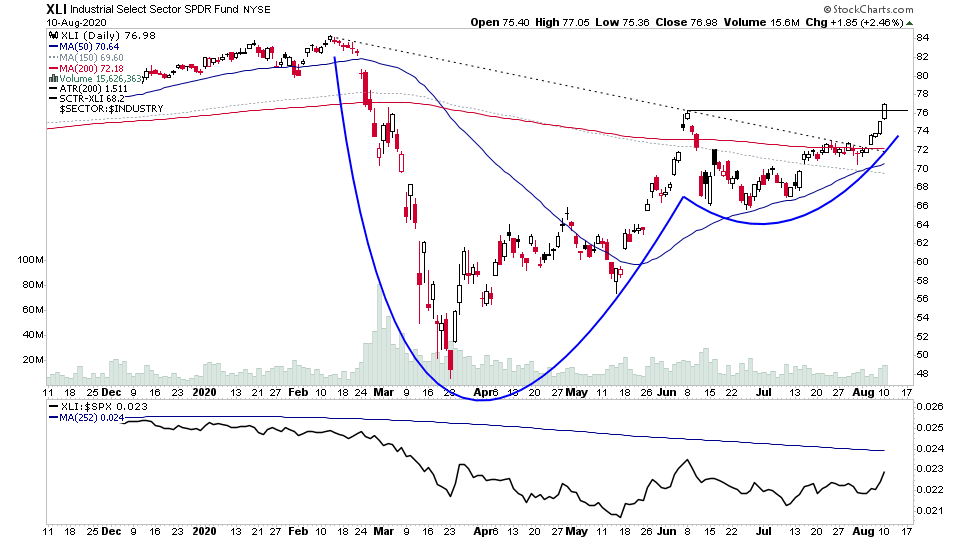
US Breakout Stocks Watchlist - 10 August 2020
The Industrials sector is attempting to move into early Stage 2A with todays breakout above the pivot, and unsurprisingly the watchlist is dominated with industrial names today...
Read More
09 August, 2020
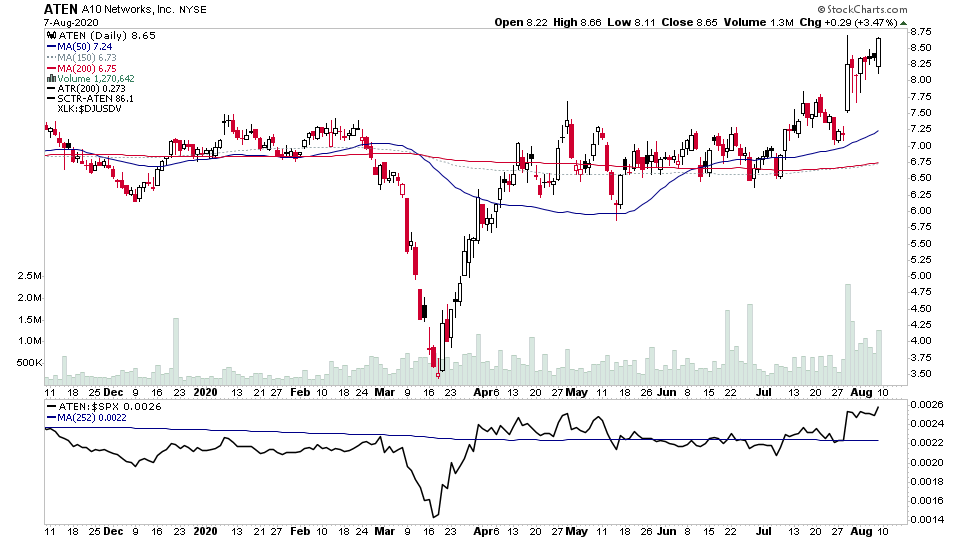
US Breakout Stocks Watchlist - 8 August 2020
For the watchlist from the weekend scans - ALC, AMZN, ATEC, ATEN, CSIQ, FSLR, SWI, ZM
Read More
06 August, 2020
US Breakout Stocks Watchlist - 6 August 2020
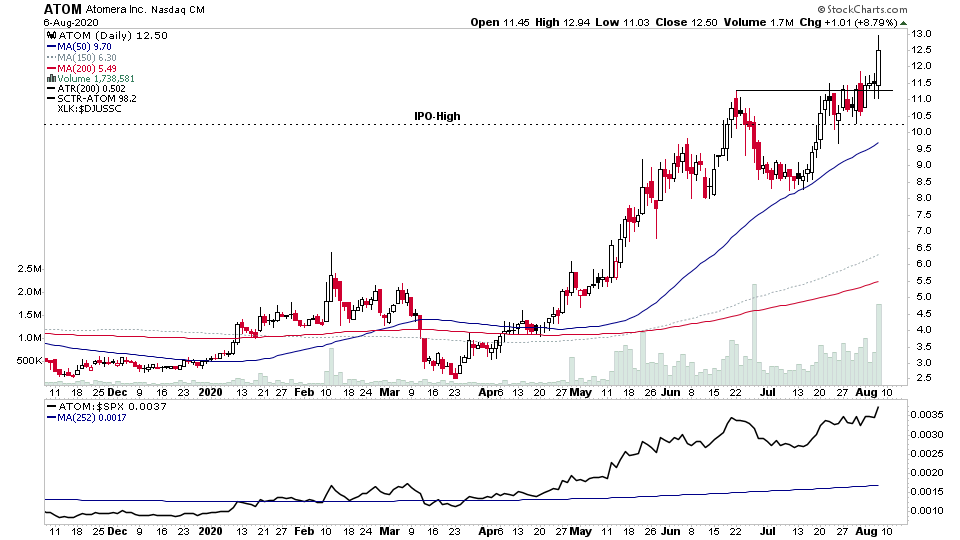
For the watchlist from Thursdays scans - ADBE, APPS, ARLO, ATOM, CENX, EDIT, FB, GMED, GOOG, HUBS, LPSN, MAXR, PENN, TRI, TRMB
Read More
05 August, 2020
US Breakout Stocks Watchlist - 5 August 2020
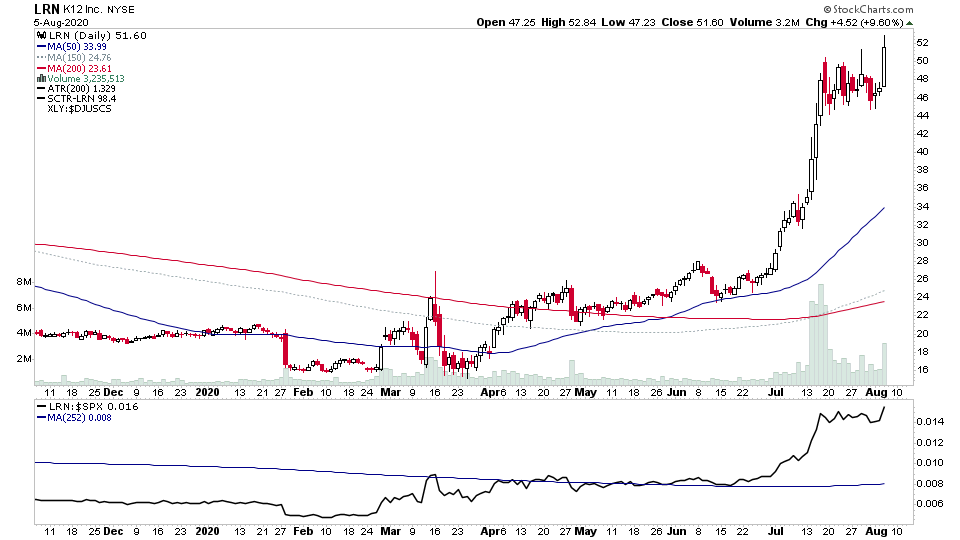
For the watchlist from Wednesdays scans - ALB, ALDX, ALTR, IMXI, LRN, LULU, MA, NTRA, SGRY, SQM, SY, TER
Read More

