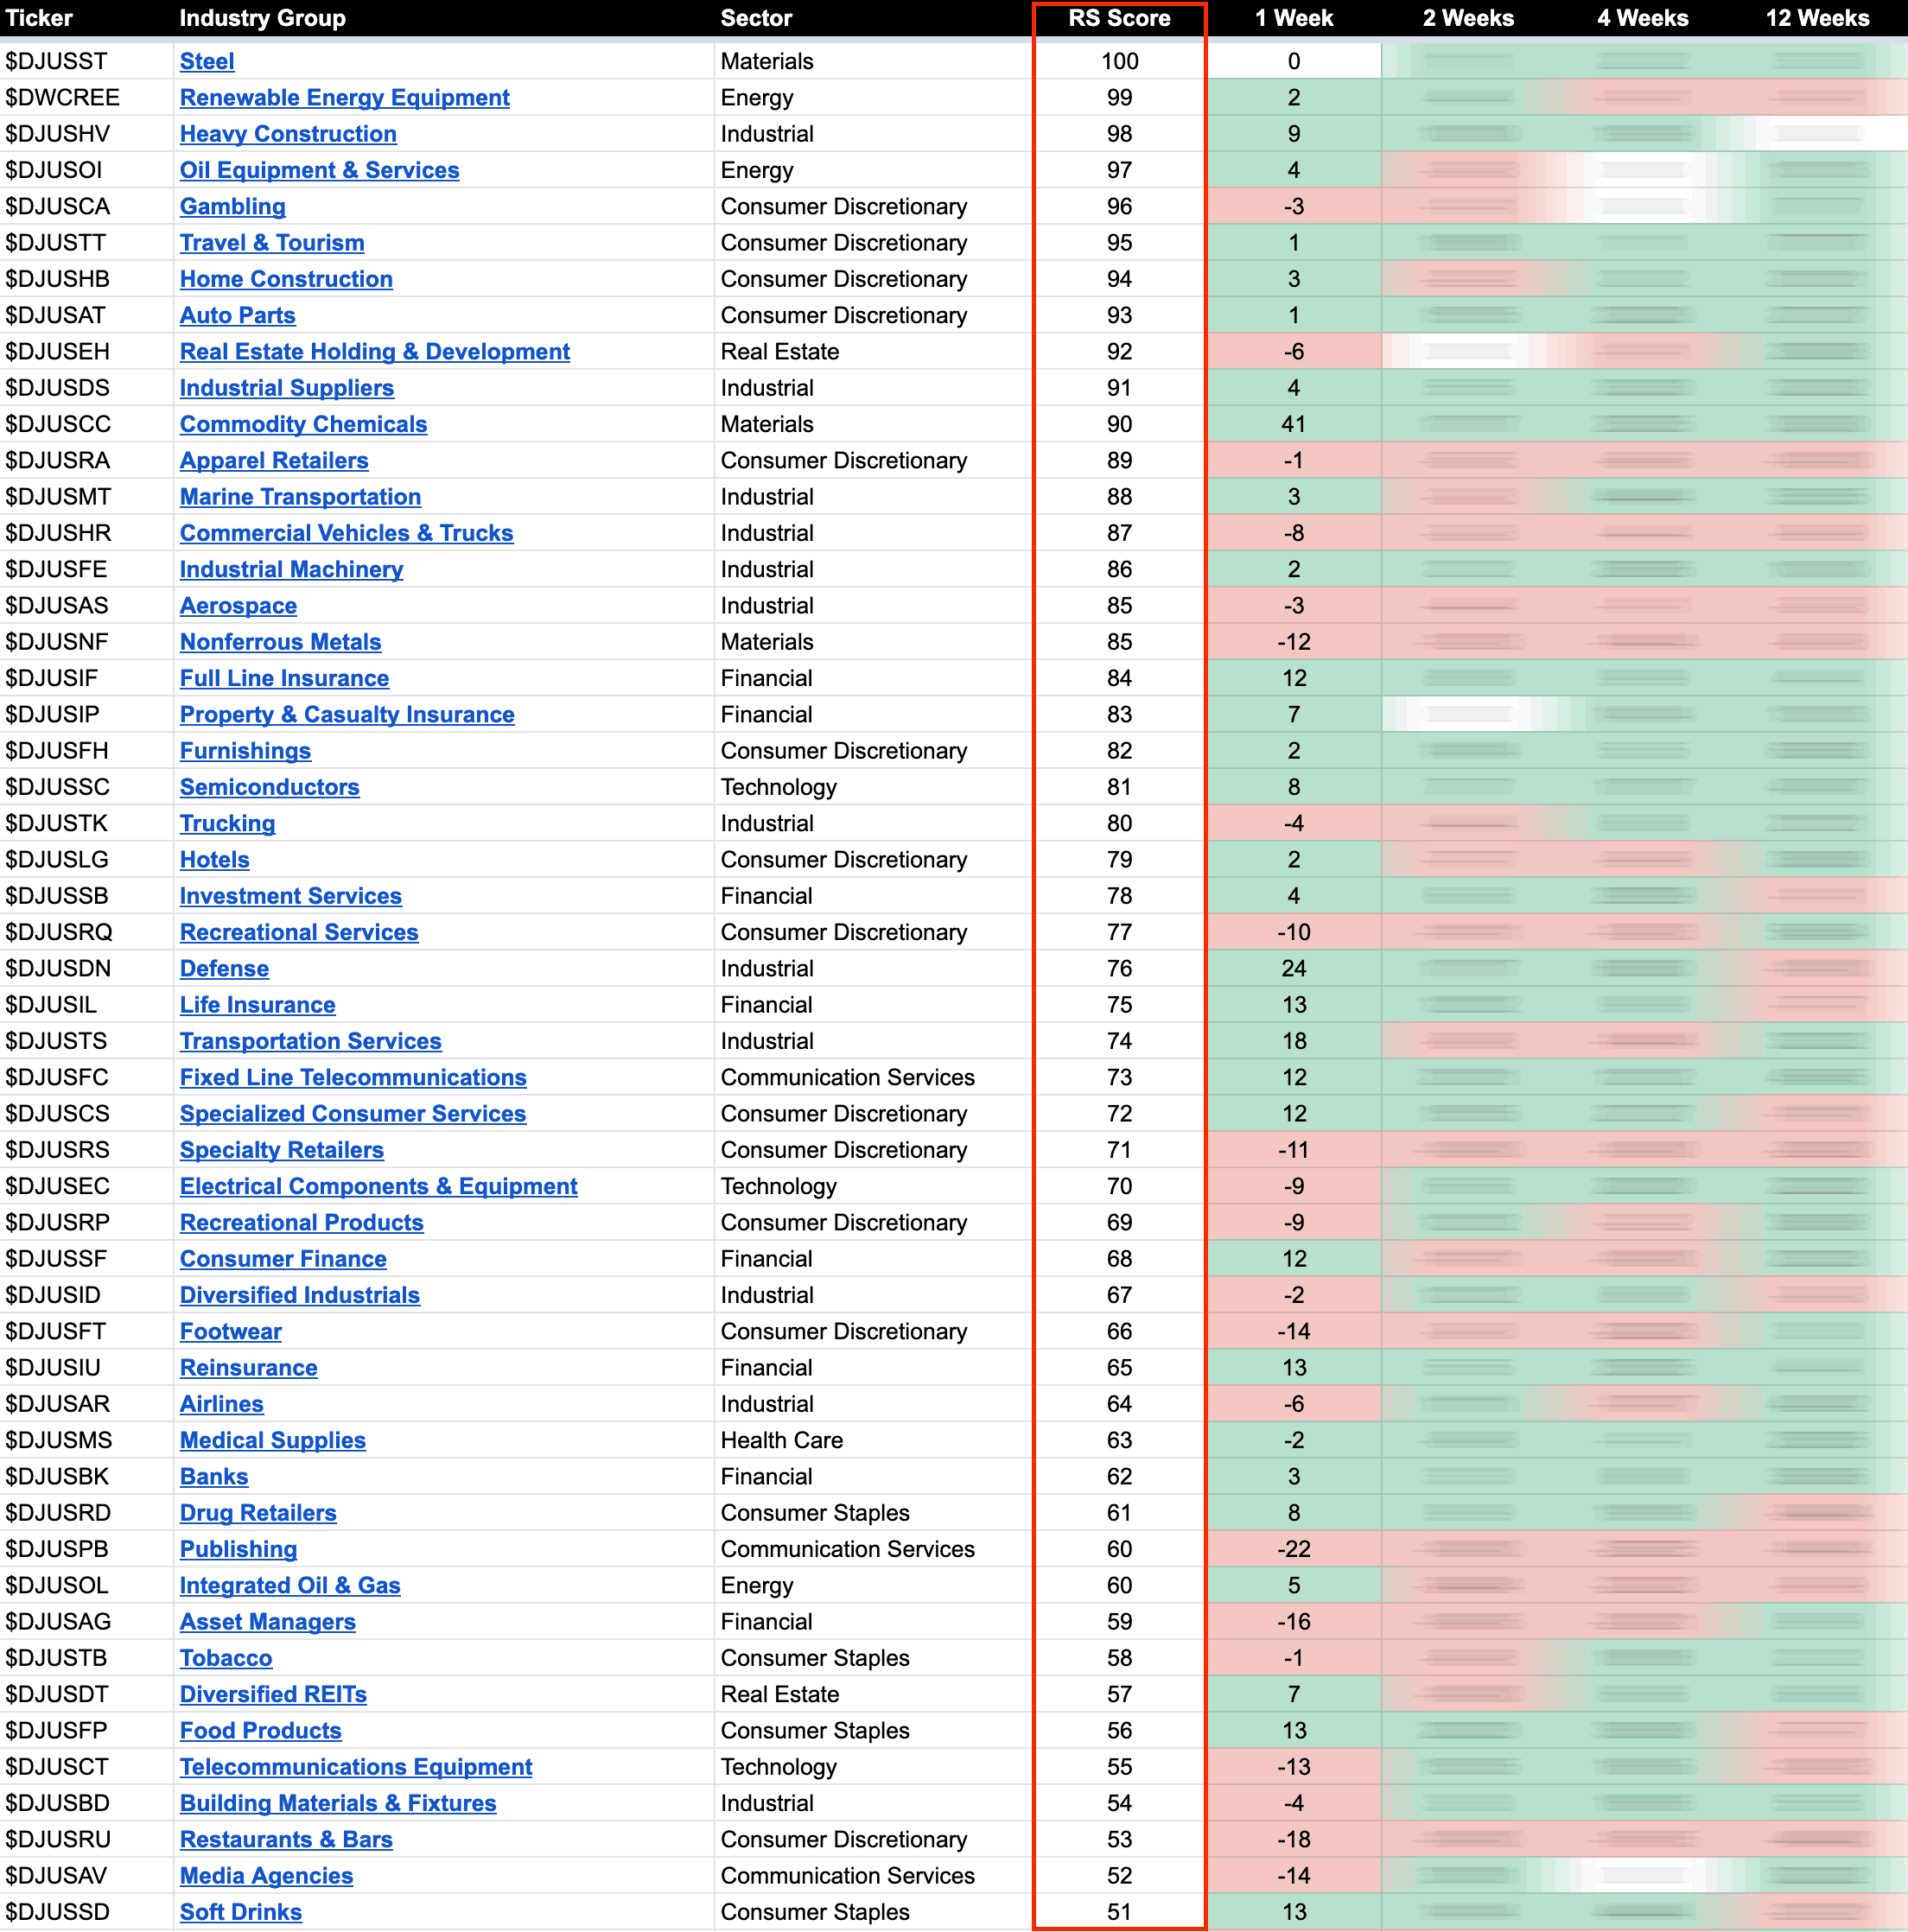
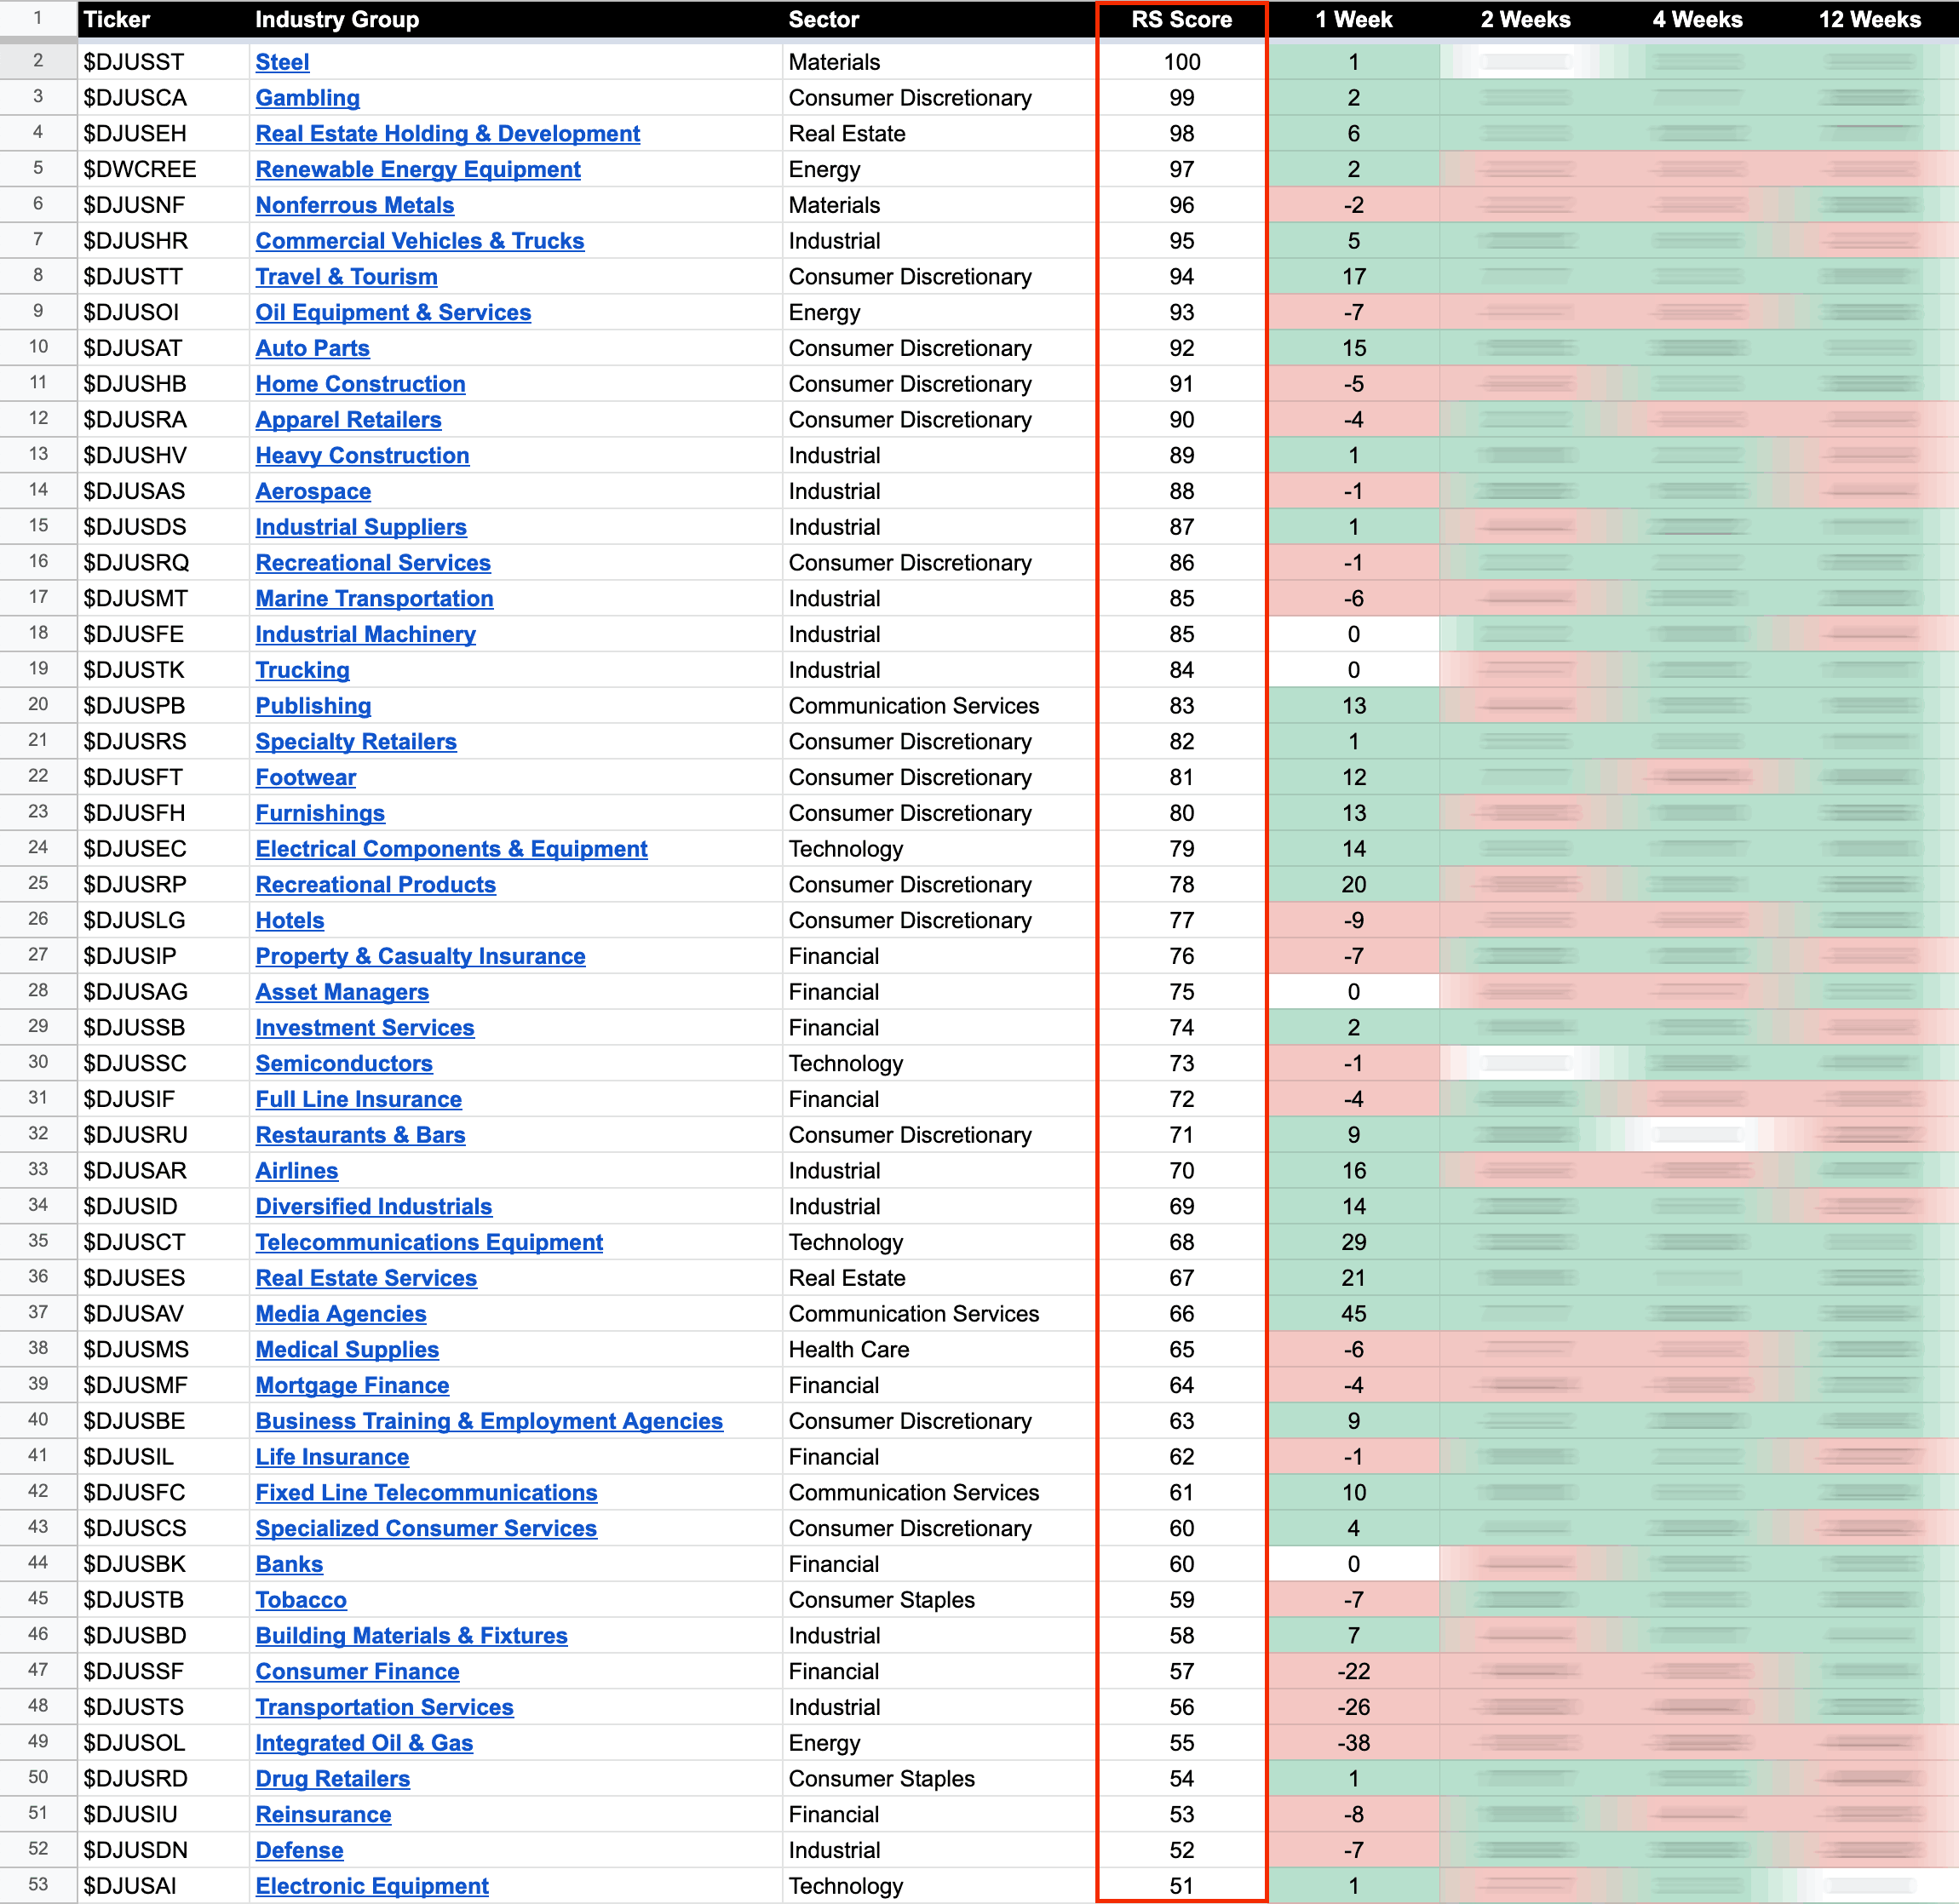
The purpose of the Relative Strength (RS) tables is to track the short, medium and long term RS changes of the individual groups to find the new leadership earlier than the crowd...
Read More
Blog
24 February, 2023
US Stocks Industry Groups Relative Strength Rankings
23 February, 2023
Stage Analysis Members Video – 23 February 2023 (51 mins)
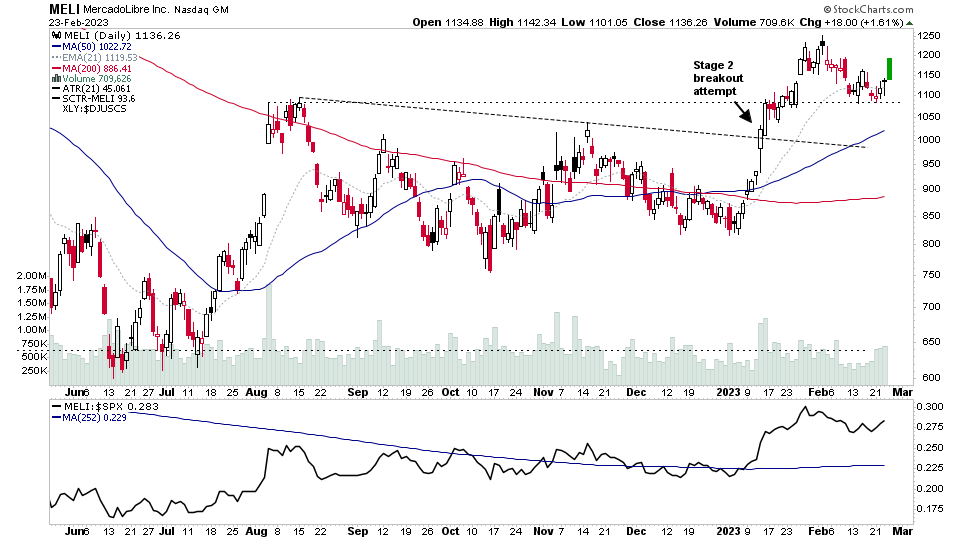
The Stage Analysis members midweek video discussing the US Watchlist Stocks from today and yesterdays post in more detail with live markups on multiple timeframes, plus a brief look at the S&P 500 and short-term market breadth indicators too...
Read More
22 February, 2023
US Stocks Watchlist – 22 February 2023
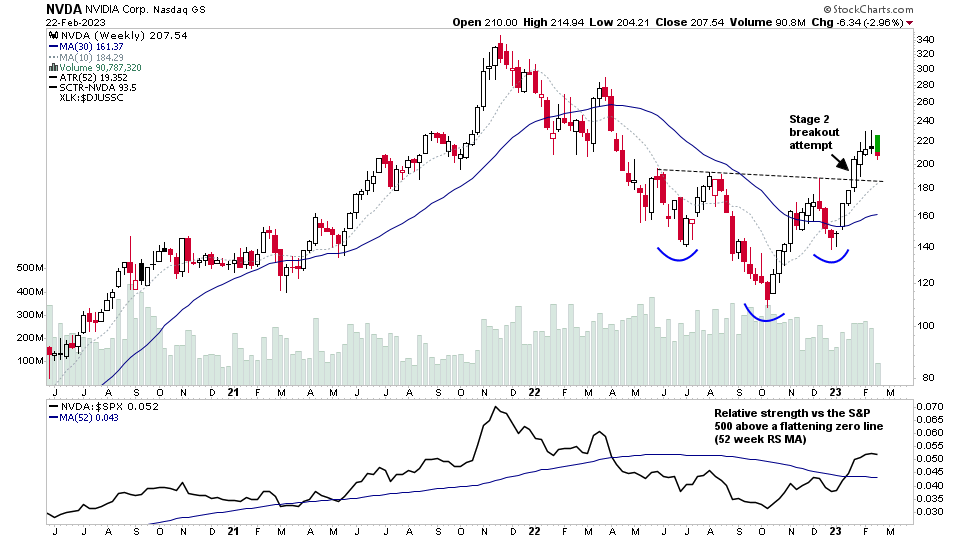
NVDA rebounded strongly in the after-hours trading session on earnings results, moving over +8%, which pushes it back towards the recent highs in its early Stage 2 advance. Which is a potential positive for the broader market breadth due to its size and influence as one of the mega cap stocks, and also the largest of the Semiconductor stocks...
Read More
21 February, 2023
Market Breadth: Average True Range – S&P 1500 Stocks
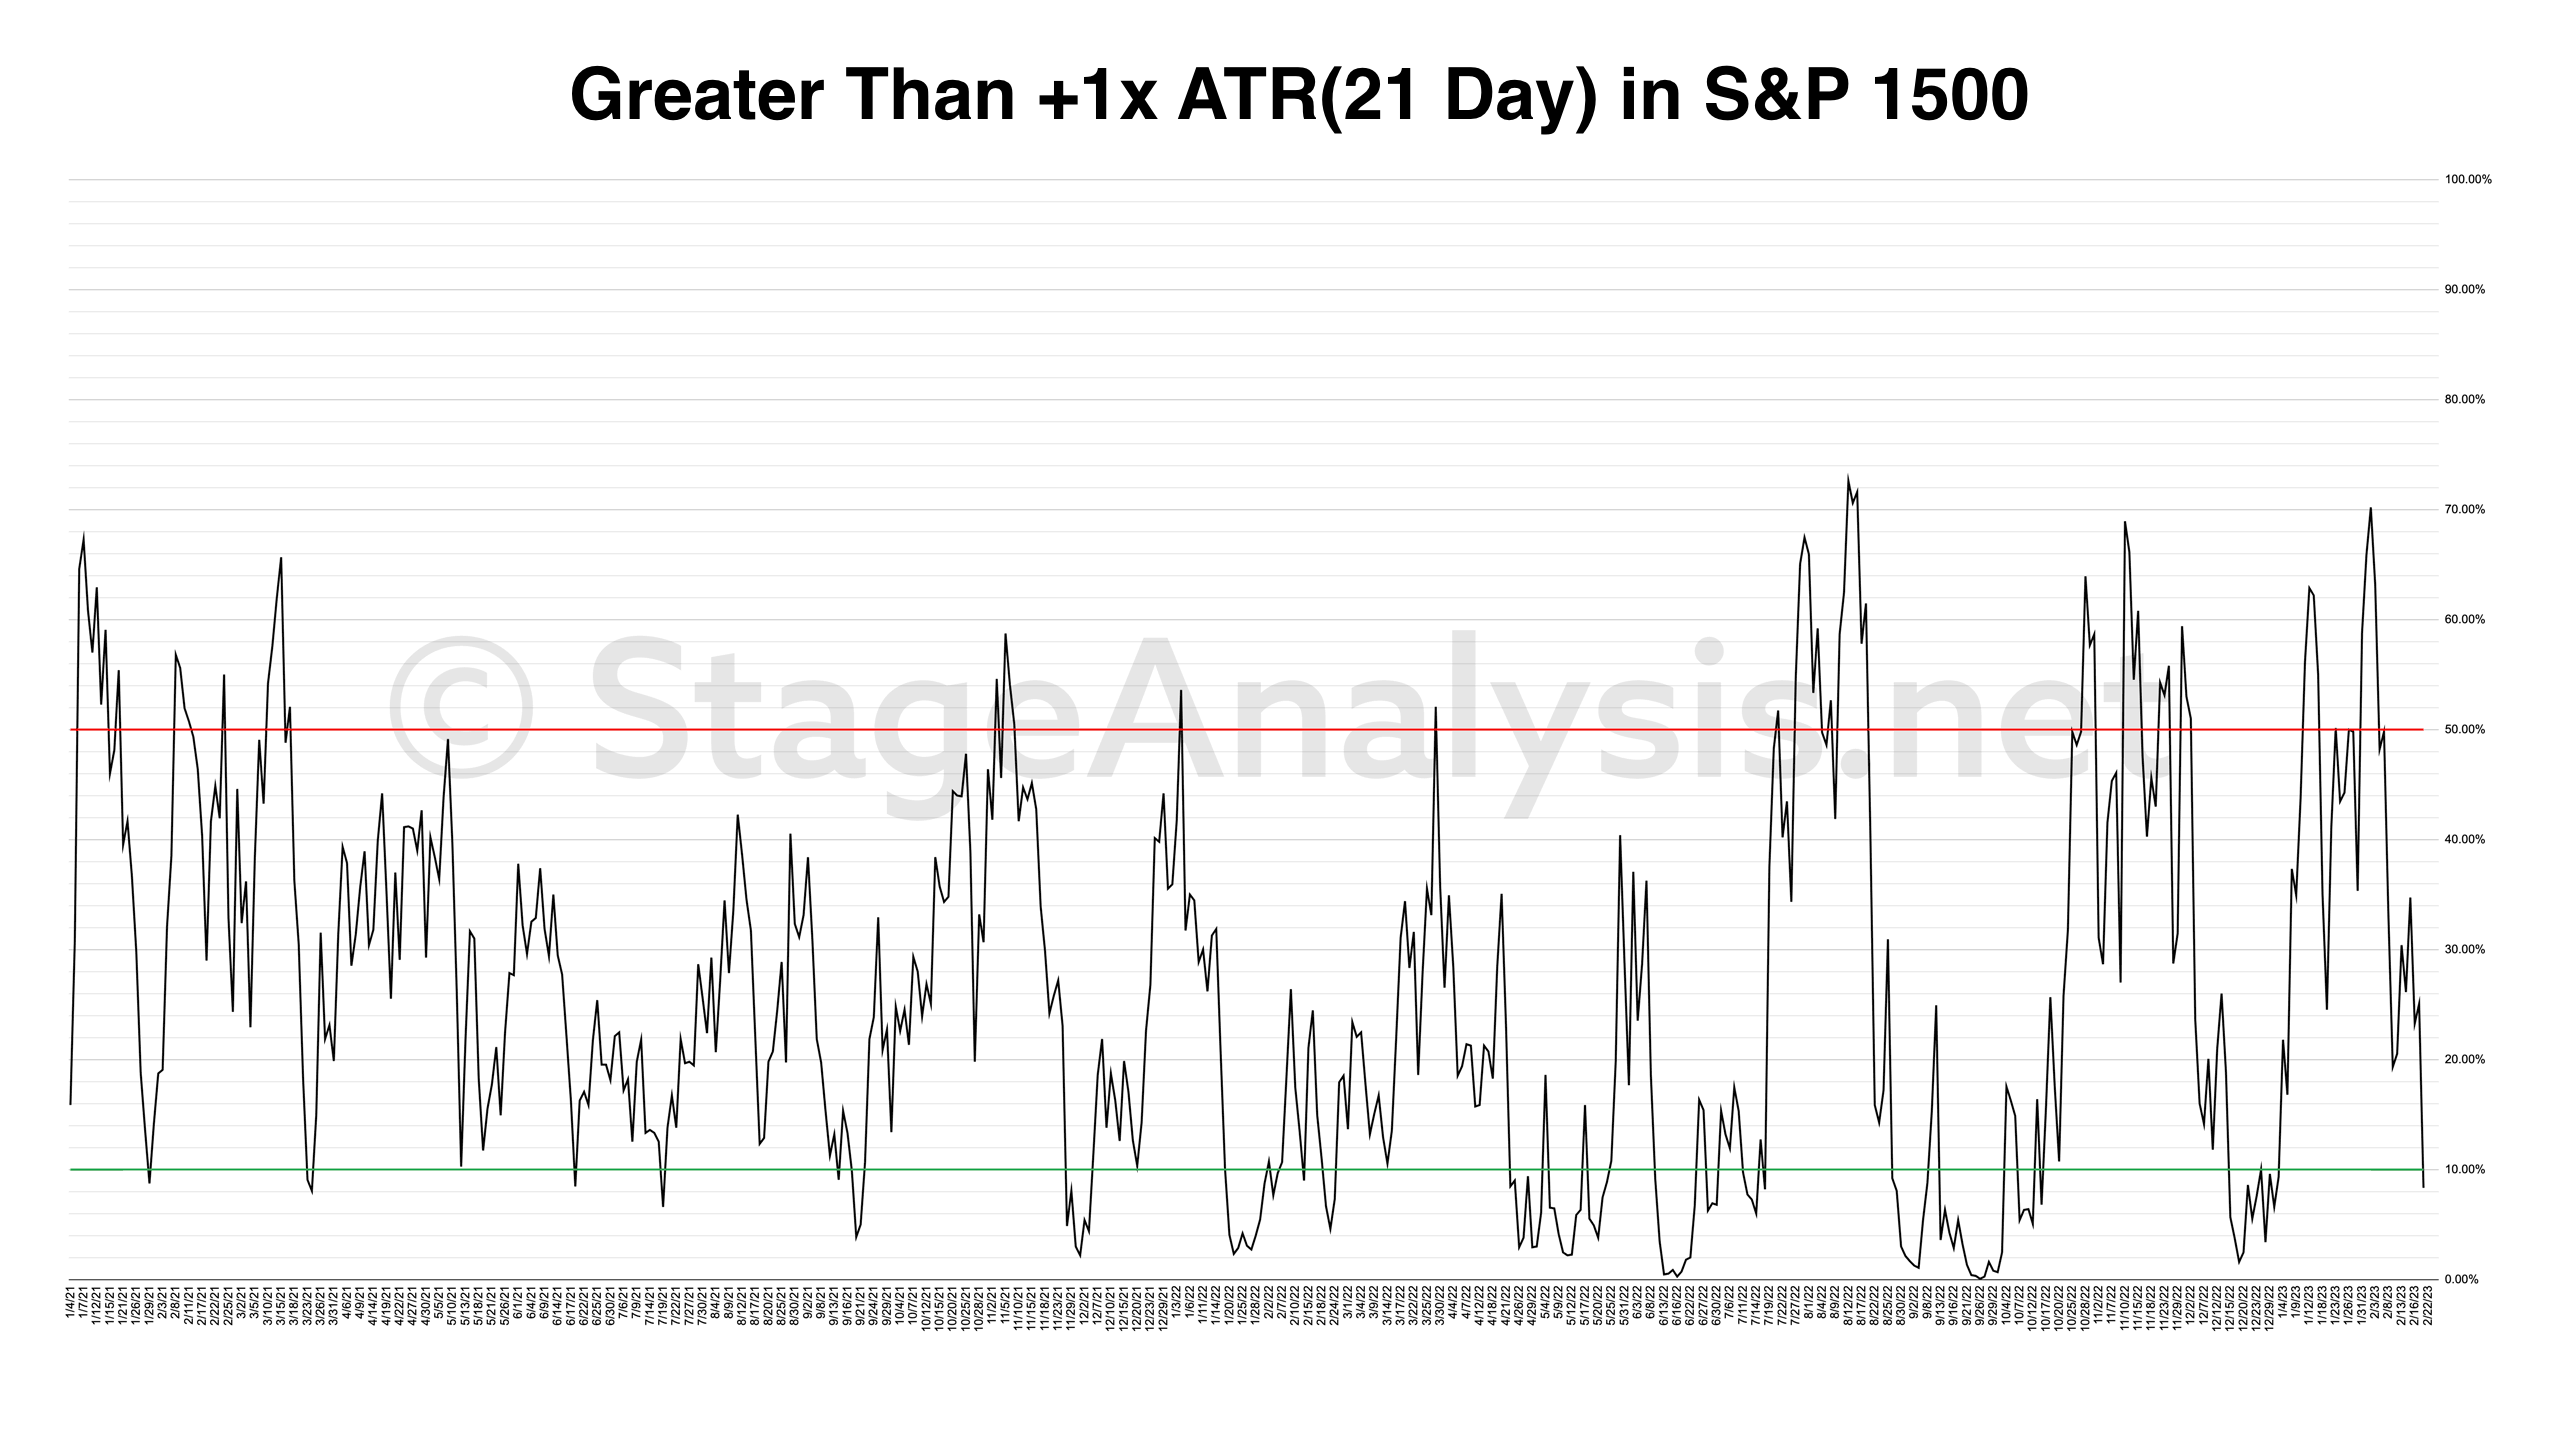
The 3x Average True Range (ATR) bands via the Keltner Channels indicator is a concept that I've been using for many years, since I first learned it from studying Alexander Elder's methods, as it can give a very useful guide for short-term trends, when stocks are extended from their normal range, it can even help with position sizing and stop loss positioning. So it can be very useful in multiple ways.
Read More
20 February, 2023
Stage Analysis Members Video – 20 February 2023 (1hr 34mins)
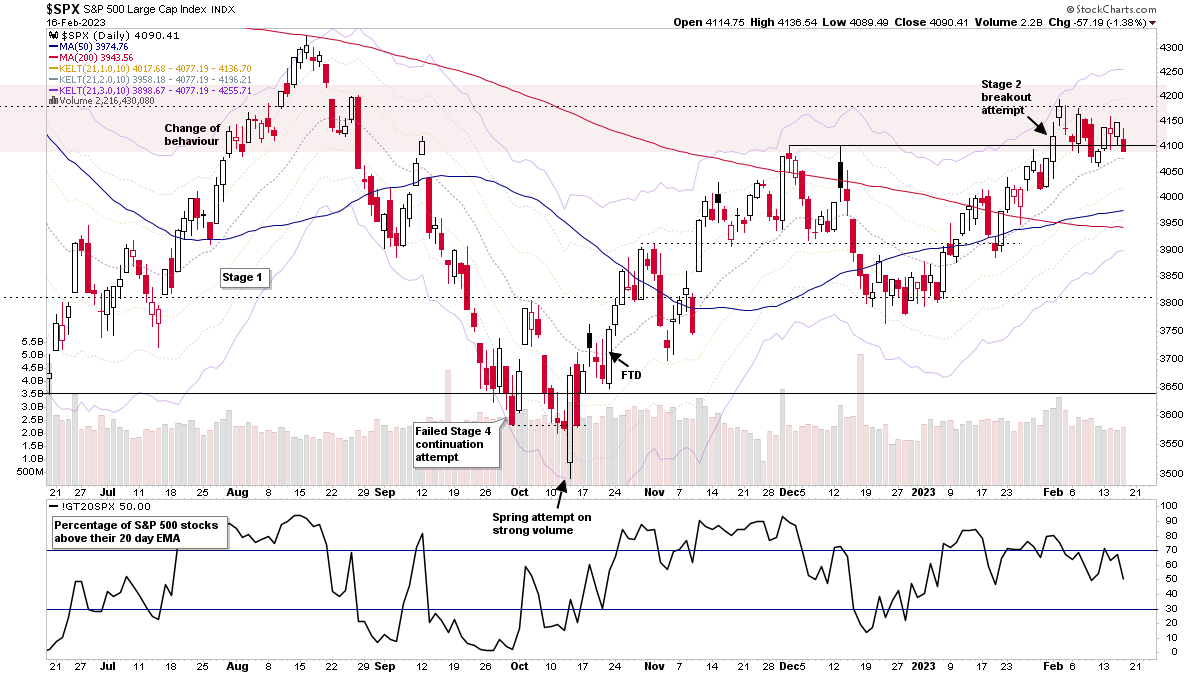
The Stage Analysis members weekend video featuring recent Stage 2 breakout attempts, the major US Indexes, the futures charts, US Industry Groups RS Rankings, IBD Industry Groups Bell Curve - Bullish Percent, the Market Breadth Update to help to determine the Weight of Evidence, the US Stocks Watchlist in detail on multiple timeframes and finishing with a look at the Stage Analysis of some of the major crypto coins, as a few attempt to move into early Stage 2 once more after huge Stage 4 declines in 2022.
Read More
19 February, 2023
US Stocks Watchlist – 19 February 2023
There were 30 stocks highlighted from the US stocks watchlist scans today...
Read More
18 February, 2023
IBD Industry Groups Bell Curve – Bullish Percent
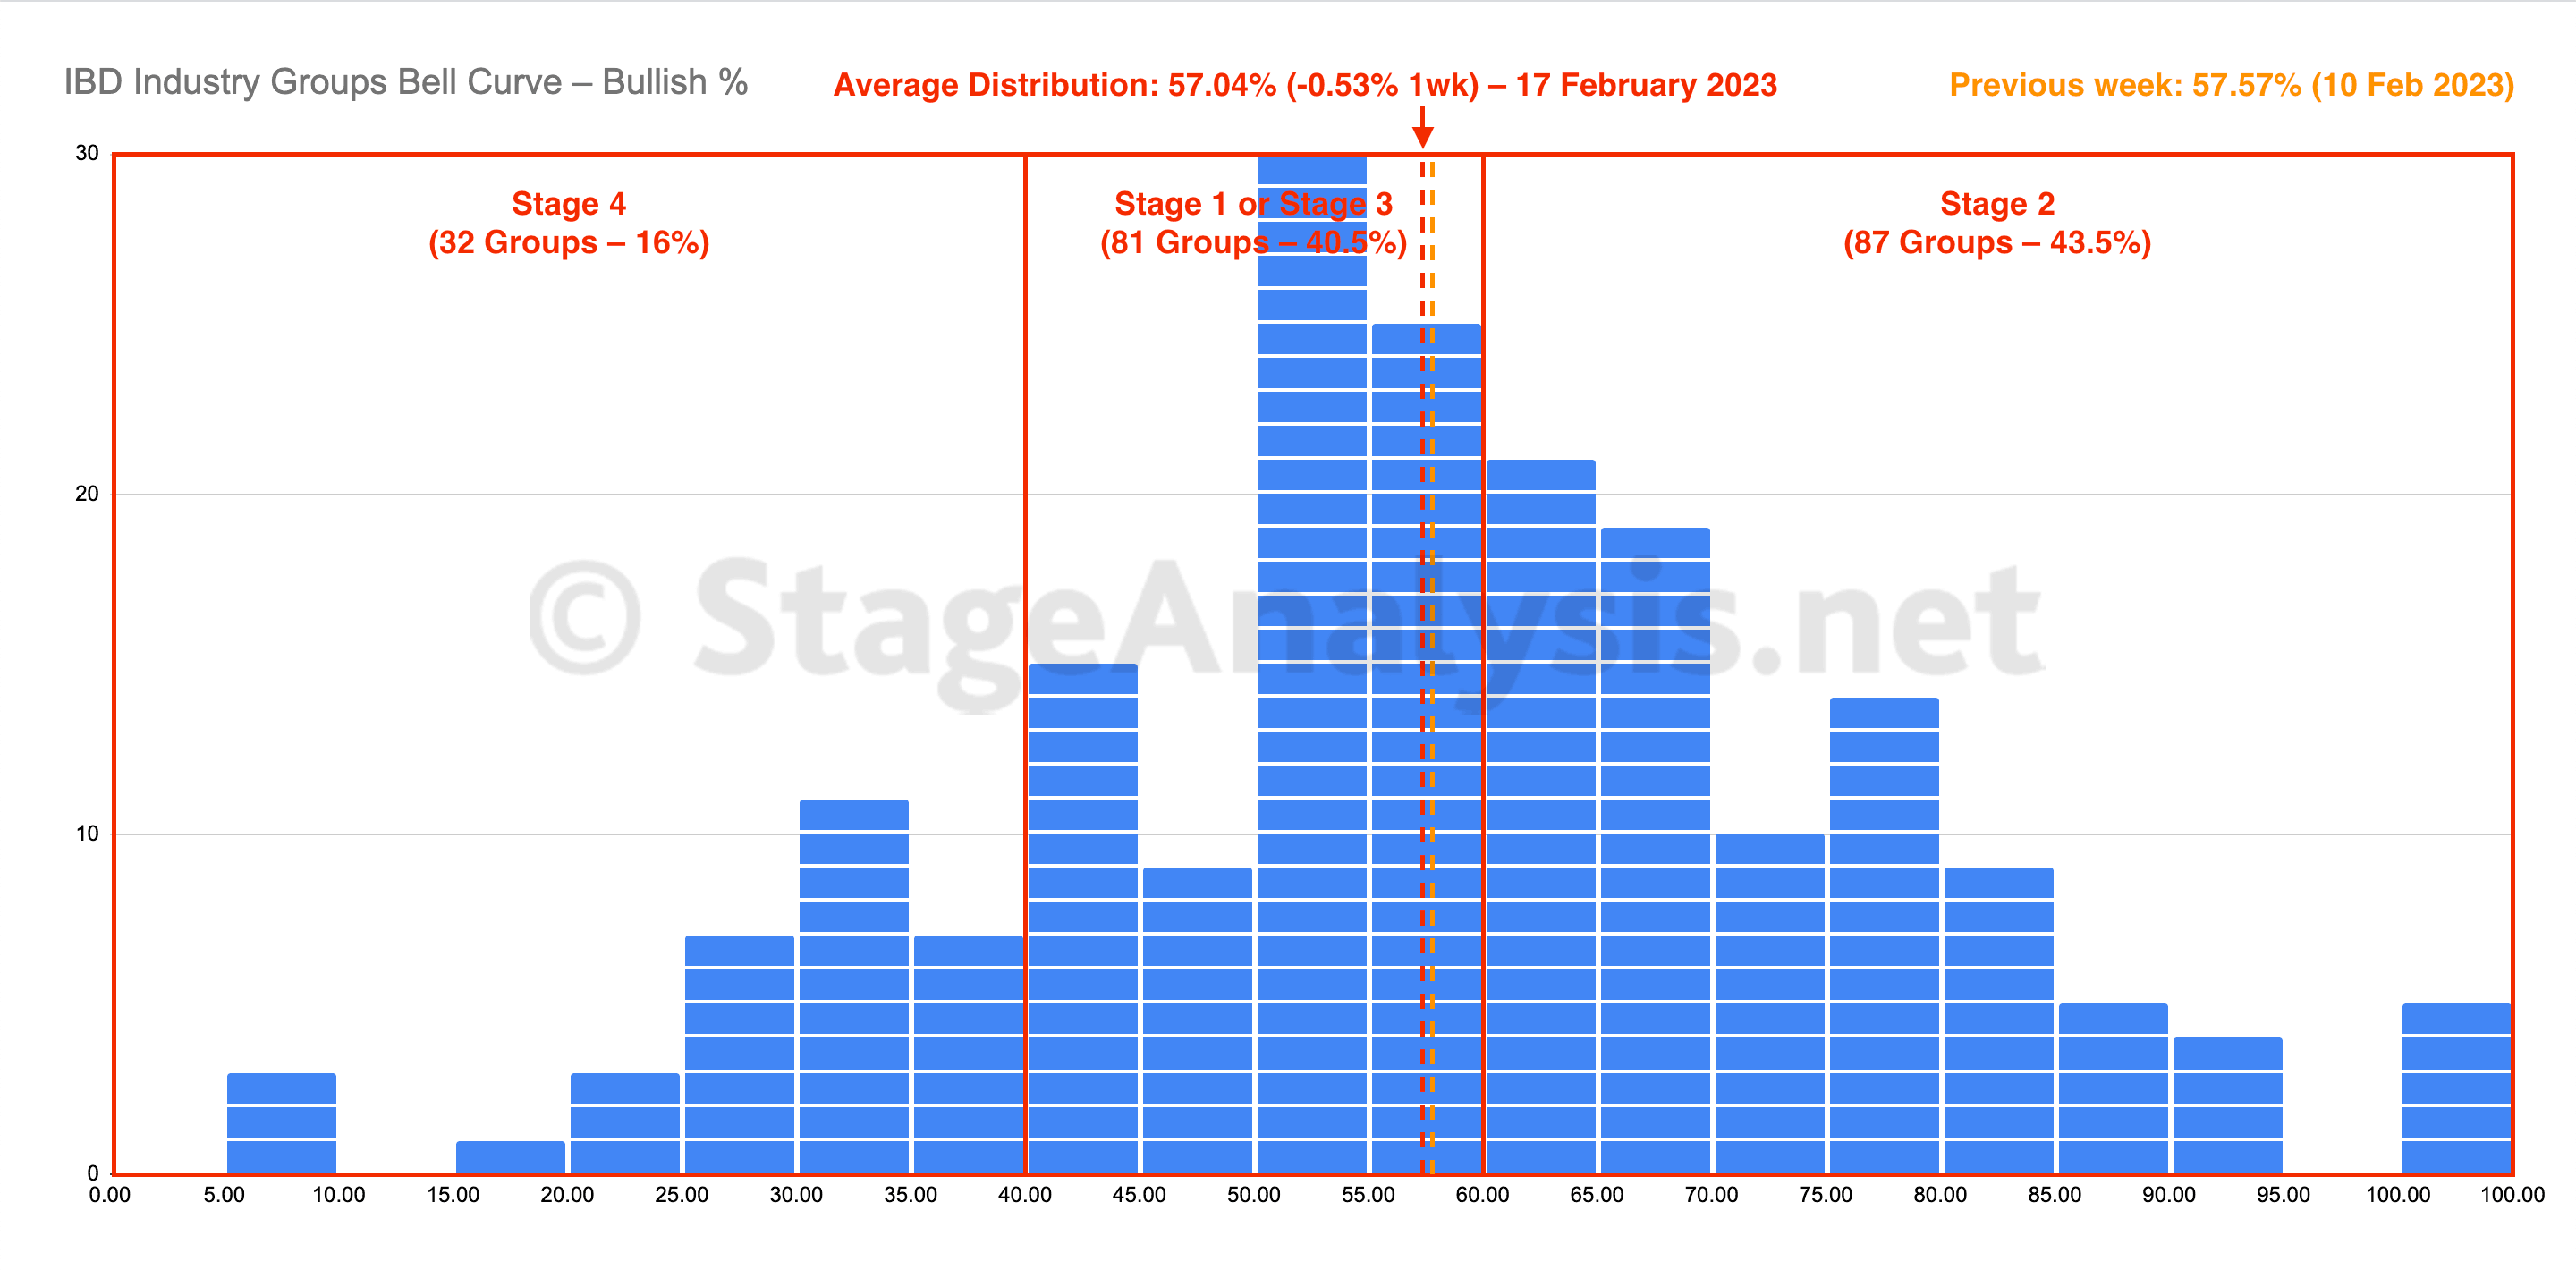
The IBD Industry Groups Bell Curve contracted for a second week, but slowed considerably with only a -0.53% decline, closing at 57.04% overall. The amount of groups in Stage 4 was unchanged, and the amount of groups in Stage 2 decreased by -3 (-1.5%), while the amount groups in Stage 1 or Stage 3 increased by +3 (+1.5%).
Read More
17 February, 2023
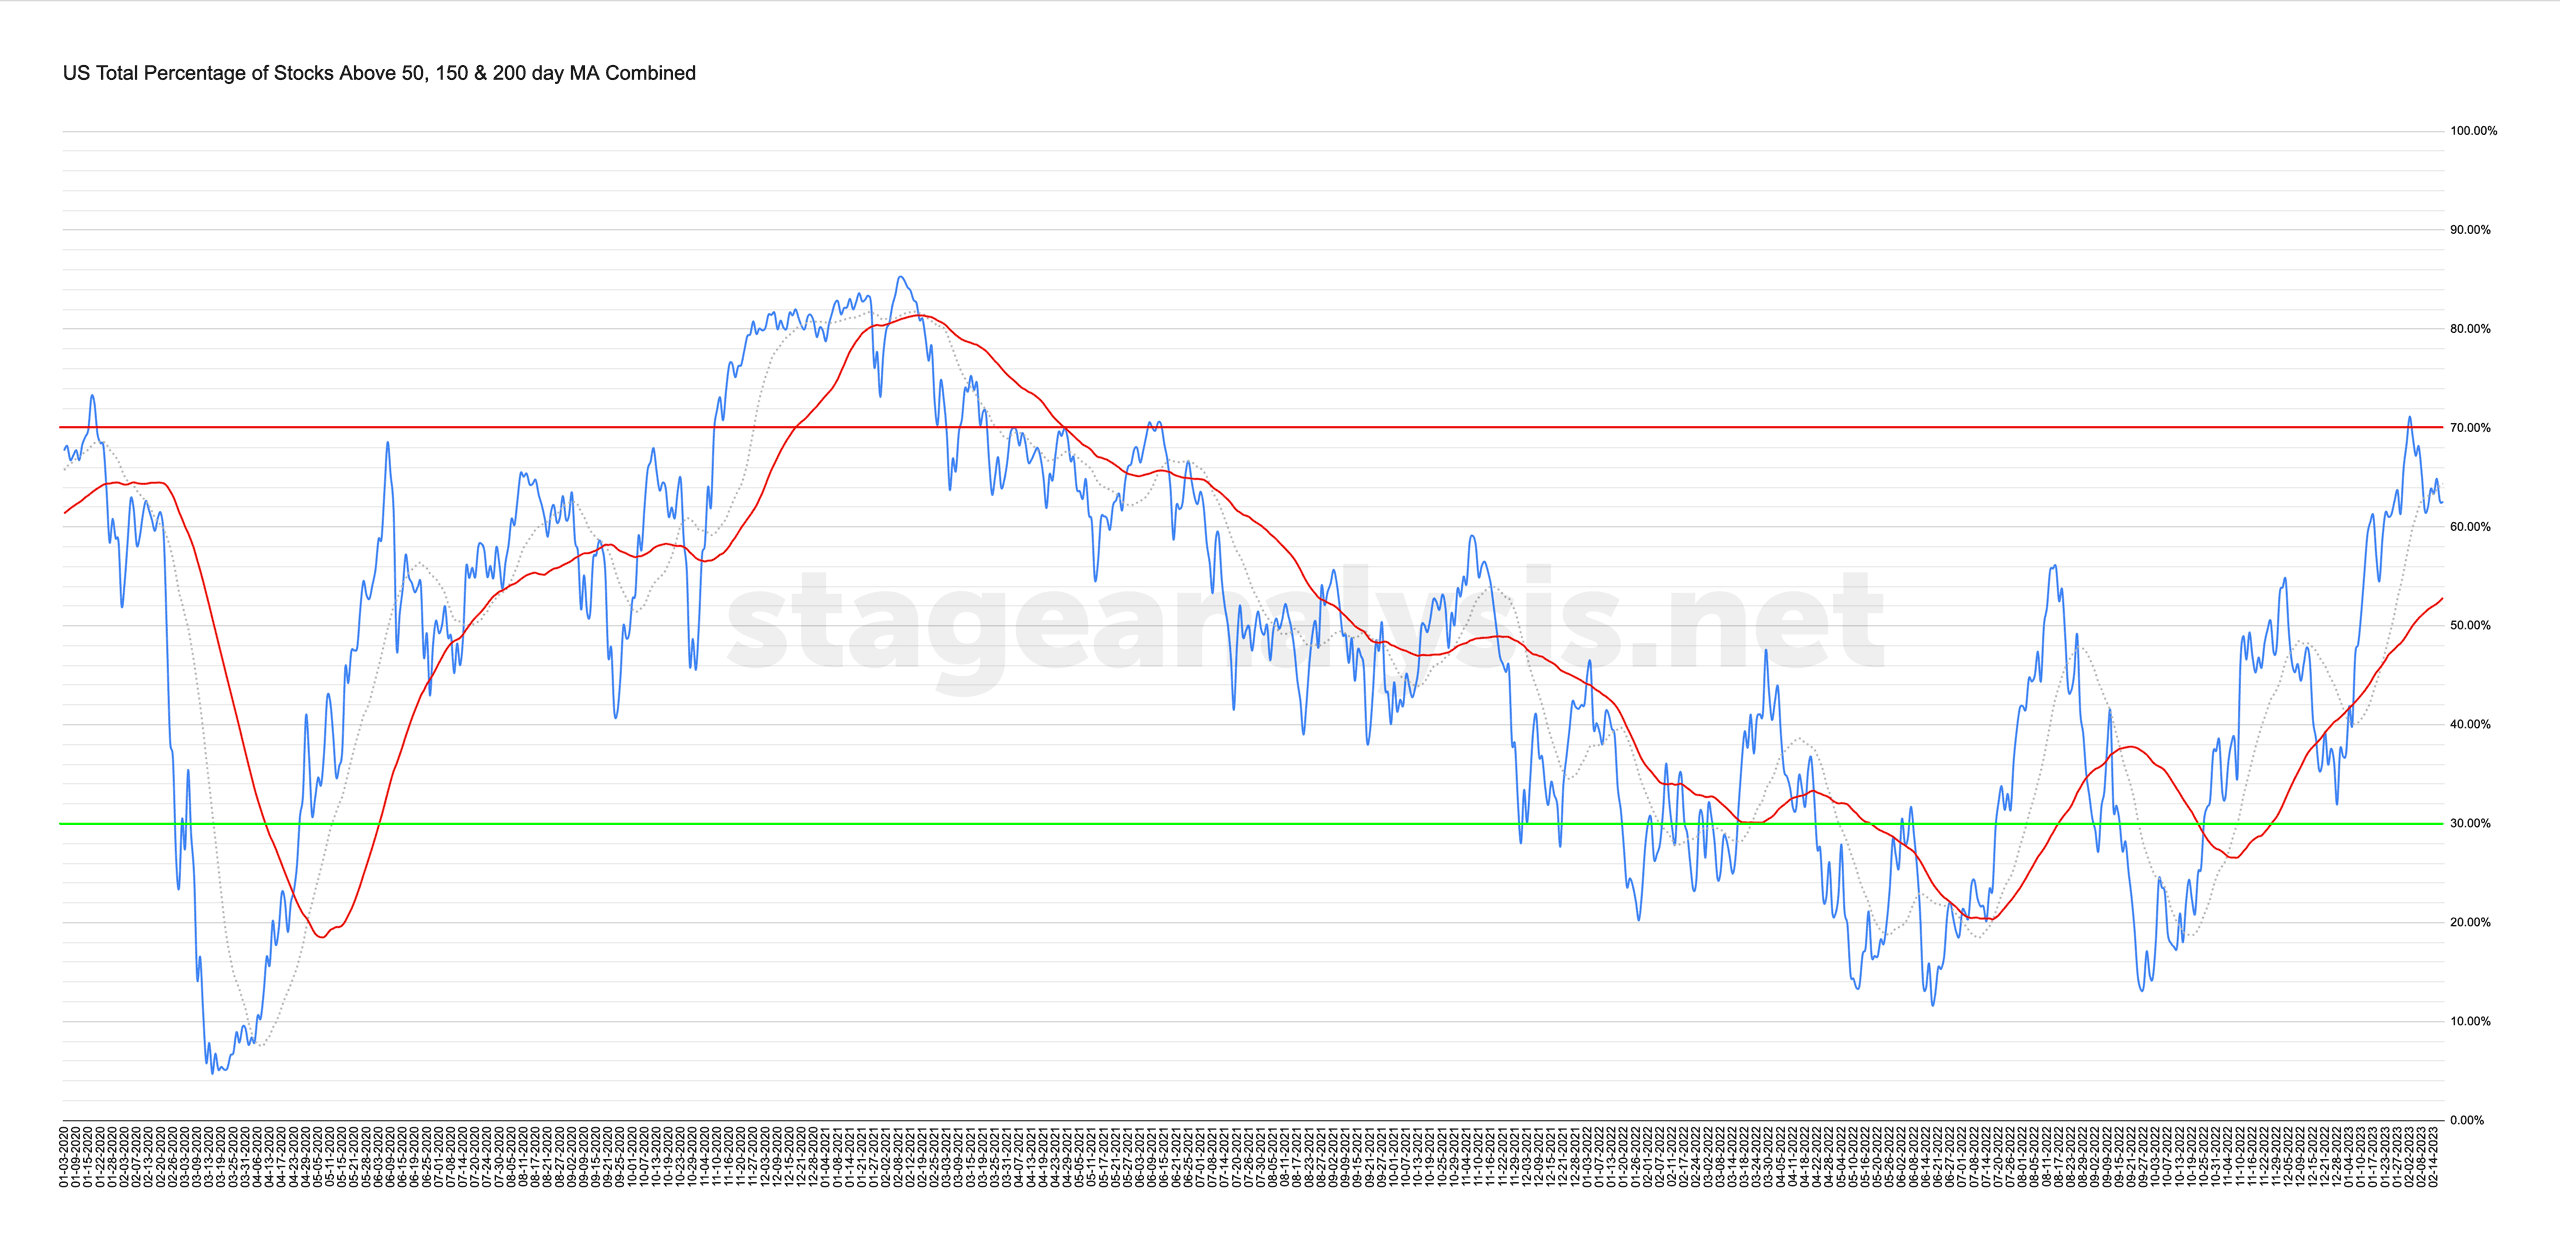
Market Breadth: Percentage of Stocks Above their 50 Day, 150 Day & 200 Day Moving Averages Combined
Custom Percentage of Stocks Above Their 50 Day, 150 Day & 200 Day Moving Averages Combined Market Breadth Charts for the Overall US Market, NYSE and Nasdaq for Market Timing and Strategy.
Read More
17 February, 2023
US Stocks Industry Groups Relative Strength Rankings
The purpose of the Relative Strength (RS) tables is to track the short, medium and long term RS changes of the individual groups to find the new leadership earlier than the crowd...
Read More
16 February, 2023
US Stocks Watchlist – 16 February 2023
A relatively small list tonight following todays weak market action, but I wanted to highlight a few after-hours movers following earnings results, plus a couple of other stocks from the scans.
Read More

