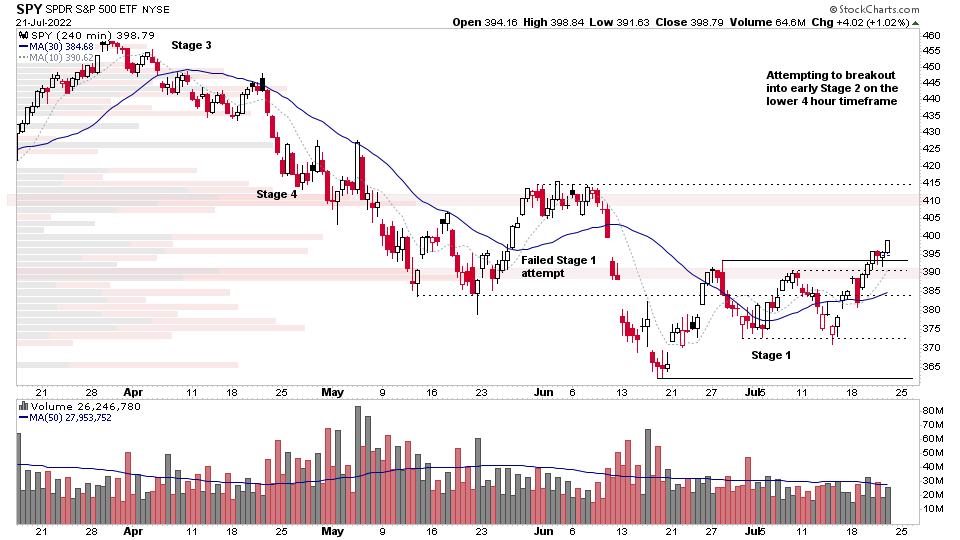
The S&P 500 continued higher for a third day in a row with a shakeout in the first hour before turning higher again. It closed above the +1x ATR level and has put in a higher high and higher low within the small rising channel / flag pattern of which it's approaching the upper end of.
Read More
Blog
20 July, 2022
Stage Analysis Members Midweek Video – 20 July 2022 (1hr 22mins)
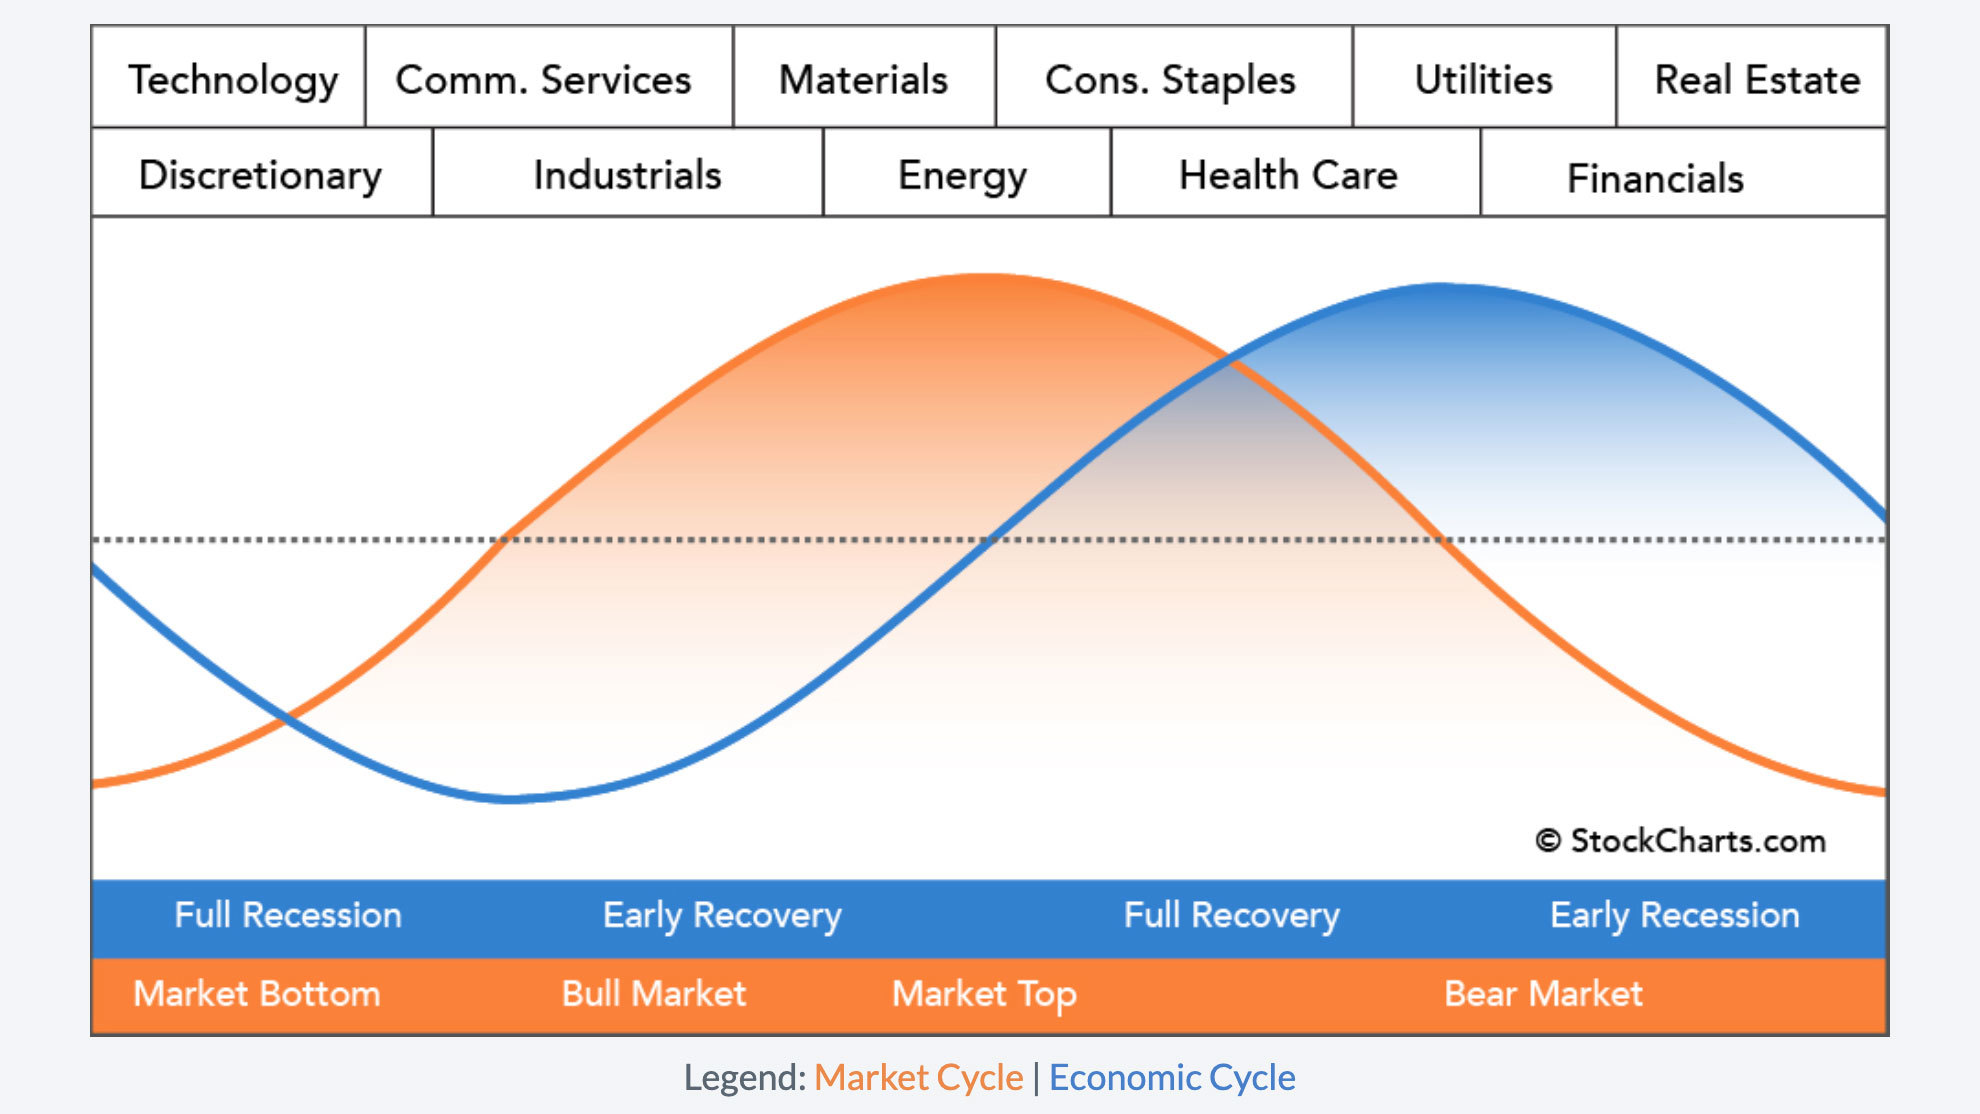
Tonights Stage Analysis Members midweek video begins with a look at the Sector Rotation Model that suggests the sectors that tend to lead the market at the different points in the market cycle and economic cycle. Followed by a brief chat of the recent article on the Top 5 Books To Learn the Wyckoff Method, before discussing the Major Index charts...
Read More
19 July, 2022
Stock Market Update and US Stocks Watchlist – 19 July 2022
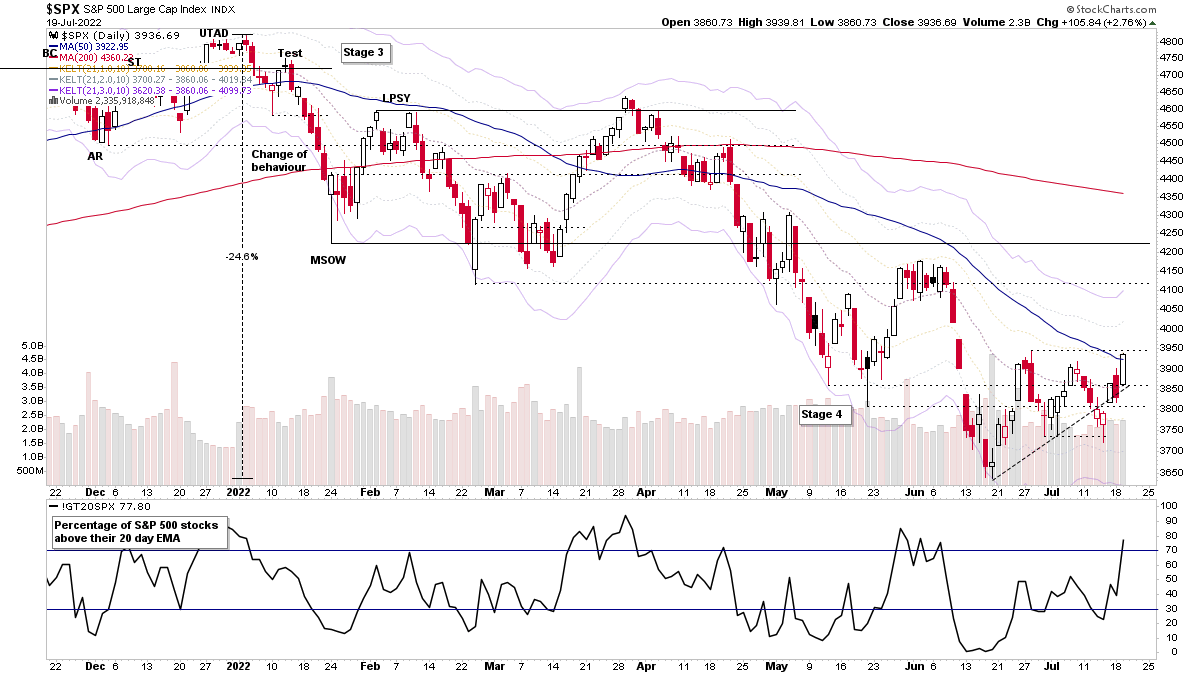
The S&P 500, Nasdaq and Russell 2000 Small Caps all managed to close above their 50 day moving averages for the first time in many months. However, they are all still in the range of the recent minor swing highs and testing their +1x ATR levels, and so could easily flip back below their 50 day MAs again if follow through action fails to materialise in the coming days.
Read More
19 July, 2022
Top 5 Books To Learn the Wyckoff Method
This website is focused on Stan Weinstein's Stage Analysis method. However, as with any method there's a huge amount of crossover with other methods, and one of the most important to learn in order to master Stage Analysis is the Wyckoff method, which was originally created by Richard D. Wyckoff in the early part of the 20th century, and has been expanded by numerous traders over the last 100 years...
Read More
17 July, 2022
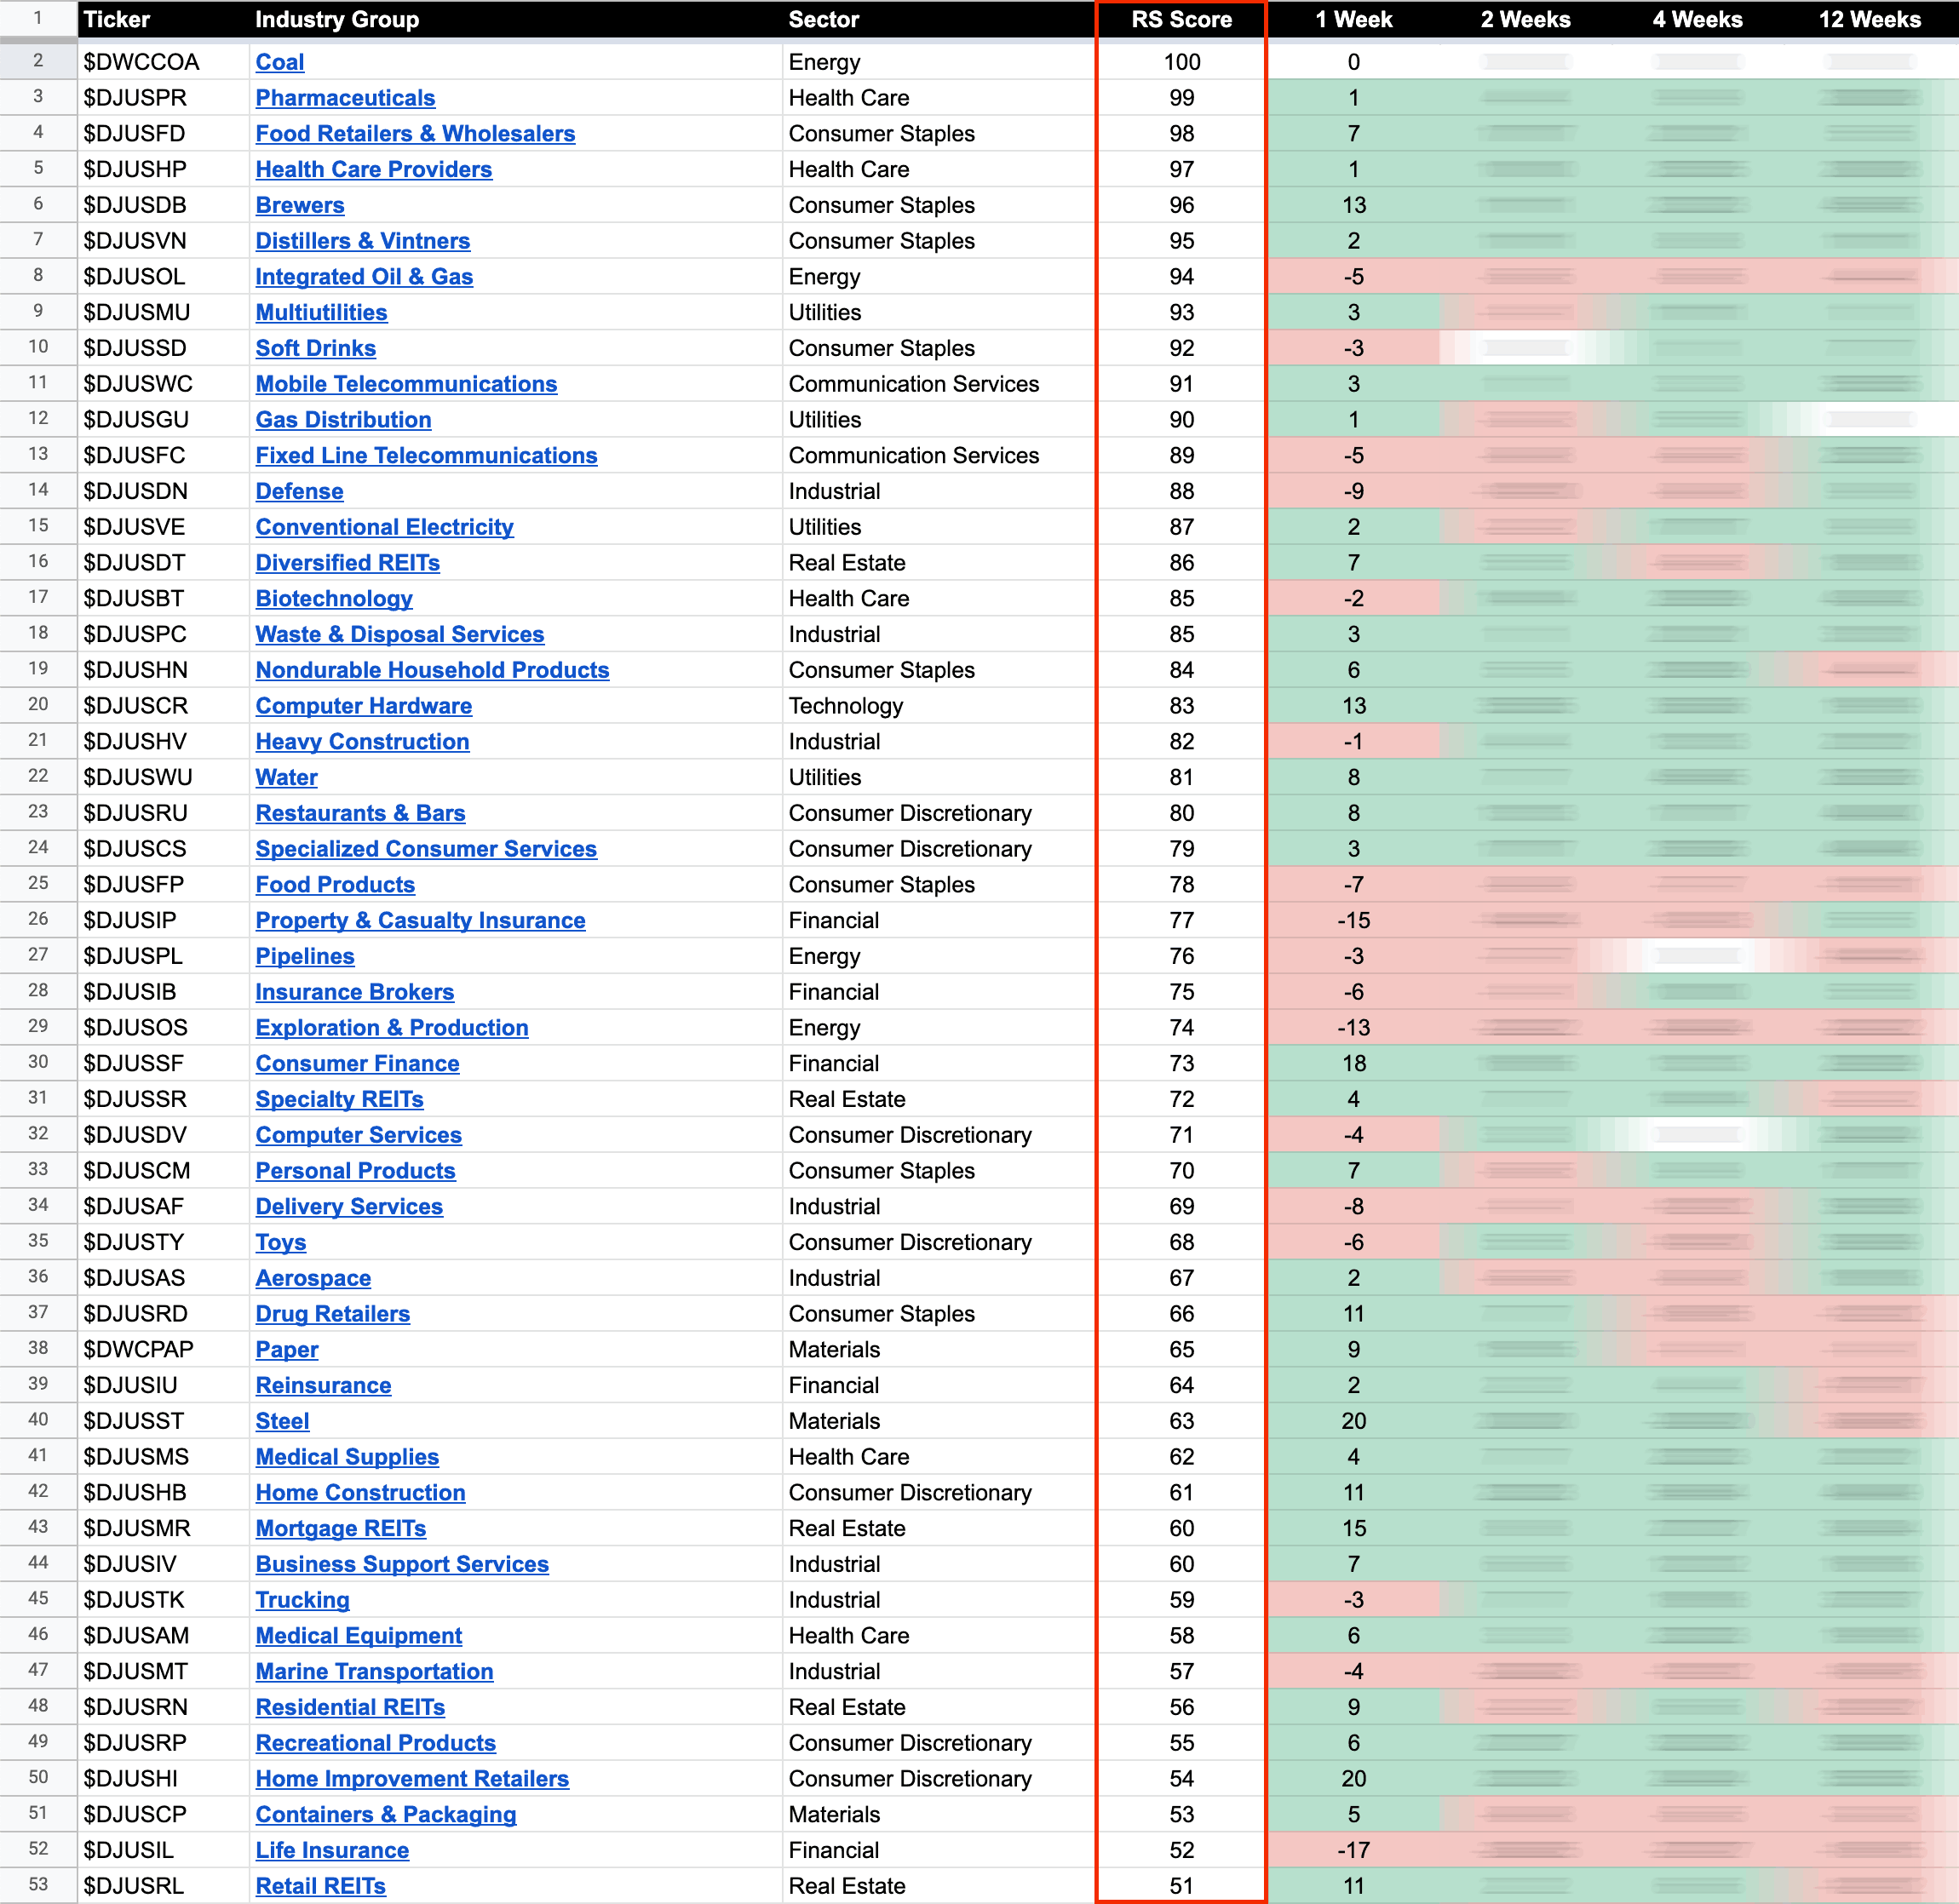
Stage Analysis Members Weekend Video – 17 July 2022 (1hr 30mins)
The Stage Analysis Members weekend video starts with a look at US Stocks Industry Groups Relative Strength Rankings and some of the groups on the move and stocks from those groups. Then in the members only content first a review of the Major Indexes – S&P 500, Nasdaq, Russell 2000 as well as chart analysis of Oil, Copper, Treasuries, Gold and the VIX...
Read More
17 July, 2022
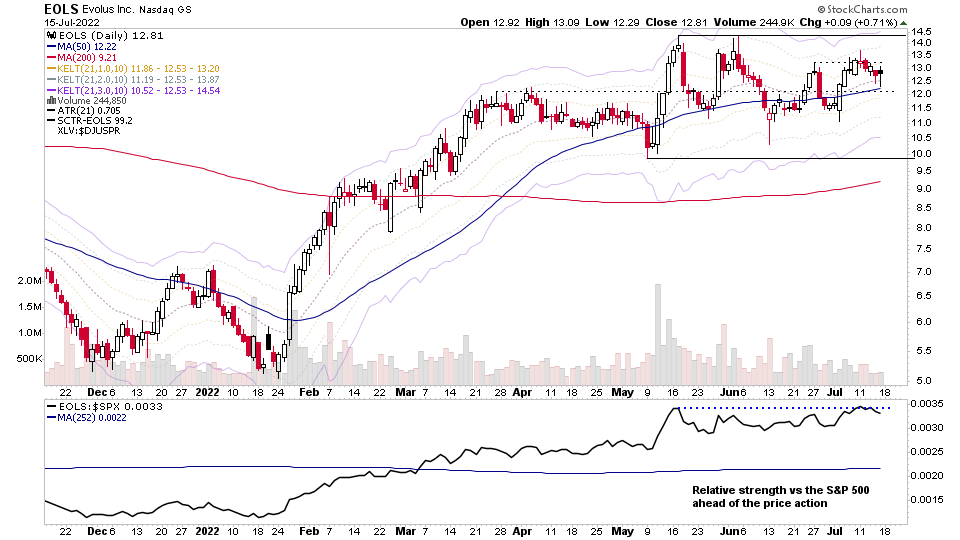
US Stocks Watchlist – 17 July 2022
For the watchlist from the weekend scans...
Read More
16 July, 2022
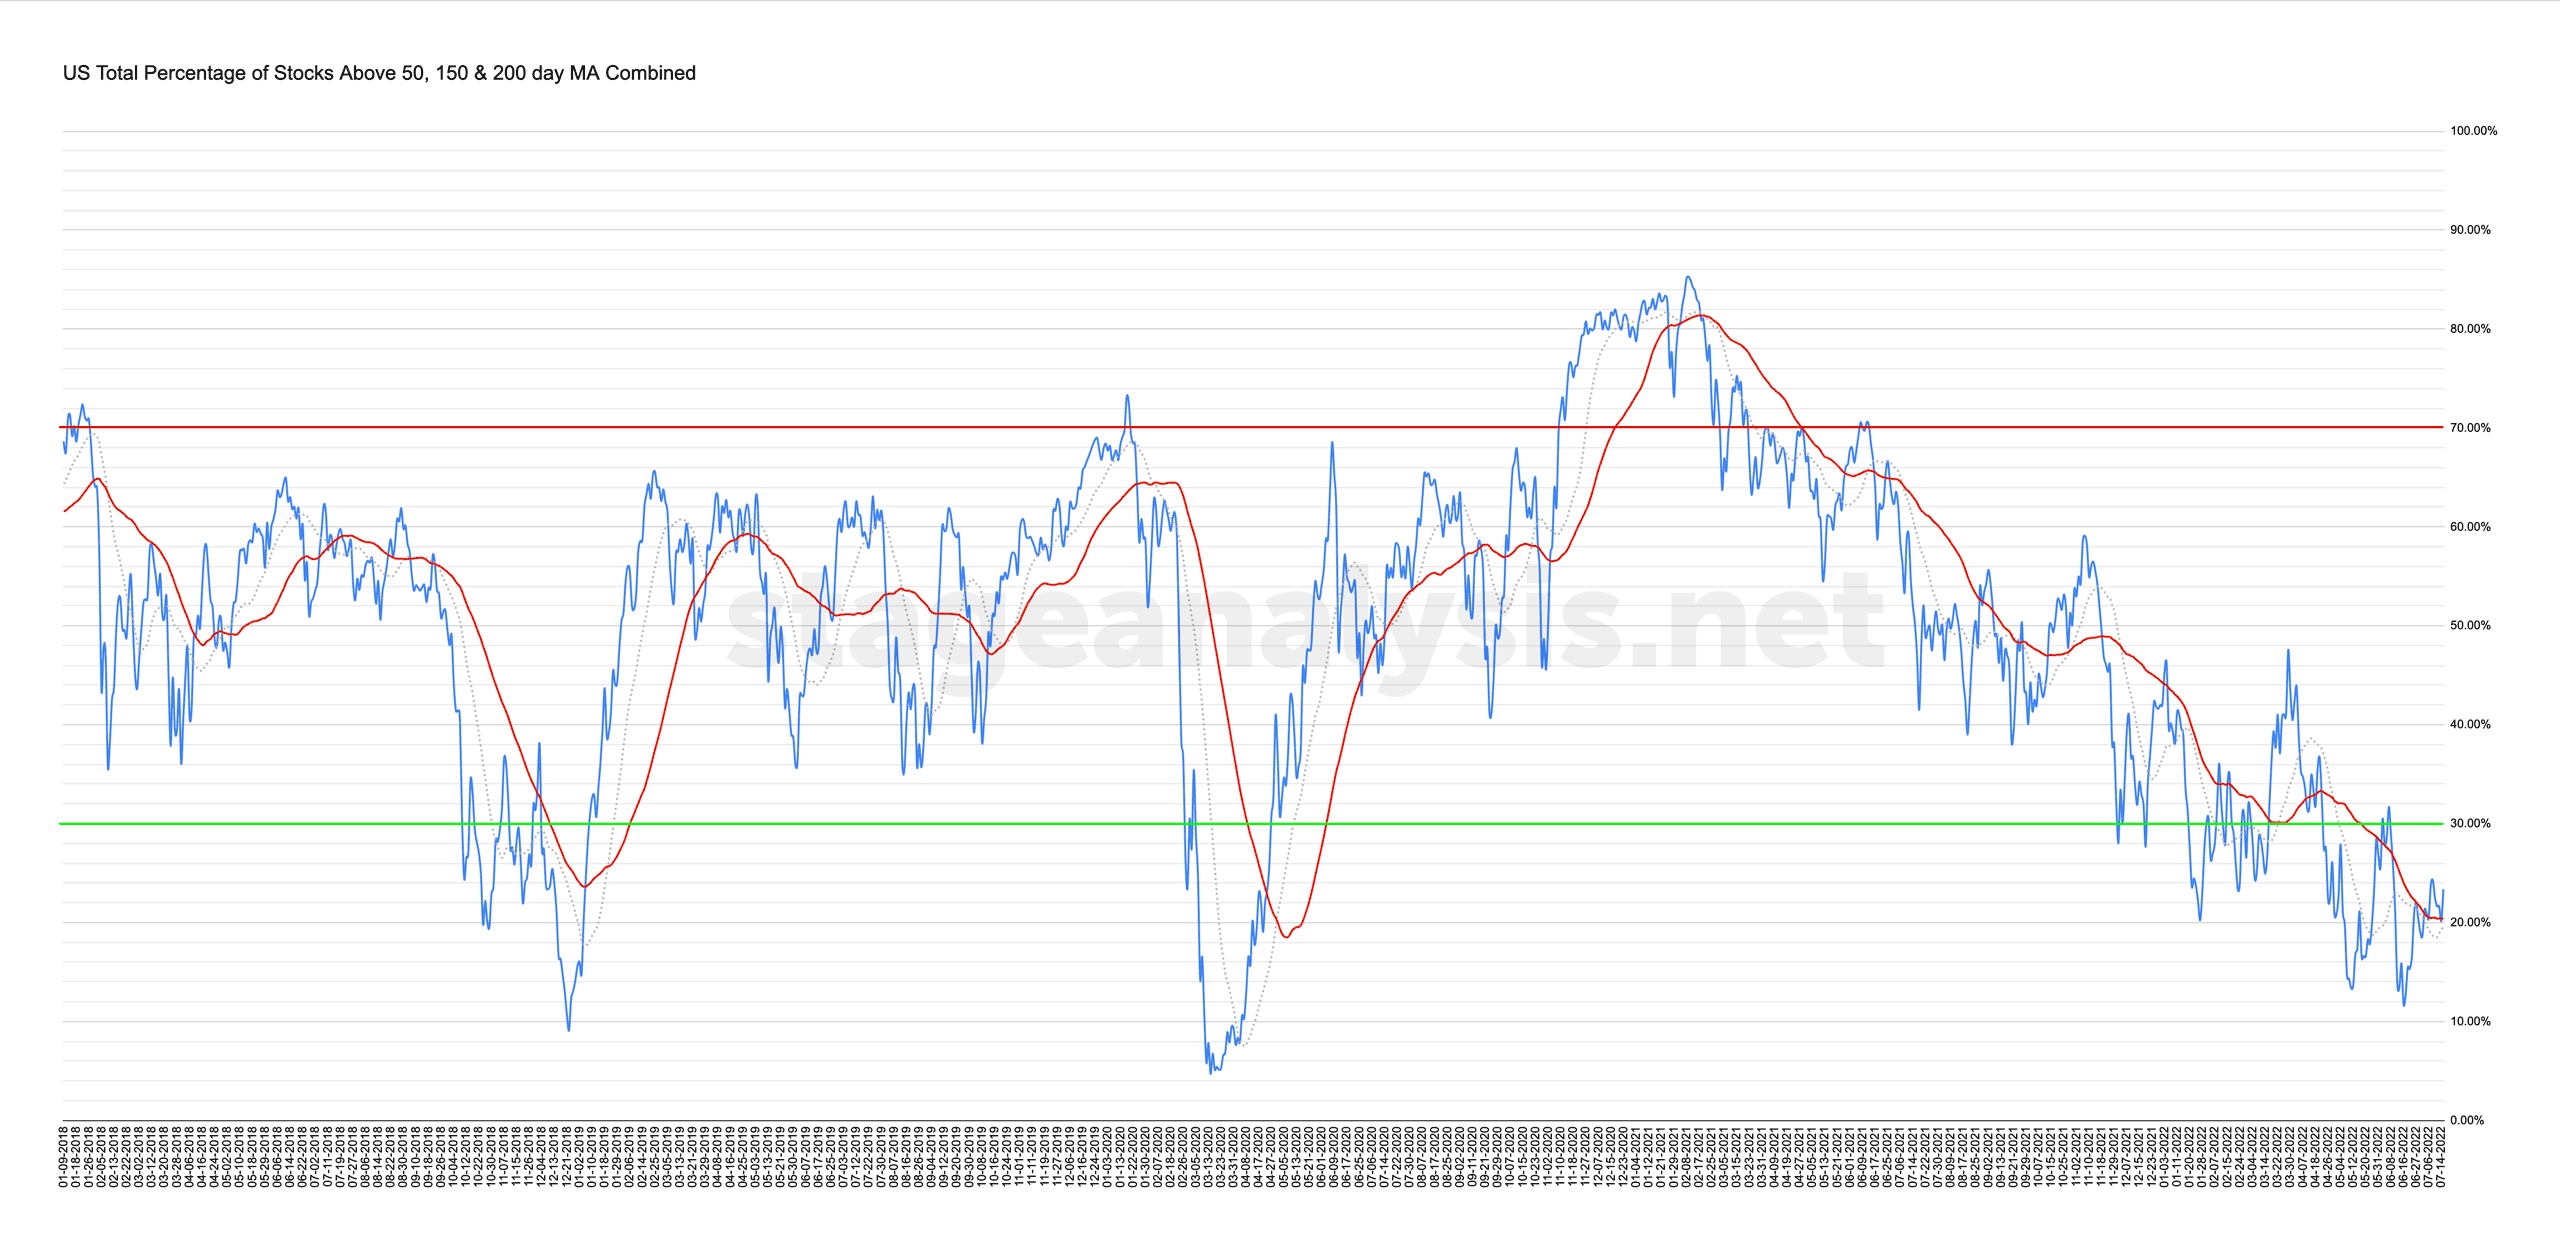
Market Breadth: Percentage of Stocks Above their 50 Day, 150 Day & 200 Day Moving Averages Combined
Custom Percentage of Stocks Above Their 50 Day, 150 Day & 200 Day Moving Averages Combined Market Breadth Charts for the Overall US Market, NYSE and Nasdaq for Market Timing and Strategy.
Read More
15 July, 2022
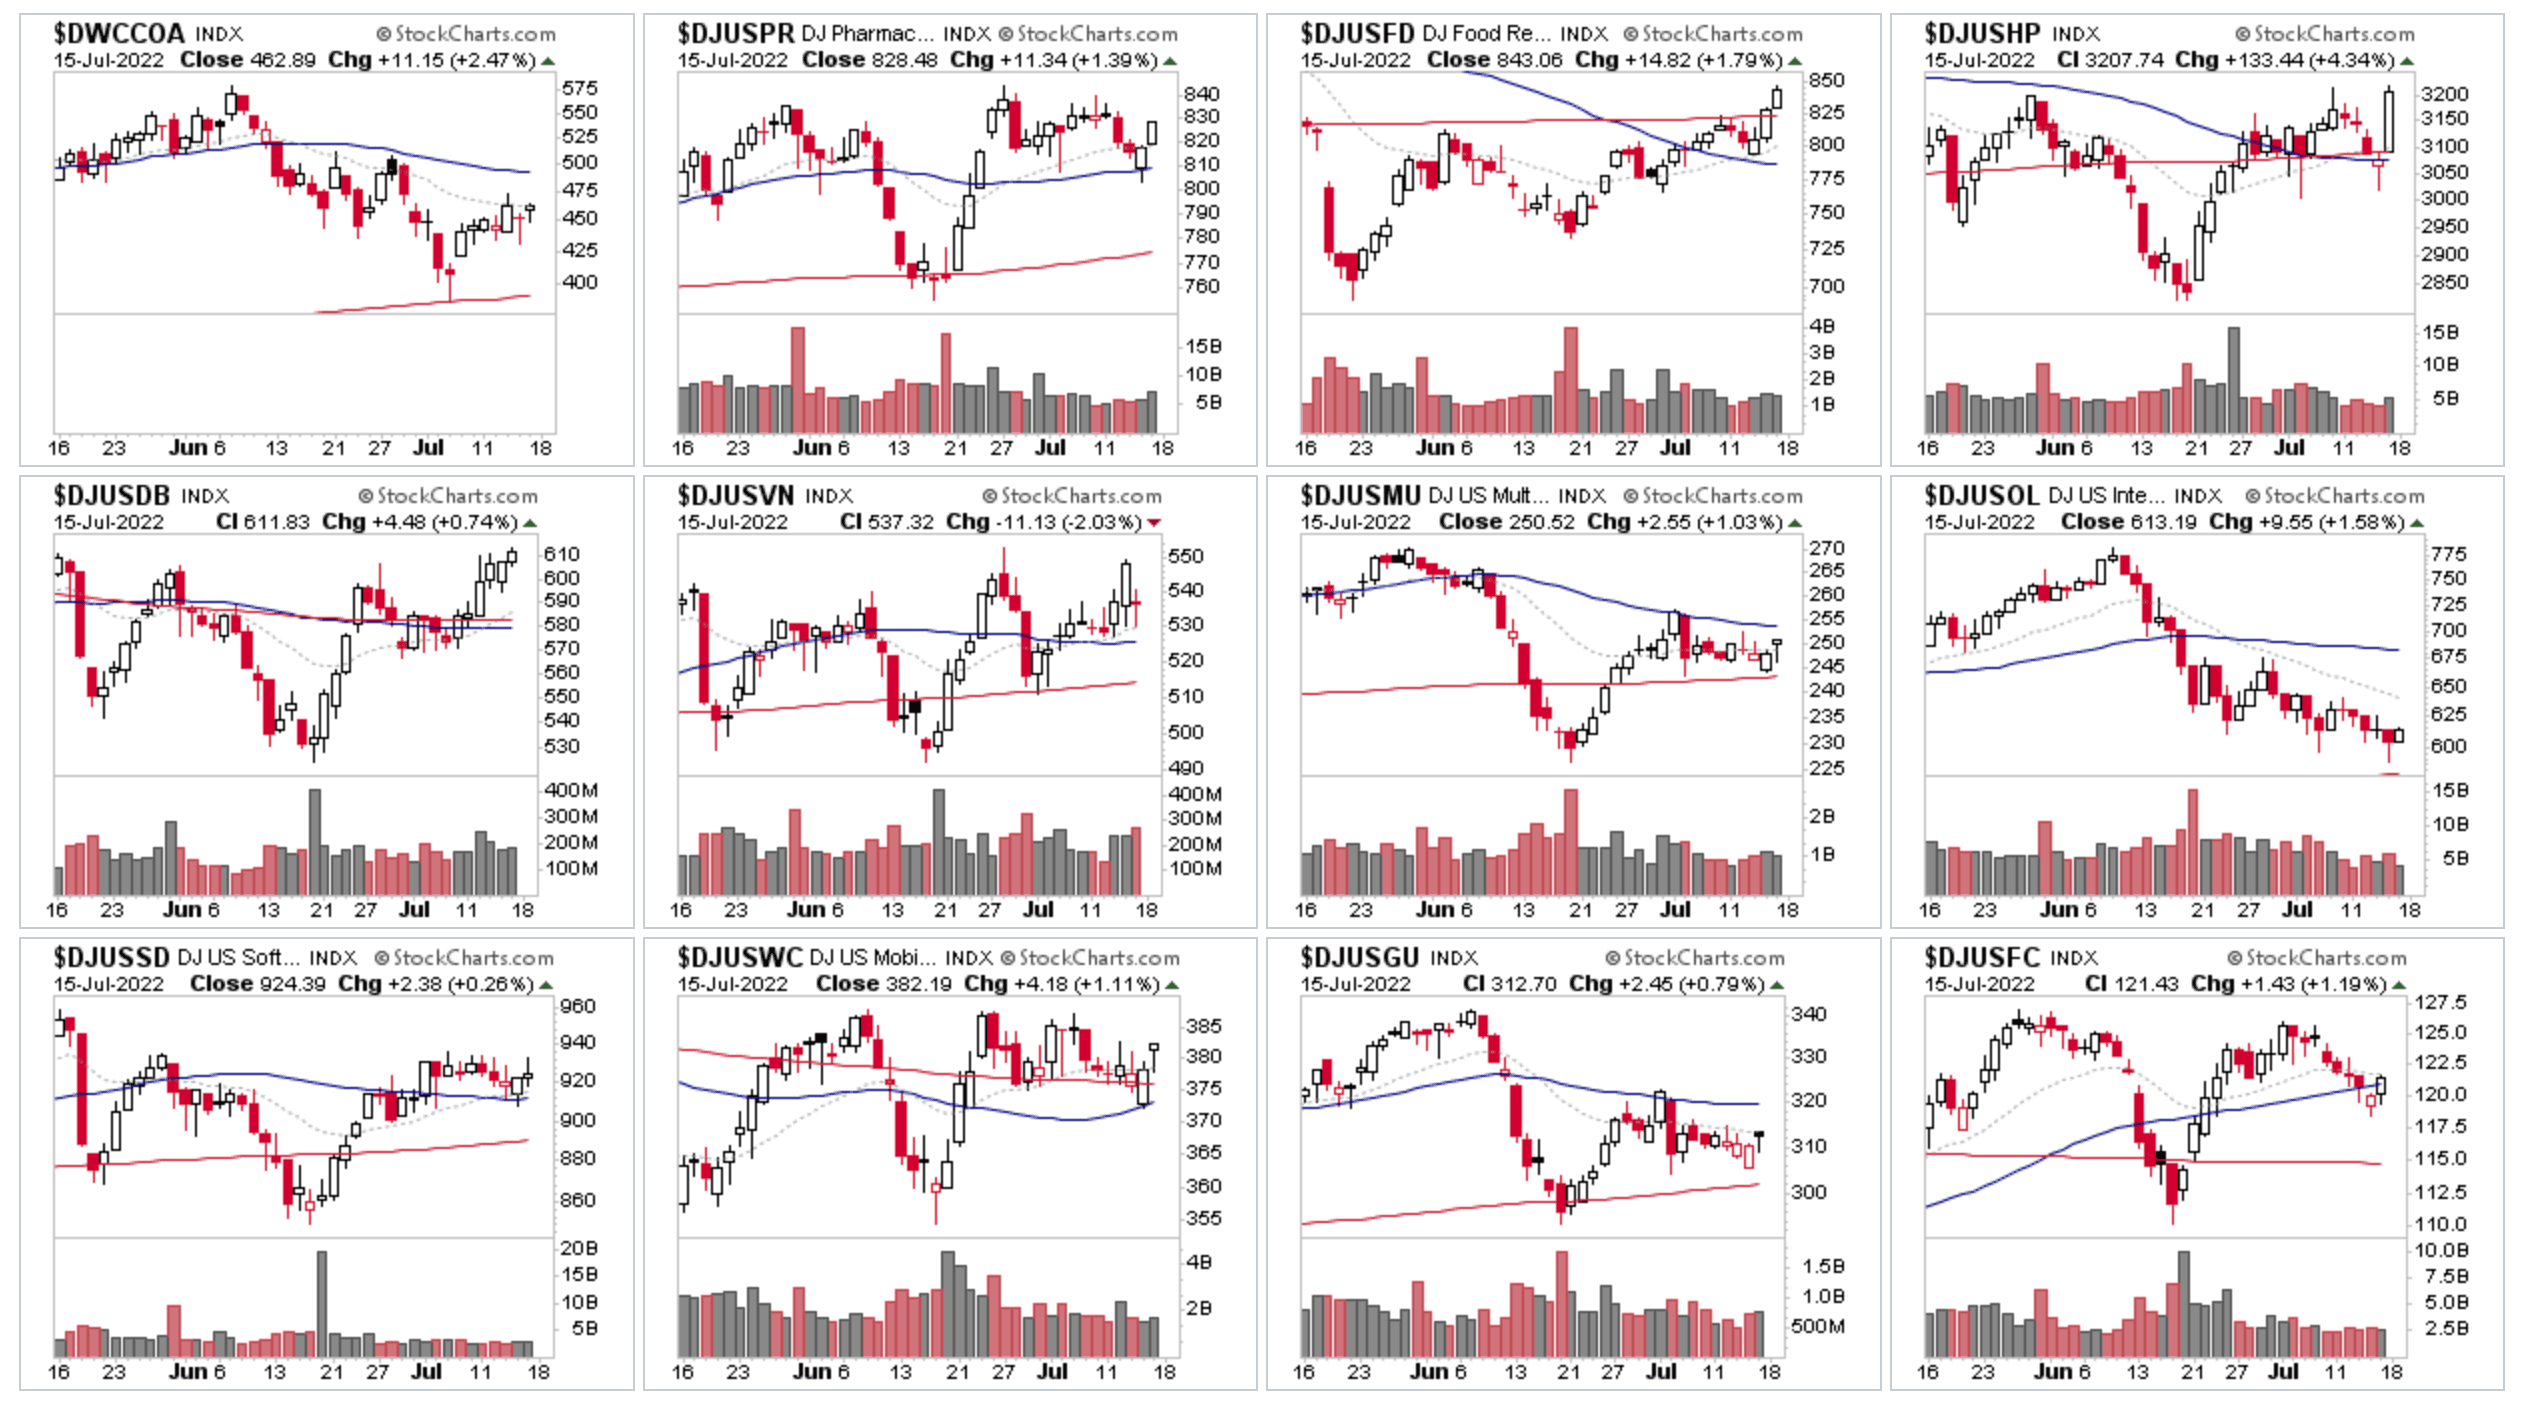
US Stocks Industry Groups Relative Strength Rankings
The purpose of the Relative Strength (RS) tables is to track the short, medium and long term RS changes of the individual groups to find the new leadership earlier than the crowd...
Read More
14 July, 2022
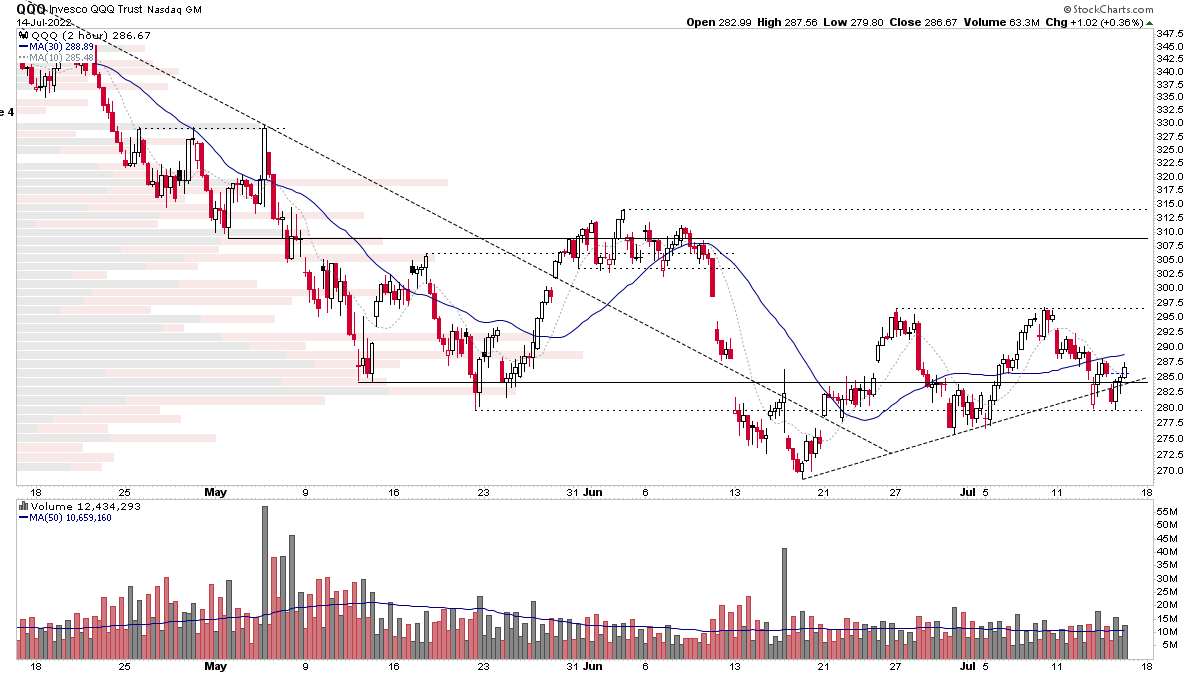
Stock Market Update and US Stocks Watchlist – 14 July 2022
A second day of the market gapping lower at the open and then spending the rest of the day attempting to gain back the declines with ended with a mildly postive close in the Nasdaq 100 at +0.34%. But the majority of other markets failed to regain positive territory with the NYSE one of the biggest decliners at -1.18%...
Read More
14 July, 2022
Stage Analysis Members Midweek Video – 13 July 2022 (1hr 5mins)
The Stage Analysis members midweek video begins this week with a further discussion on How Stocks Transition From the Stage 4 Declining Phase to the Stage 1 Basing Phase using an early Stage 1 example from the Global Trend Alert to help to explain some of the characteristics to look for...
Read More

