The members midweek video discussing the market, sector breadth, short-term market breadth and individual stocks from the watchlist in more detail...
Read More

Blog
12 October, 2022
Stage Analysis Members Midweek Video – 12 October 2022 (1hr 1min)
11 October, 2022
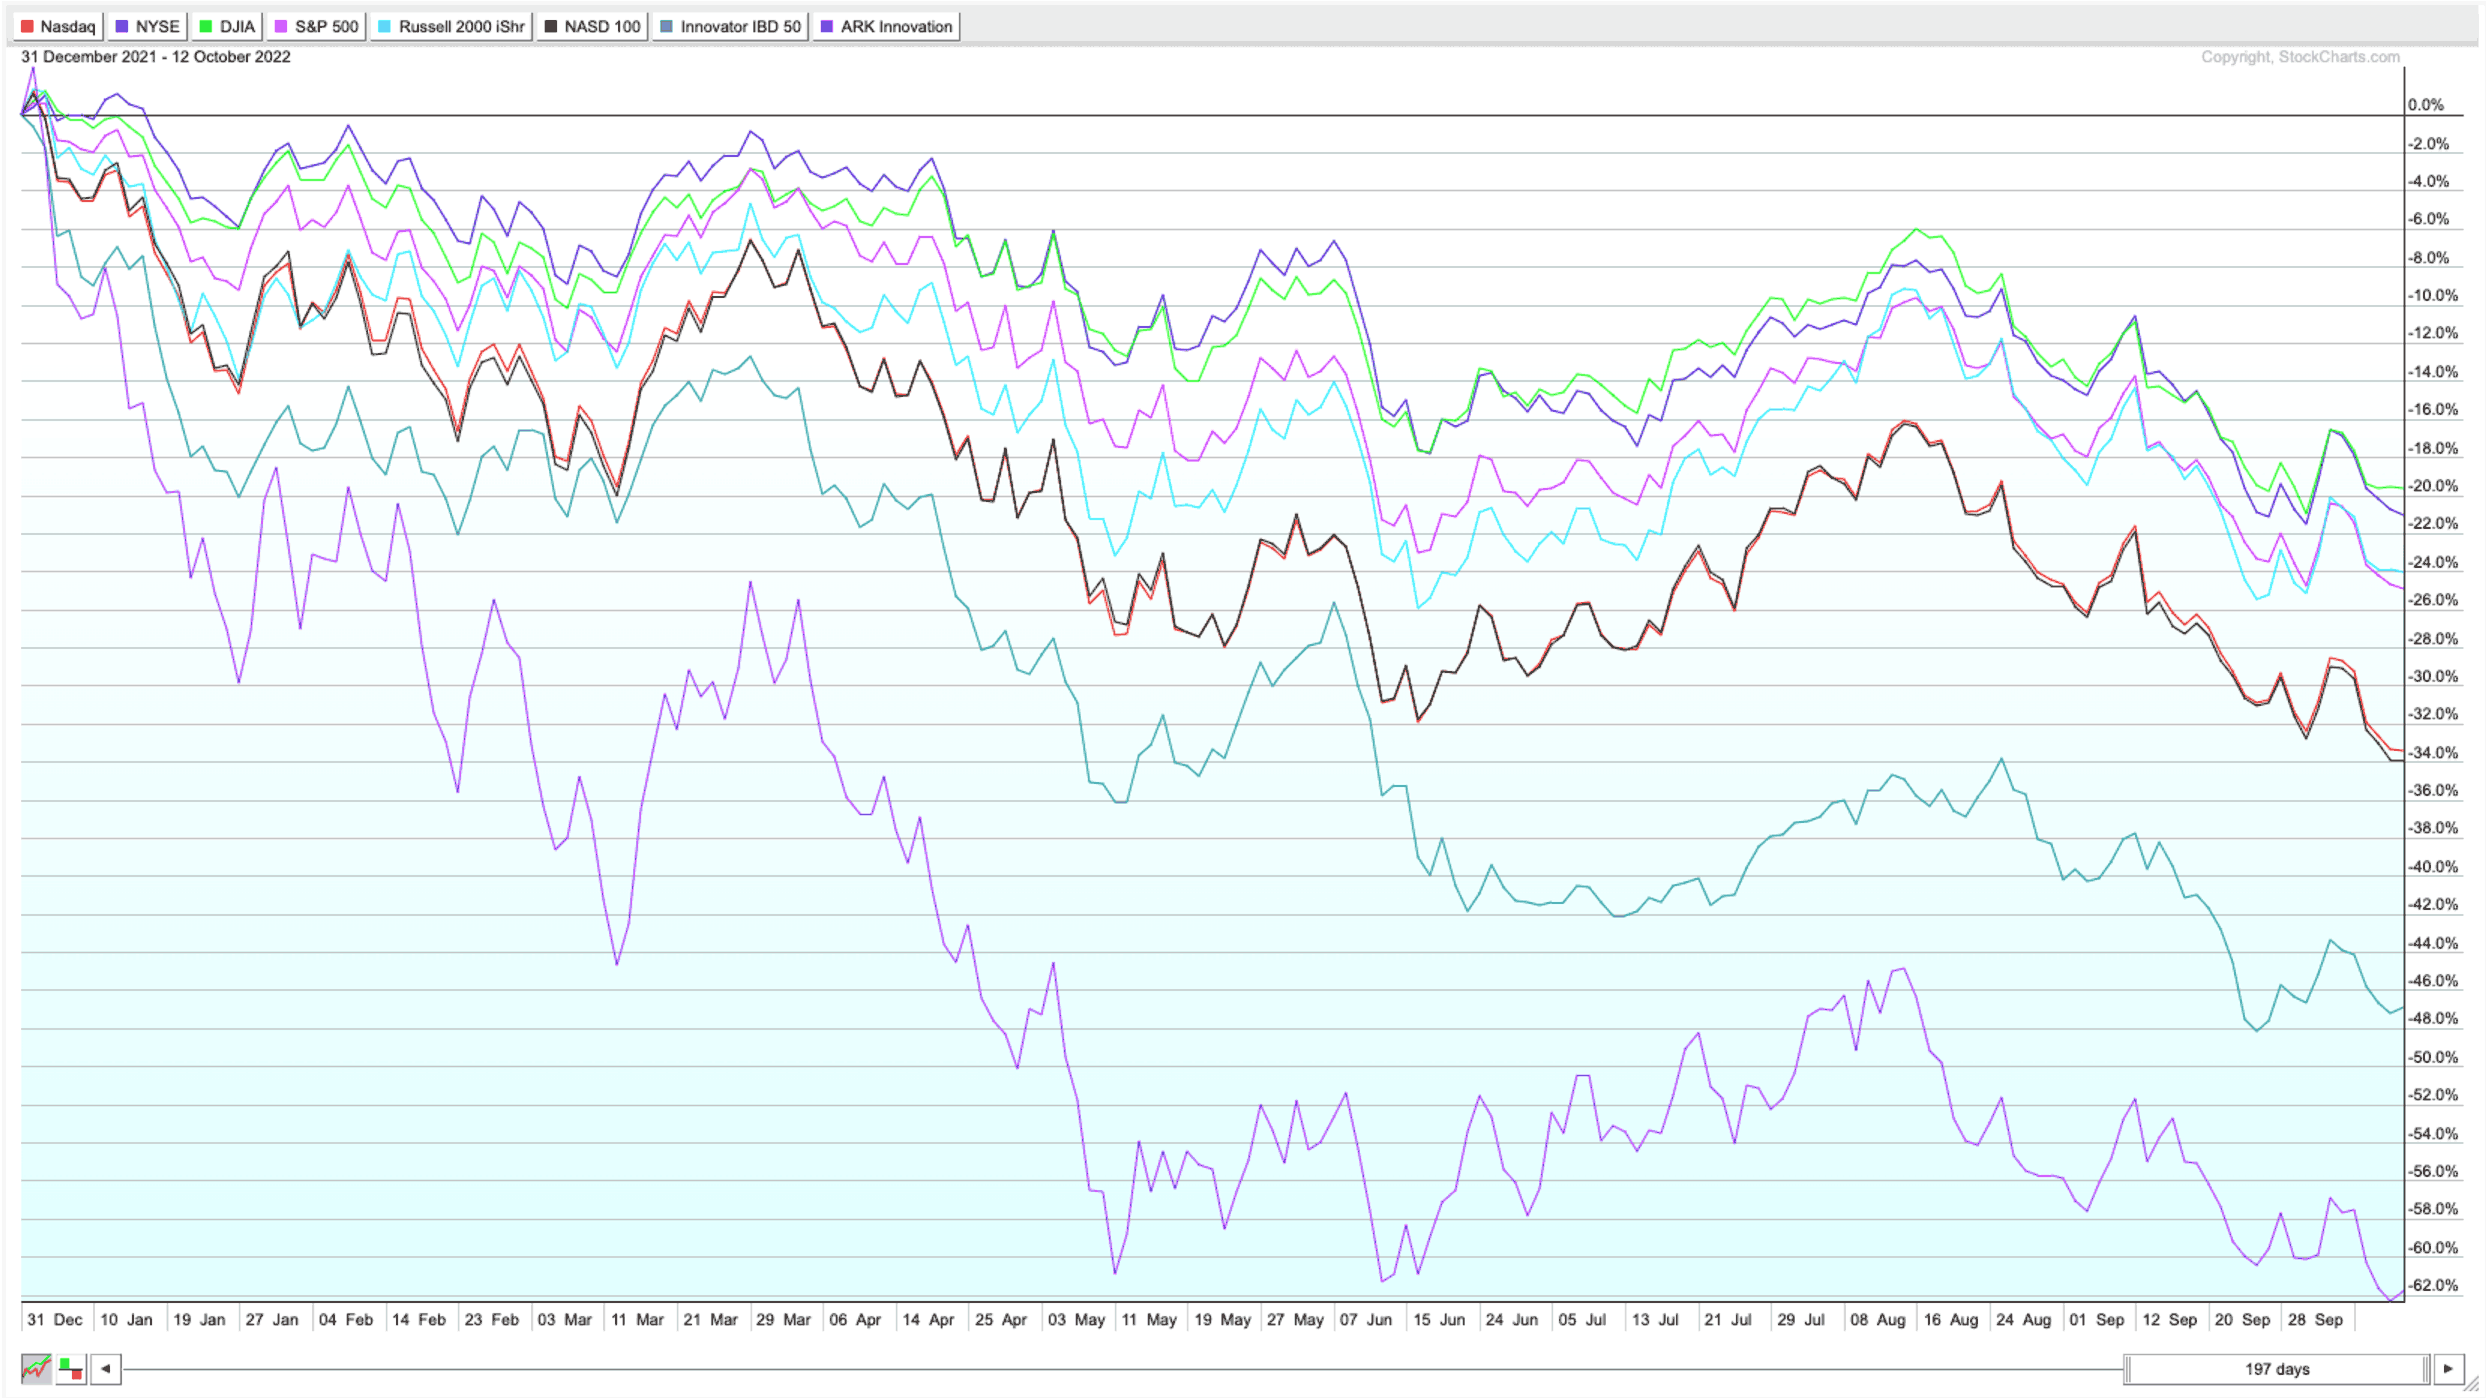
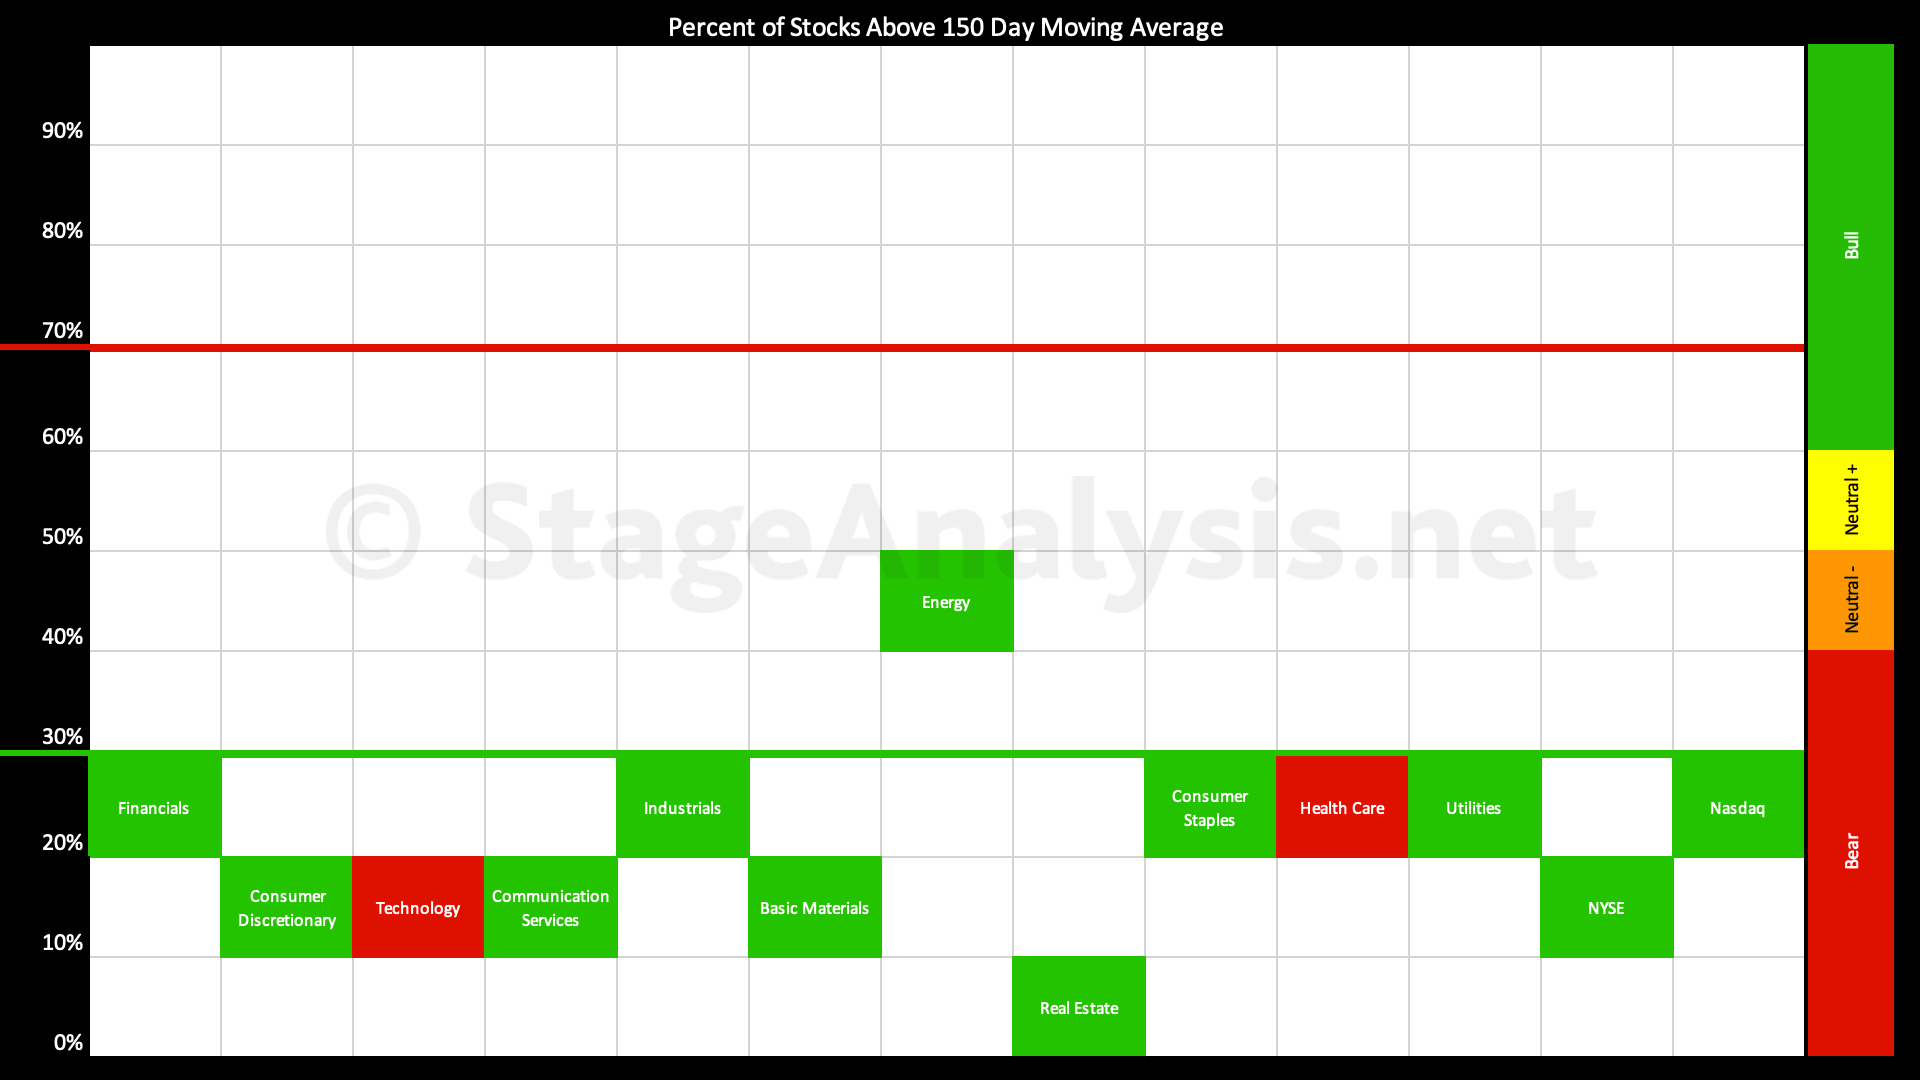
Sector Breadth: Percentage of US Stocks Above Their 150 day (30 Week) Moving Averages
The Percentage of US Stocks Above Their 150 day Moving Averages in the 11 major sectors has declined by a further -10.27% over the last three weeks since the last sector breadth post, and is currently at 18.90%, which is one of the lowest readings of the year to date...
Read More
11 October, 2022
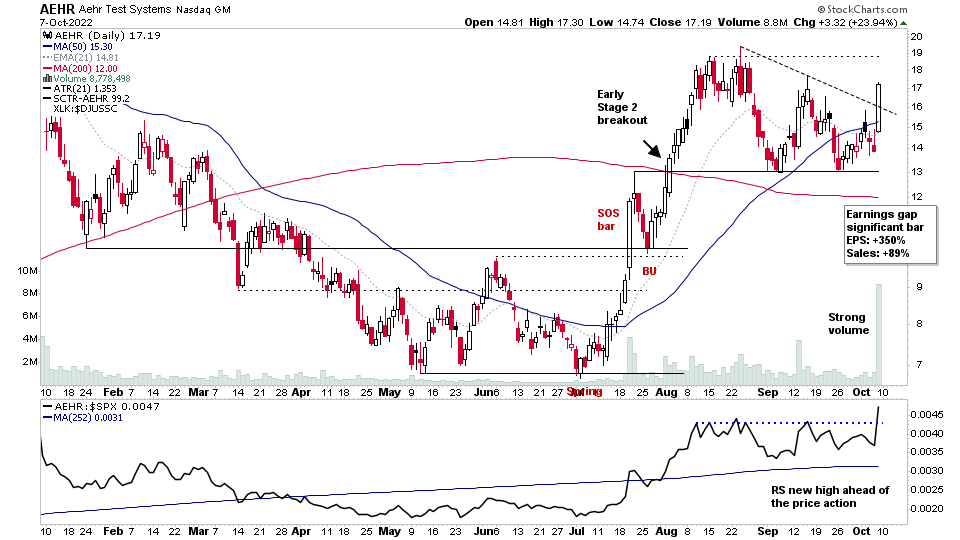
US Stocks Watchlist – 10 October 2022
The market continued lower today with less aggression than Friday and on lower volume. But is now within one standard deviation of the prior low, and so it could be tested tomorrow, and if supply remains dominant...
Read More
09 October, 2022
Stage Analysis Members Weekend Video – 9 October 2022 (1hr 27mins)
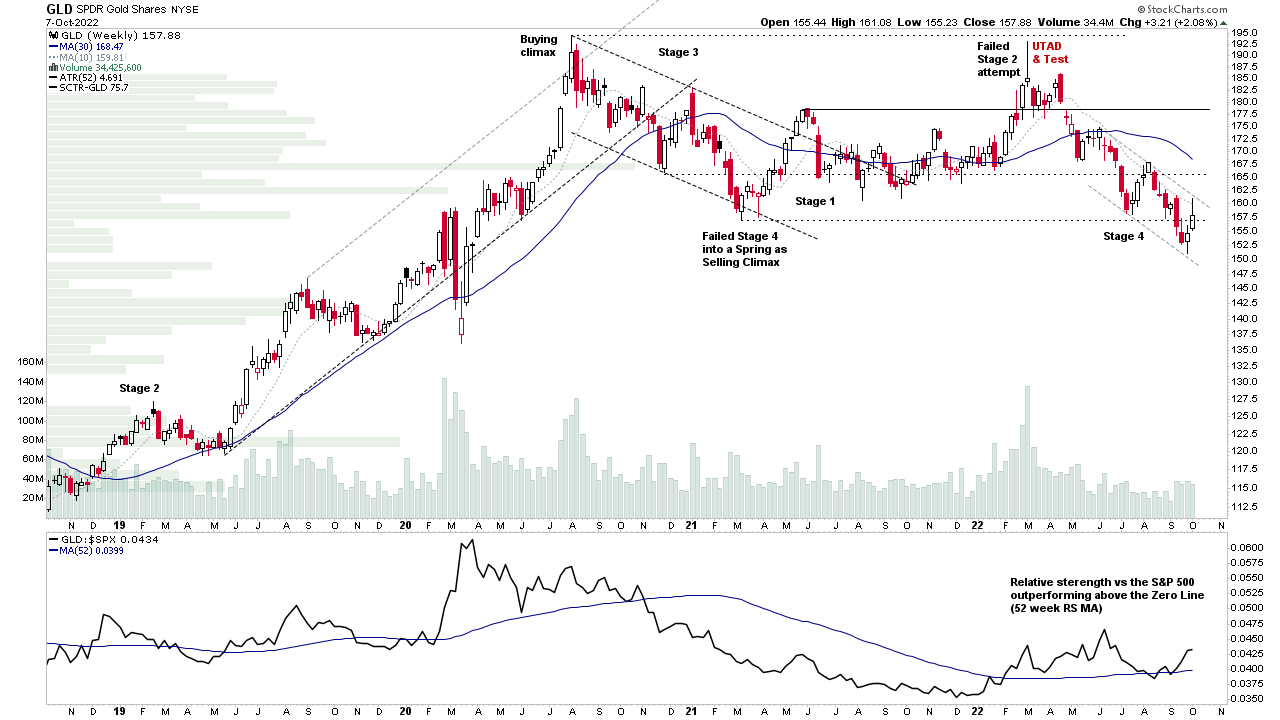
The regular members weekend video discussing the market, industry groups, market breadth and individual stocks from the watchlist in more detail. This week beginning with a special feature on Gold and Silver and the Miners as they show near term relative strength and attempt to move towards Stage 4B- or Stage 1.
Read More
09 October, 2022
Stock Market Update and the US Stocks Watchlist – 9 October 2022
The S&P 500 made a Spring attempt on Monday and surged higher with a short-covering rally for a few days, but stalled at the declining 21-day EMA on Wednesday and Thursday and begin the Test on Friday (which often follows a Spring attempt if supply is still present)...
Read More
08 October, 2022
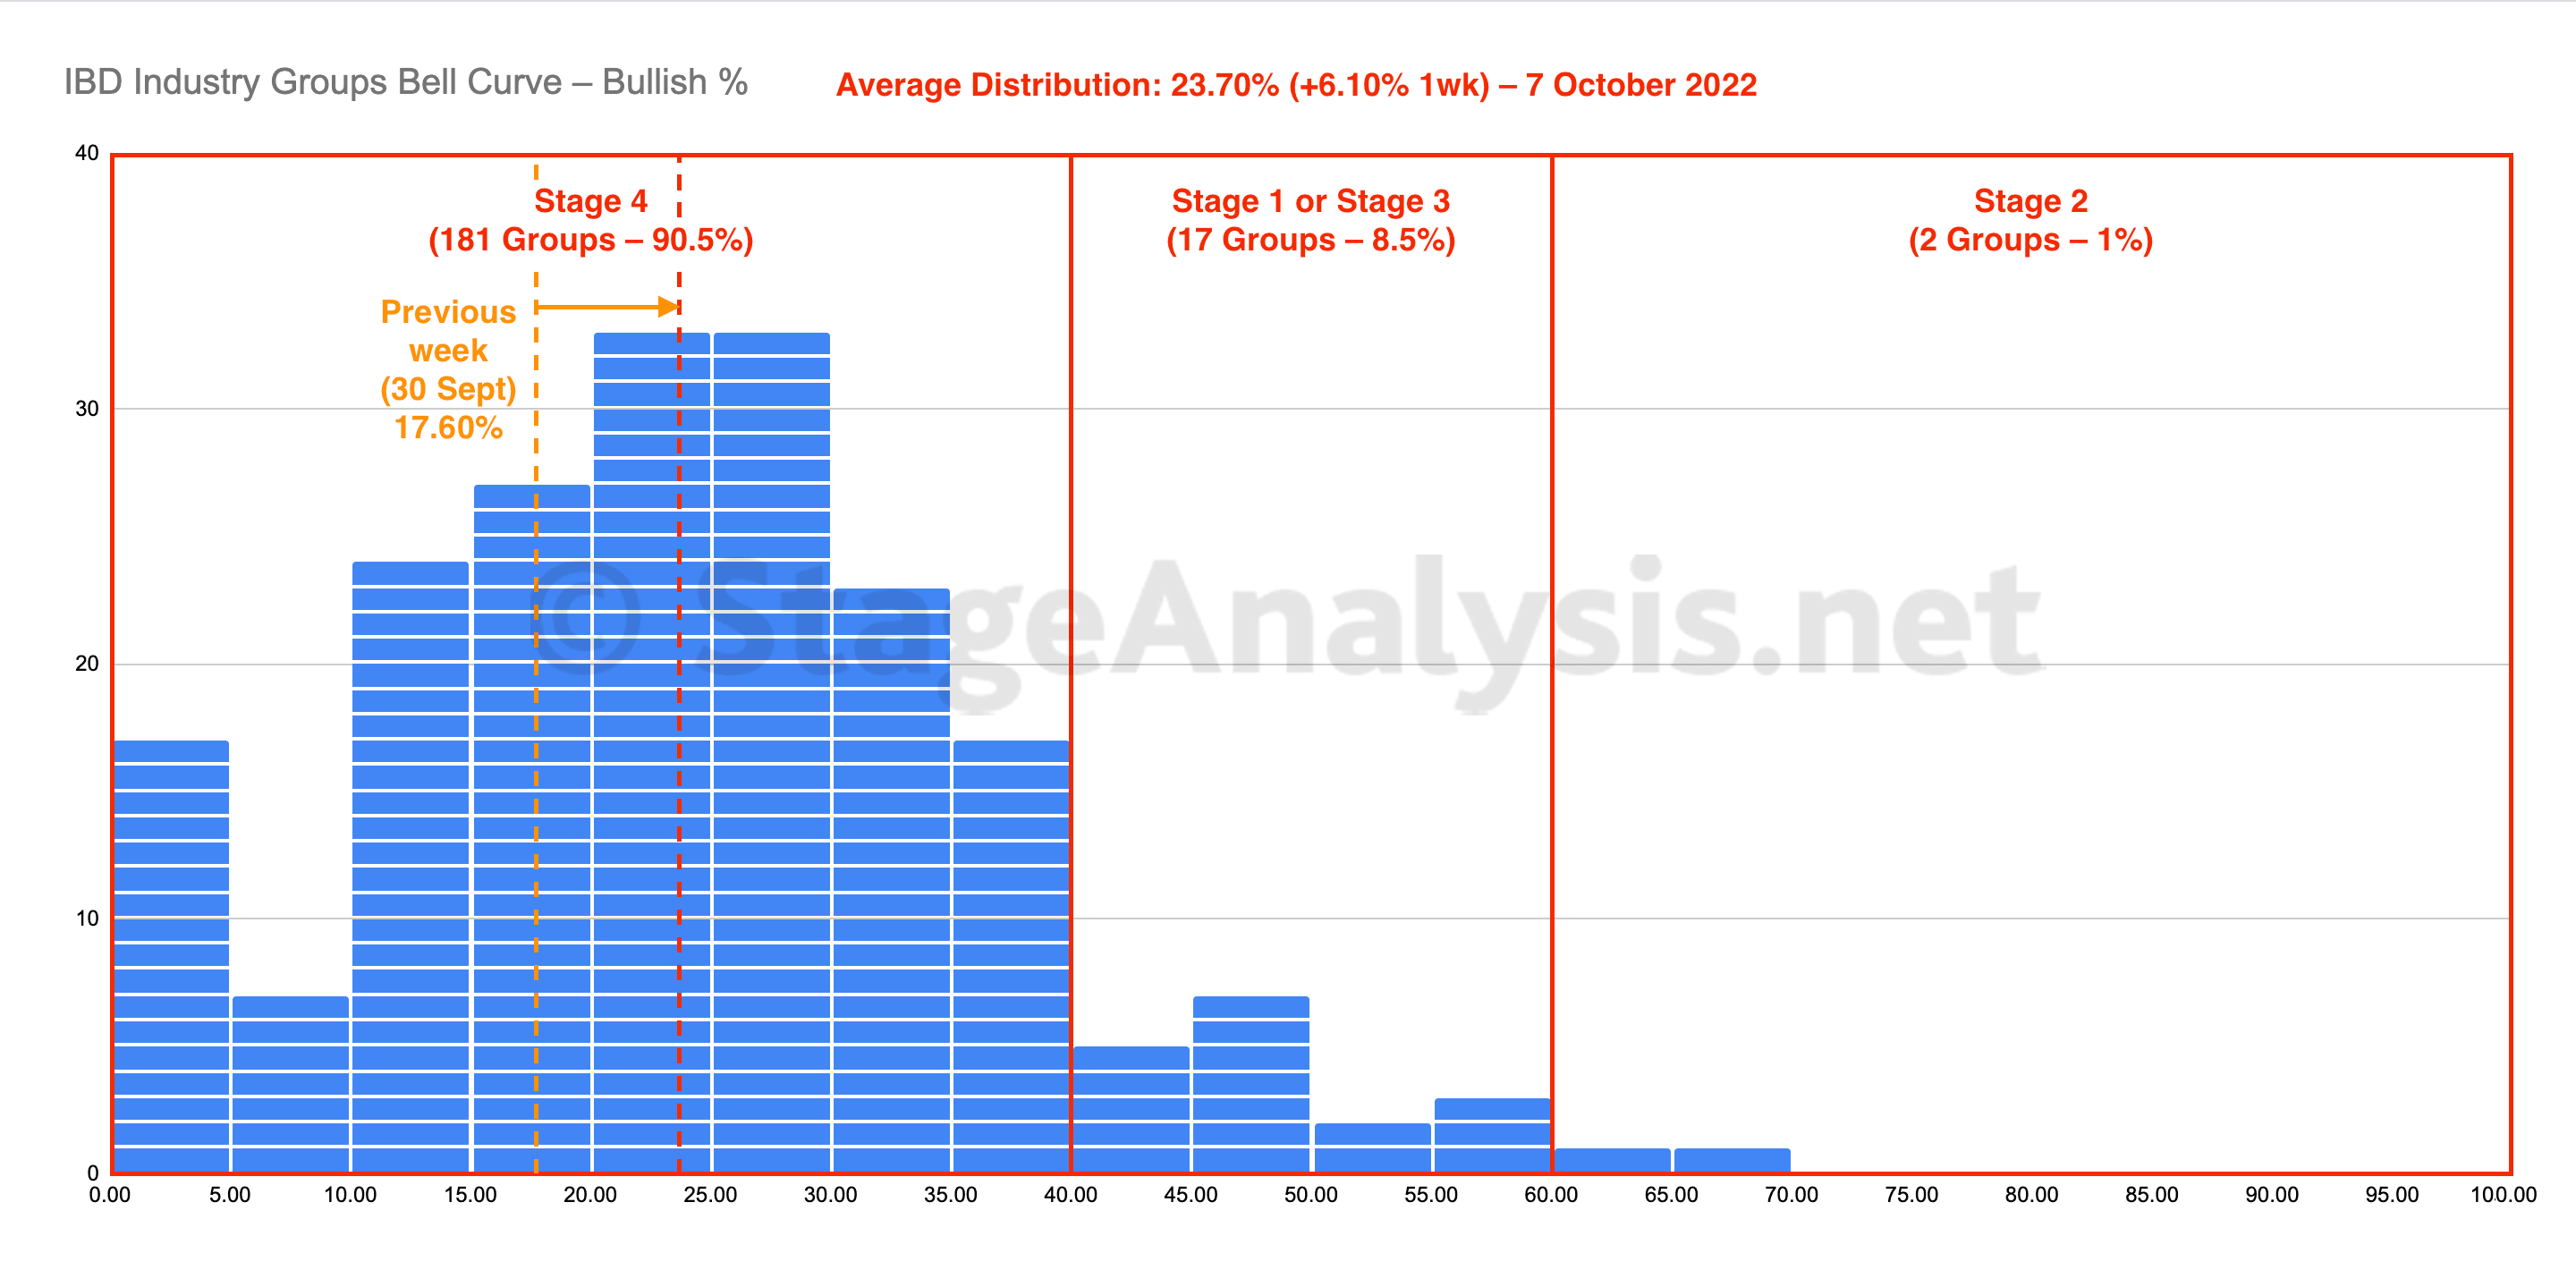
IBD Industry Groups Bell Curve – Bullish Percent
The IBD Industry Groups Bell Curve – Bullish Percent recovered from the previous weeks, year to date low and gained +6.10%, to close the week at 23.70%. The vast majority of groups (90.5%) are still in the Stage 4 zone (below the 40% level), but the amount in Stage 4 decreased by 5%...
Read More
08 October, 2022
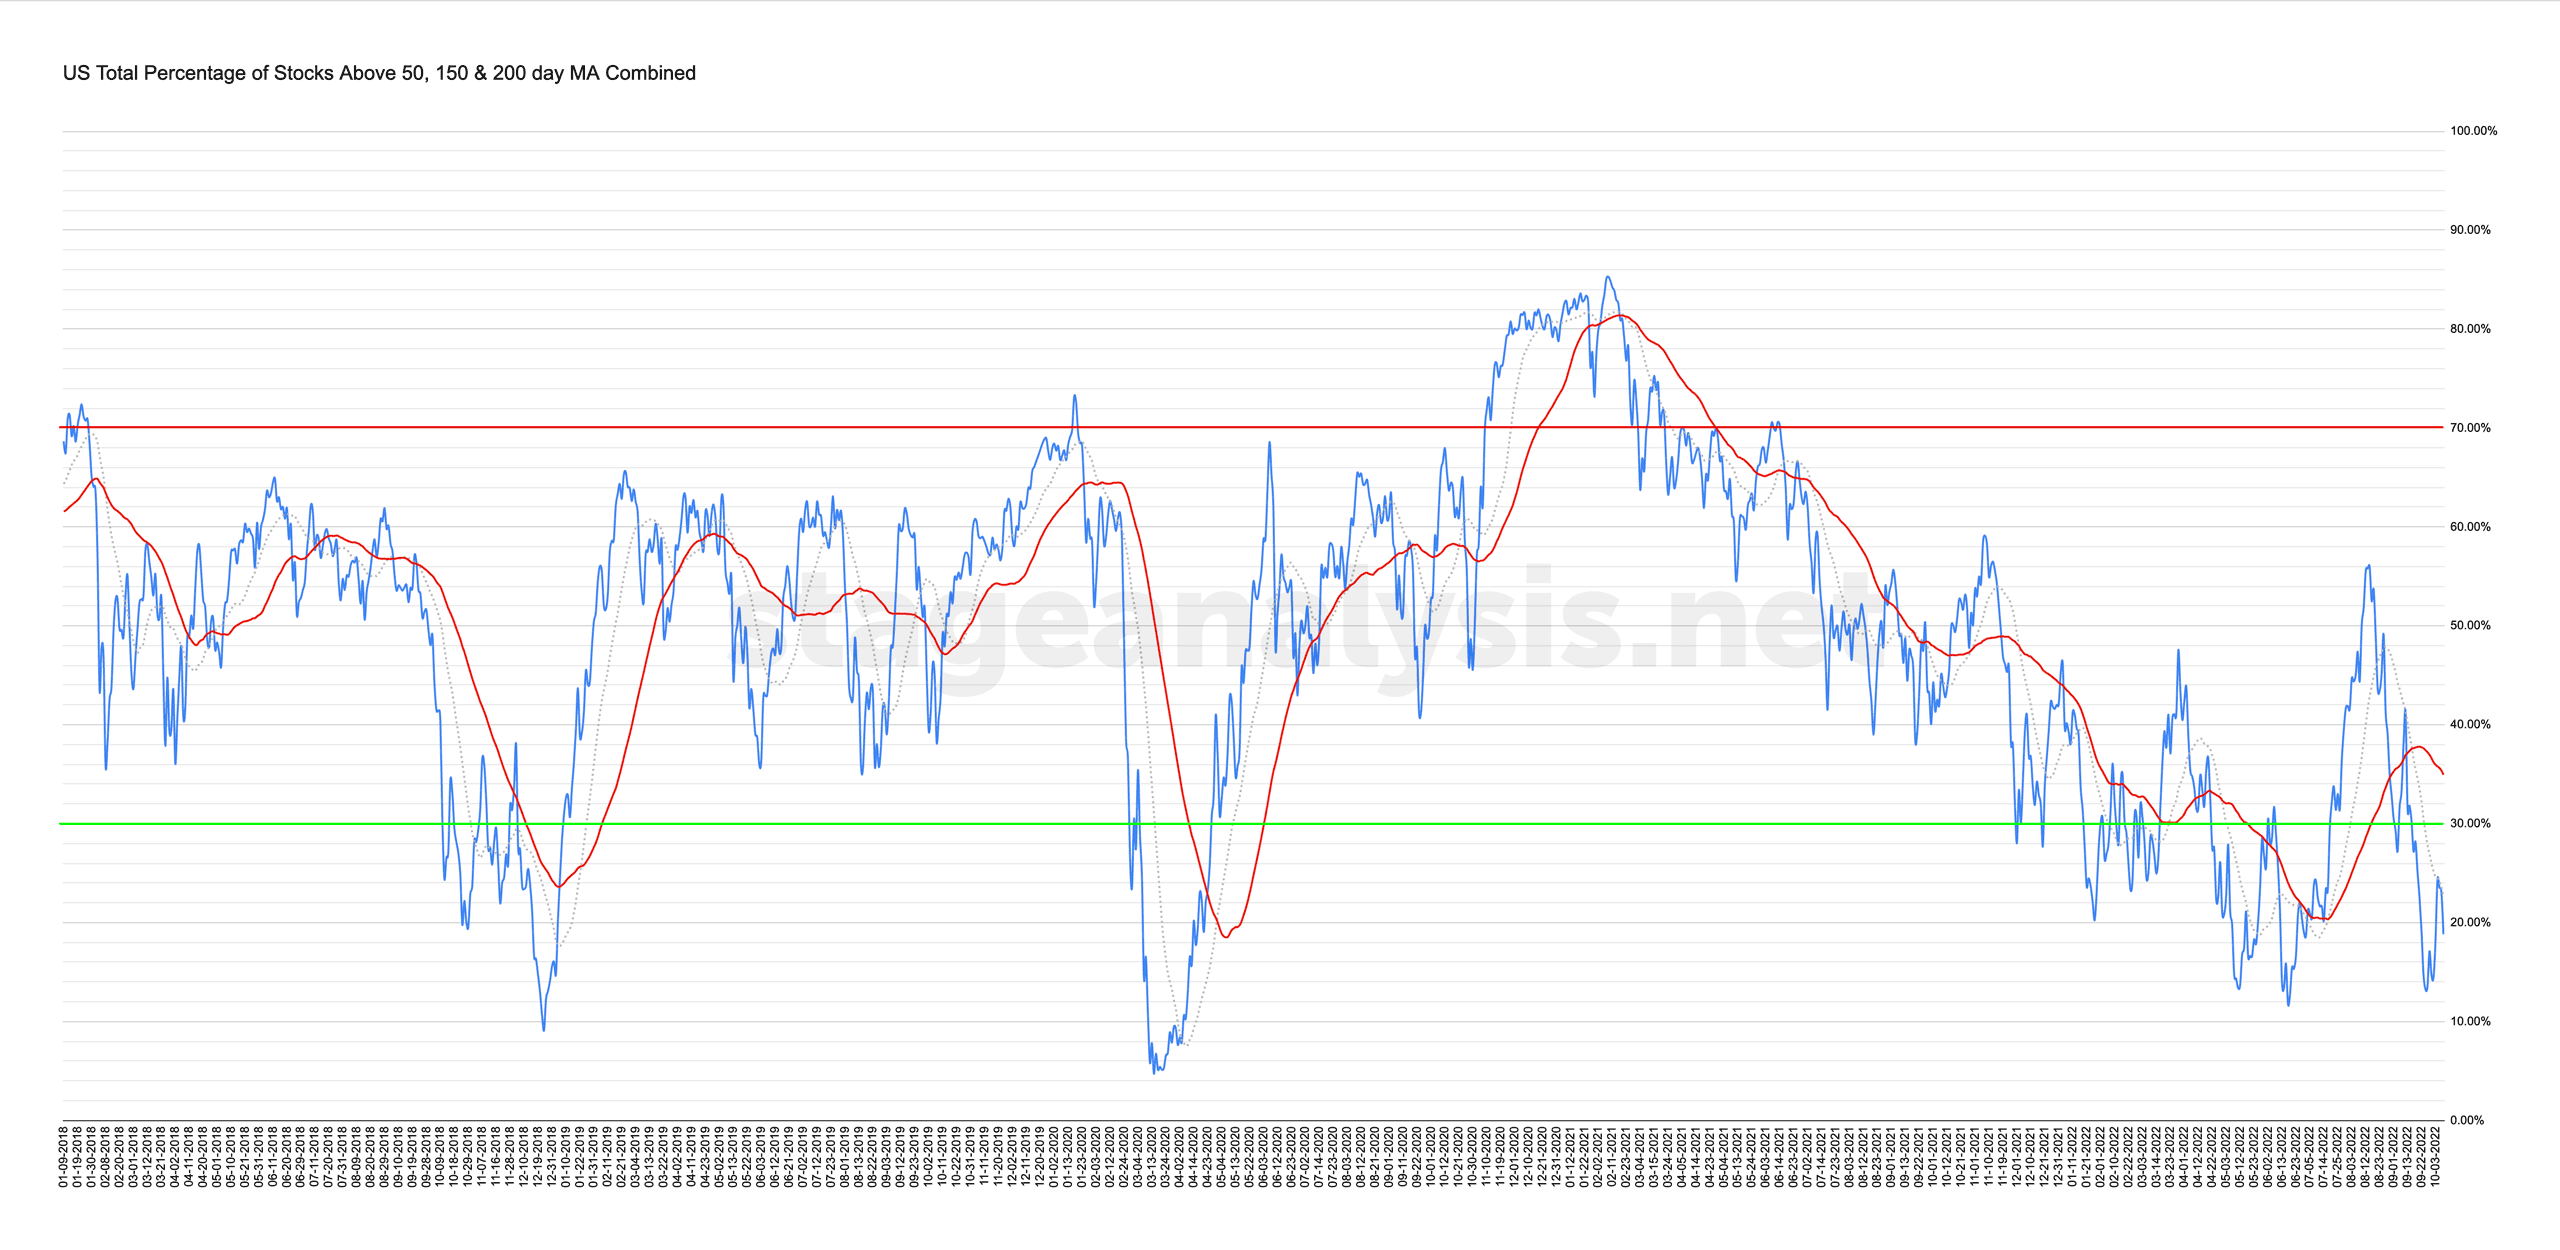
Market Breadth: Percentage of Stocks Above their 50 Day, 150 Day & 200 Day Moving Averages Combined
Custom Percentage of Stocks Above Their 50 Day, 150 Day & 200 Day Moving Averages Combined Market Breadth Charts for the Overall US Market, NYSE and Nasdaq for Market Timing and Strategy.
Read More
08 October, 2022
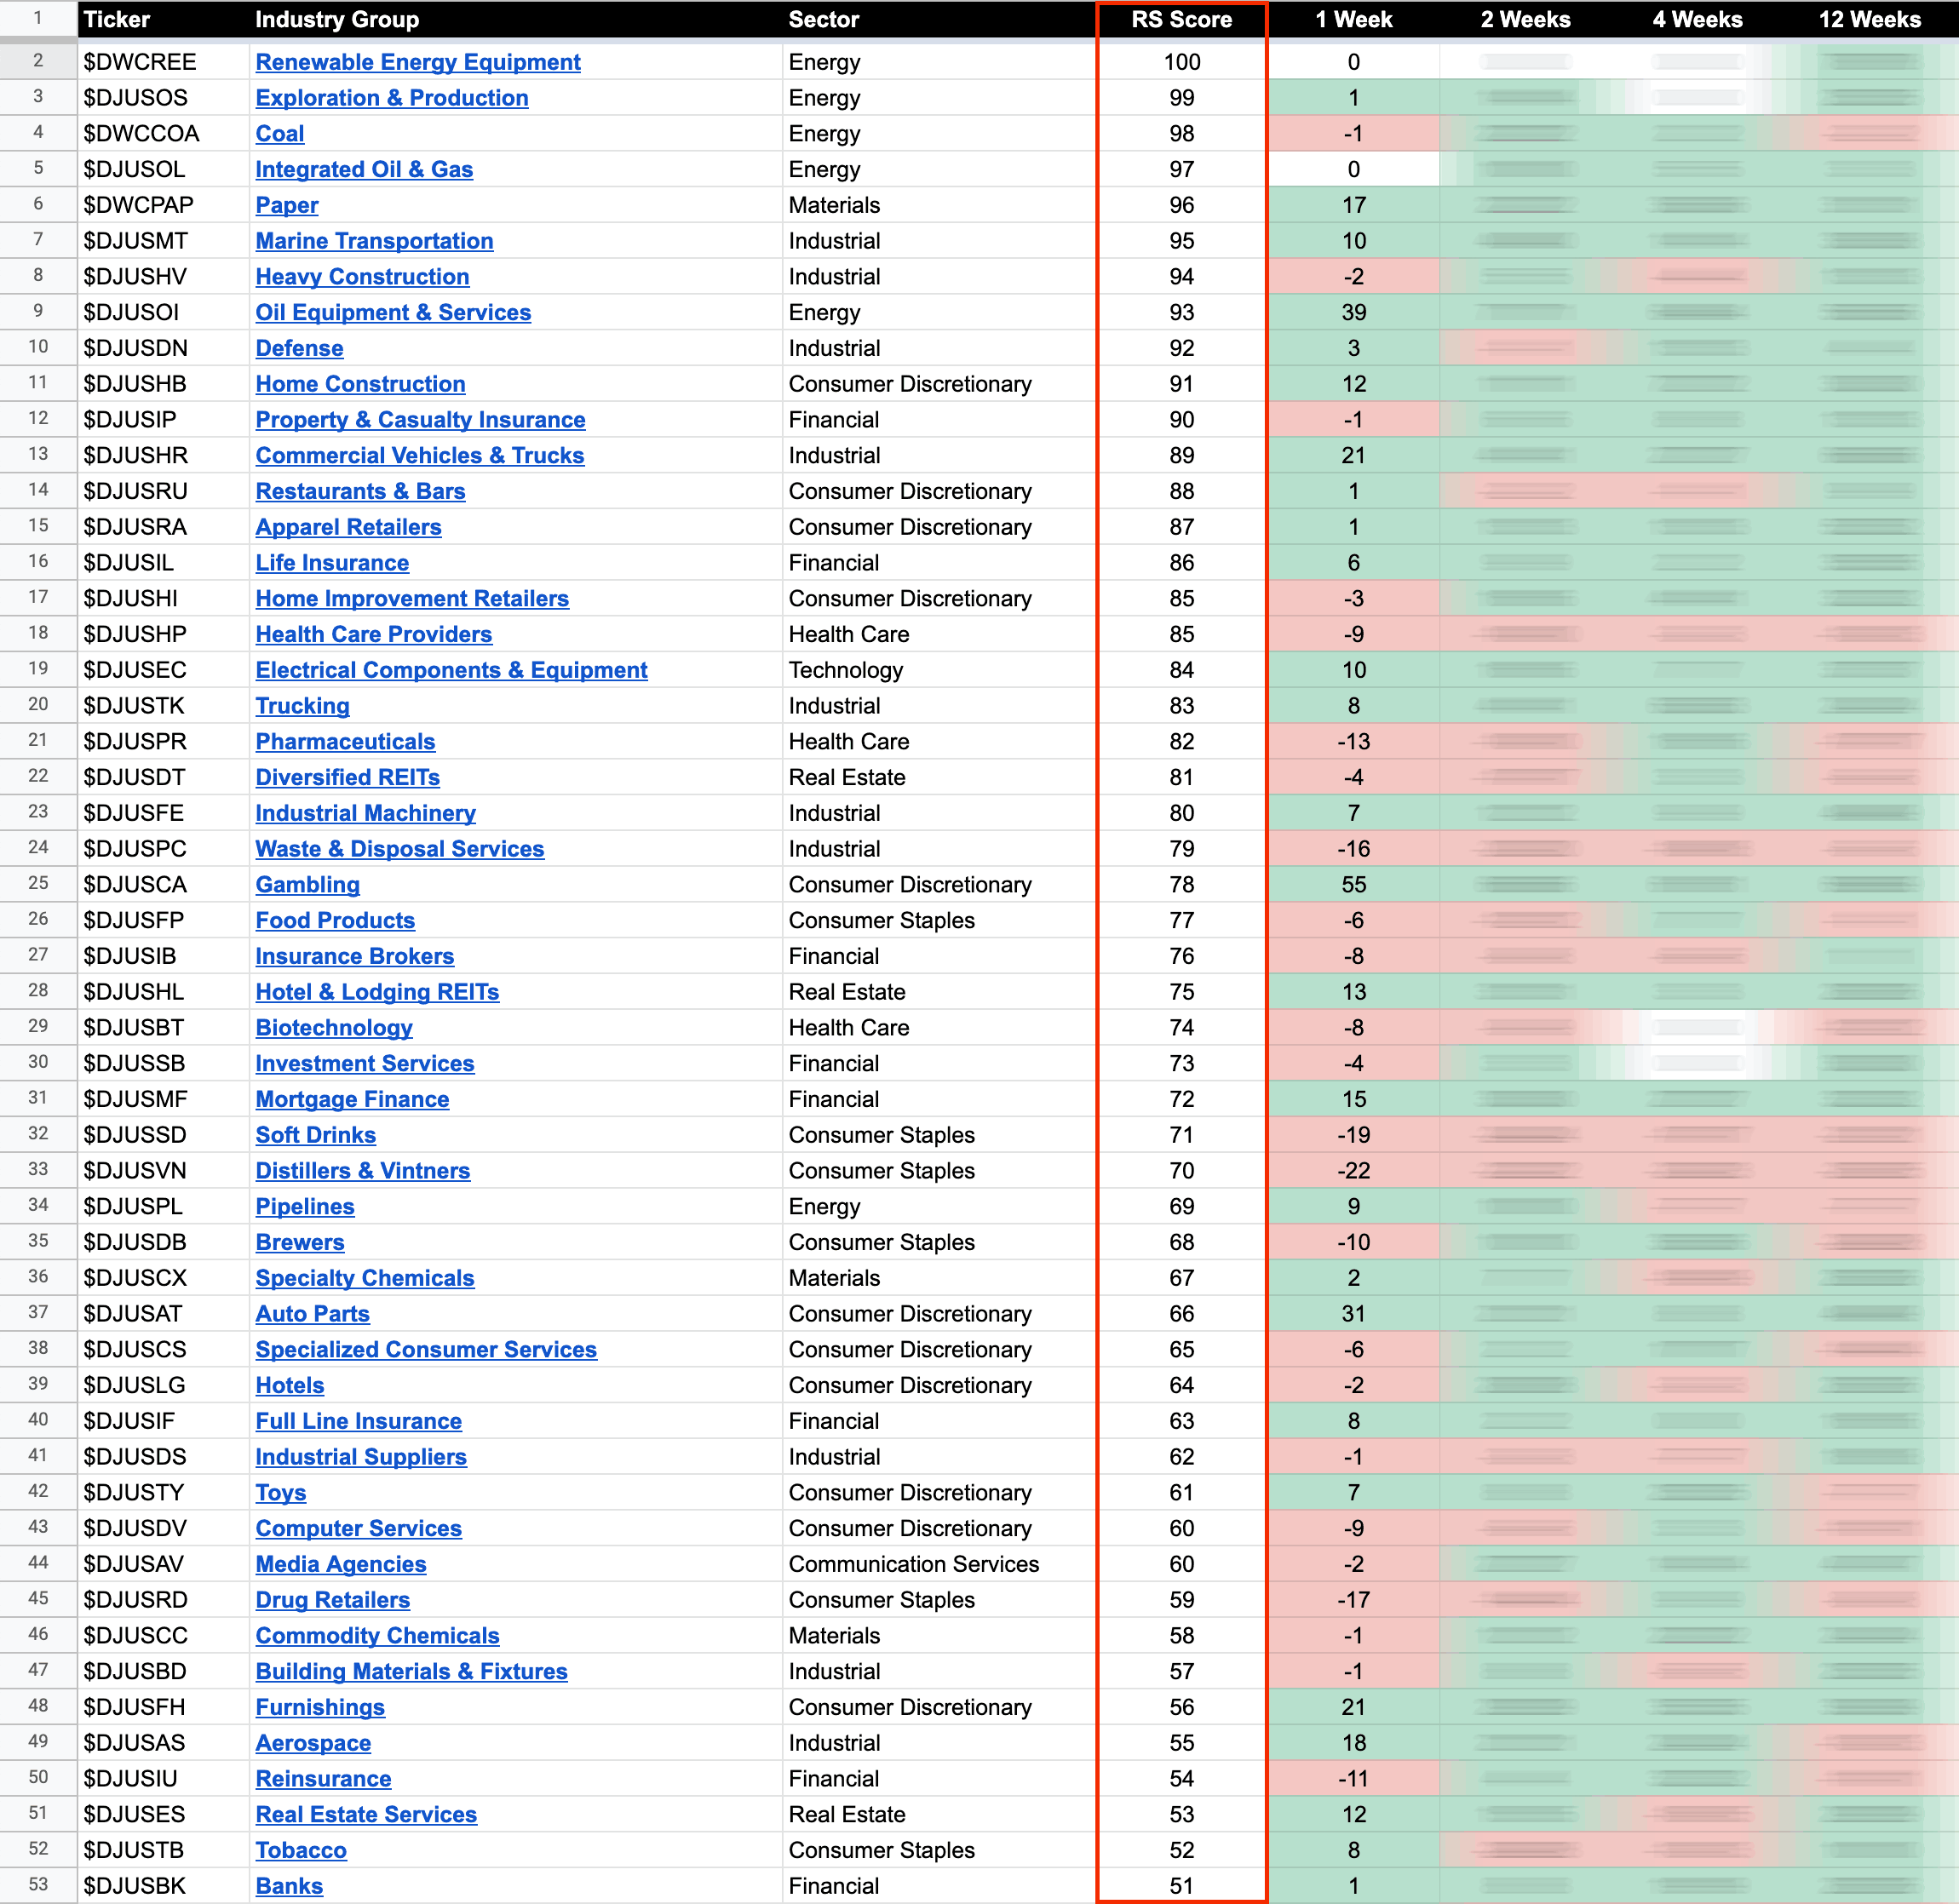
US Stocks Industry Groups Relative Strength Rankings
The purpose of the Relative Strength (RS) tables is to track the short, medium and long term RS changes of the individual groups to find the new leadership earlier than the crowd...
Read More
06 October, 2022
Stage Analysis Members Midweek Video – 6 October 2022 (48mins)
The members midweek video discussing the market, short-term market breadth and individual stocks from the watchlist in more detail.
Read More
05 October, 2022
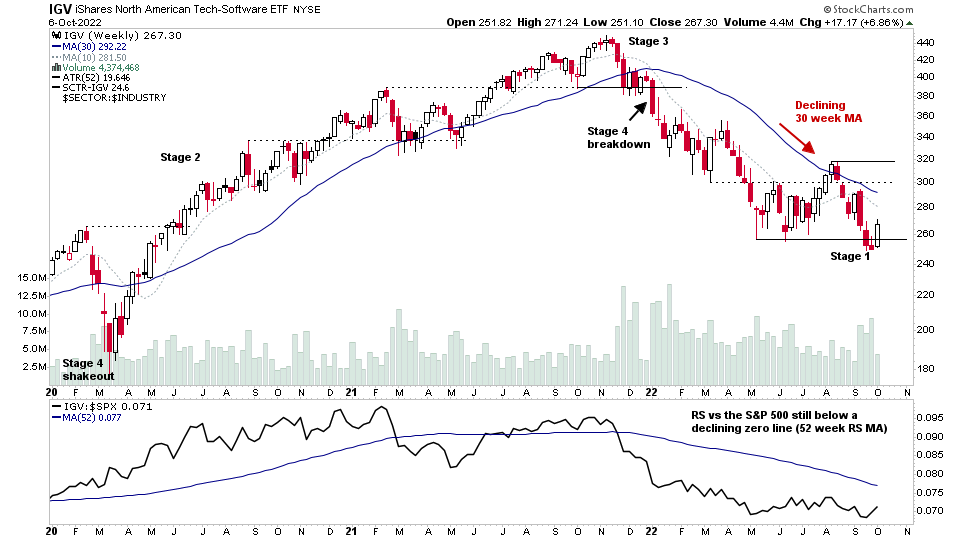
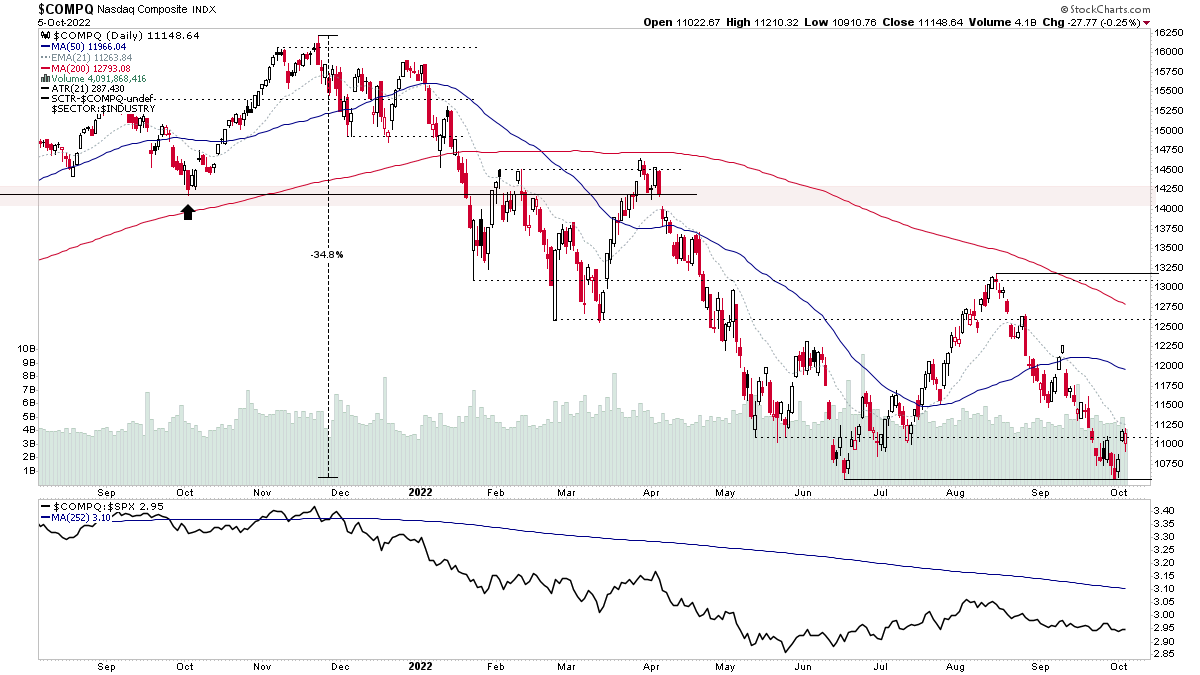
Stock Market Update and the US Stocks Watchlist – 5 October 2022
I've led with the Nasdaq Composite in todays post as the watchlist is once again dominated by Software stocks, as numerous stocks in the group continue to develop Stage 1 base structures, and the majority of Software/Technology stocks are listed in the Nasdaq.
Read More