This is the first post of a new weekly regular feature focusing on some of the most vulnerable issues in the US market, in order to get a broader picture of the overall market health and contribute valuable information to our Weight of Evidence – which is the key to successfully using Stan Weinstein's Stage Analysis method.
Read More

Blog
15 December, 2022
Most Vulnerable US Stocks & ETFs – 15 December 2022
14 December, 2022
Stage Analysis Members Video – 14 December 2022 (1hr 2 mins)
The Stage Analysis members midweek video discussing the S&P 500, VIX and the Dollar Index, short-term market breadth indicators and the US watchlist stocks in more detail with live markups of the individual stocks and group themes.
Read More
14 December, 2022
US Stocks Watchlist – 14 December 2022
I'll talk through the watchlist stocks and group themes from the last few days in detail on multiple timeframes during the Stage Analysis midweek video, which will be posted later today (Wednesday).
Read More
13 December, 2022
US Stocks Watchlist – 13 December 2022
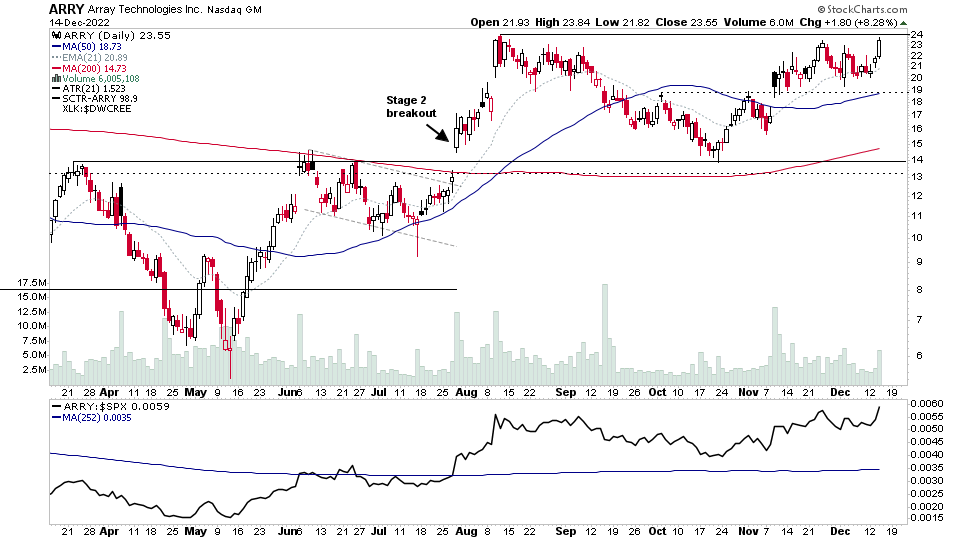
Semiconductors continues to be the main group theme with more stocks in the group testing the Stage 2 breakout level today, but pulling back with the intraday market weakness.
Read More
12 December, 2022
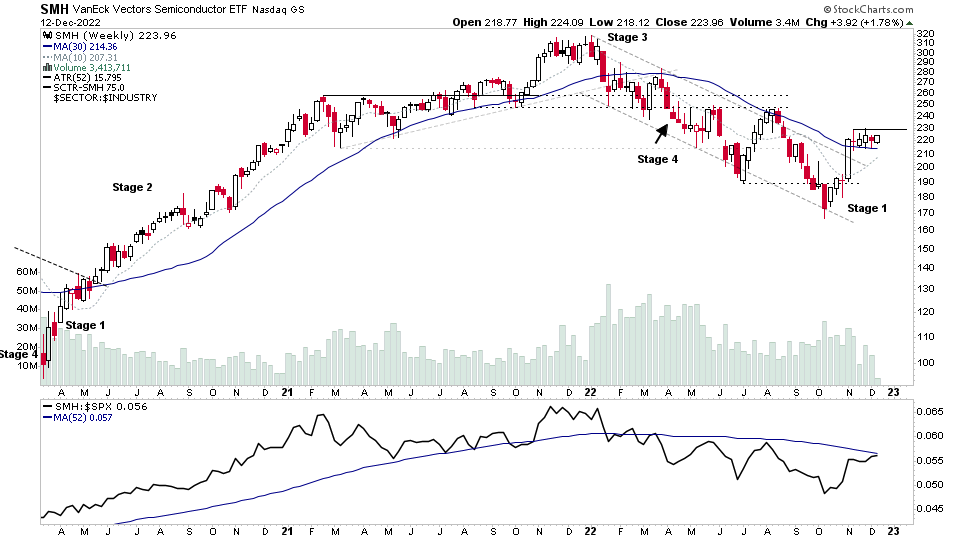
US Stocks Watchlist – 12 December 2022
Technology, Industrial and Consumer Discretionary sector groups make up the bulk of todays highlighted stocks, with Semiconductors having the most results, including the group etf – SMH, which has been consolidating above its 30 week MA for the last 6 weeks now, and the 30 week MA has started to flatten out, and the Stage Analysis Technical Attributes (SATA) score has improved to a 6. Hence, the group is in position for a potential Stage 2 breakout attempt if market conditions are favourable.
Read More
11 December, 2022
Stage Analysis Members Video – 11 December 2022 (1hr 5mins)
The Stage Analysis members weekend video discussing the market breadth charts to determine the weight of evidence, IBD industry group bell curve – percentage above 30 week MA and the bullish percent, industry groups relative strength, market indexes, and the US watchlist stocks in detail on multiple timeframes.
Read More
10 December, 2022
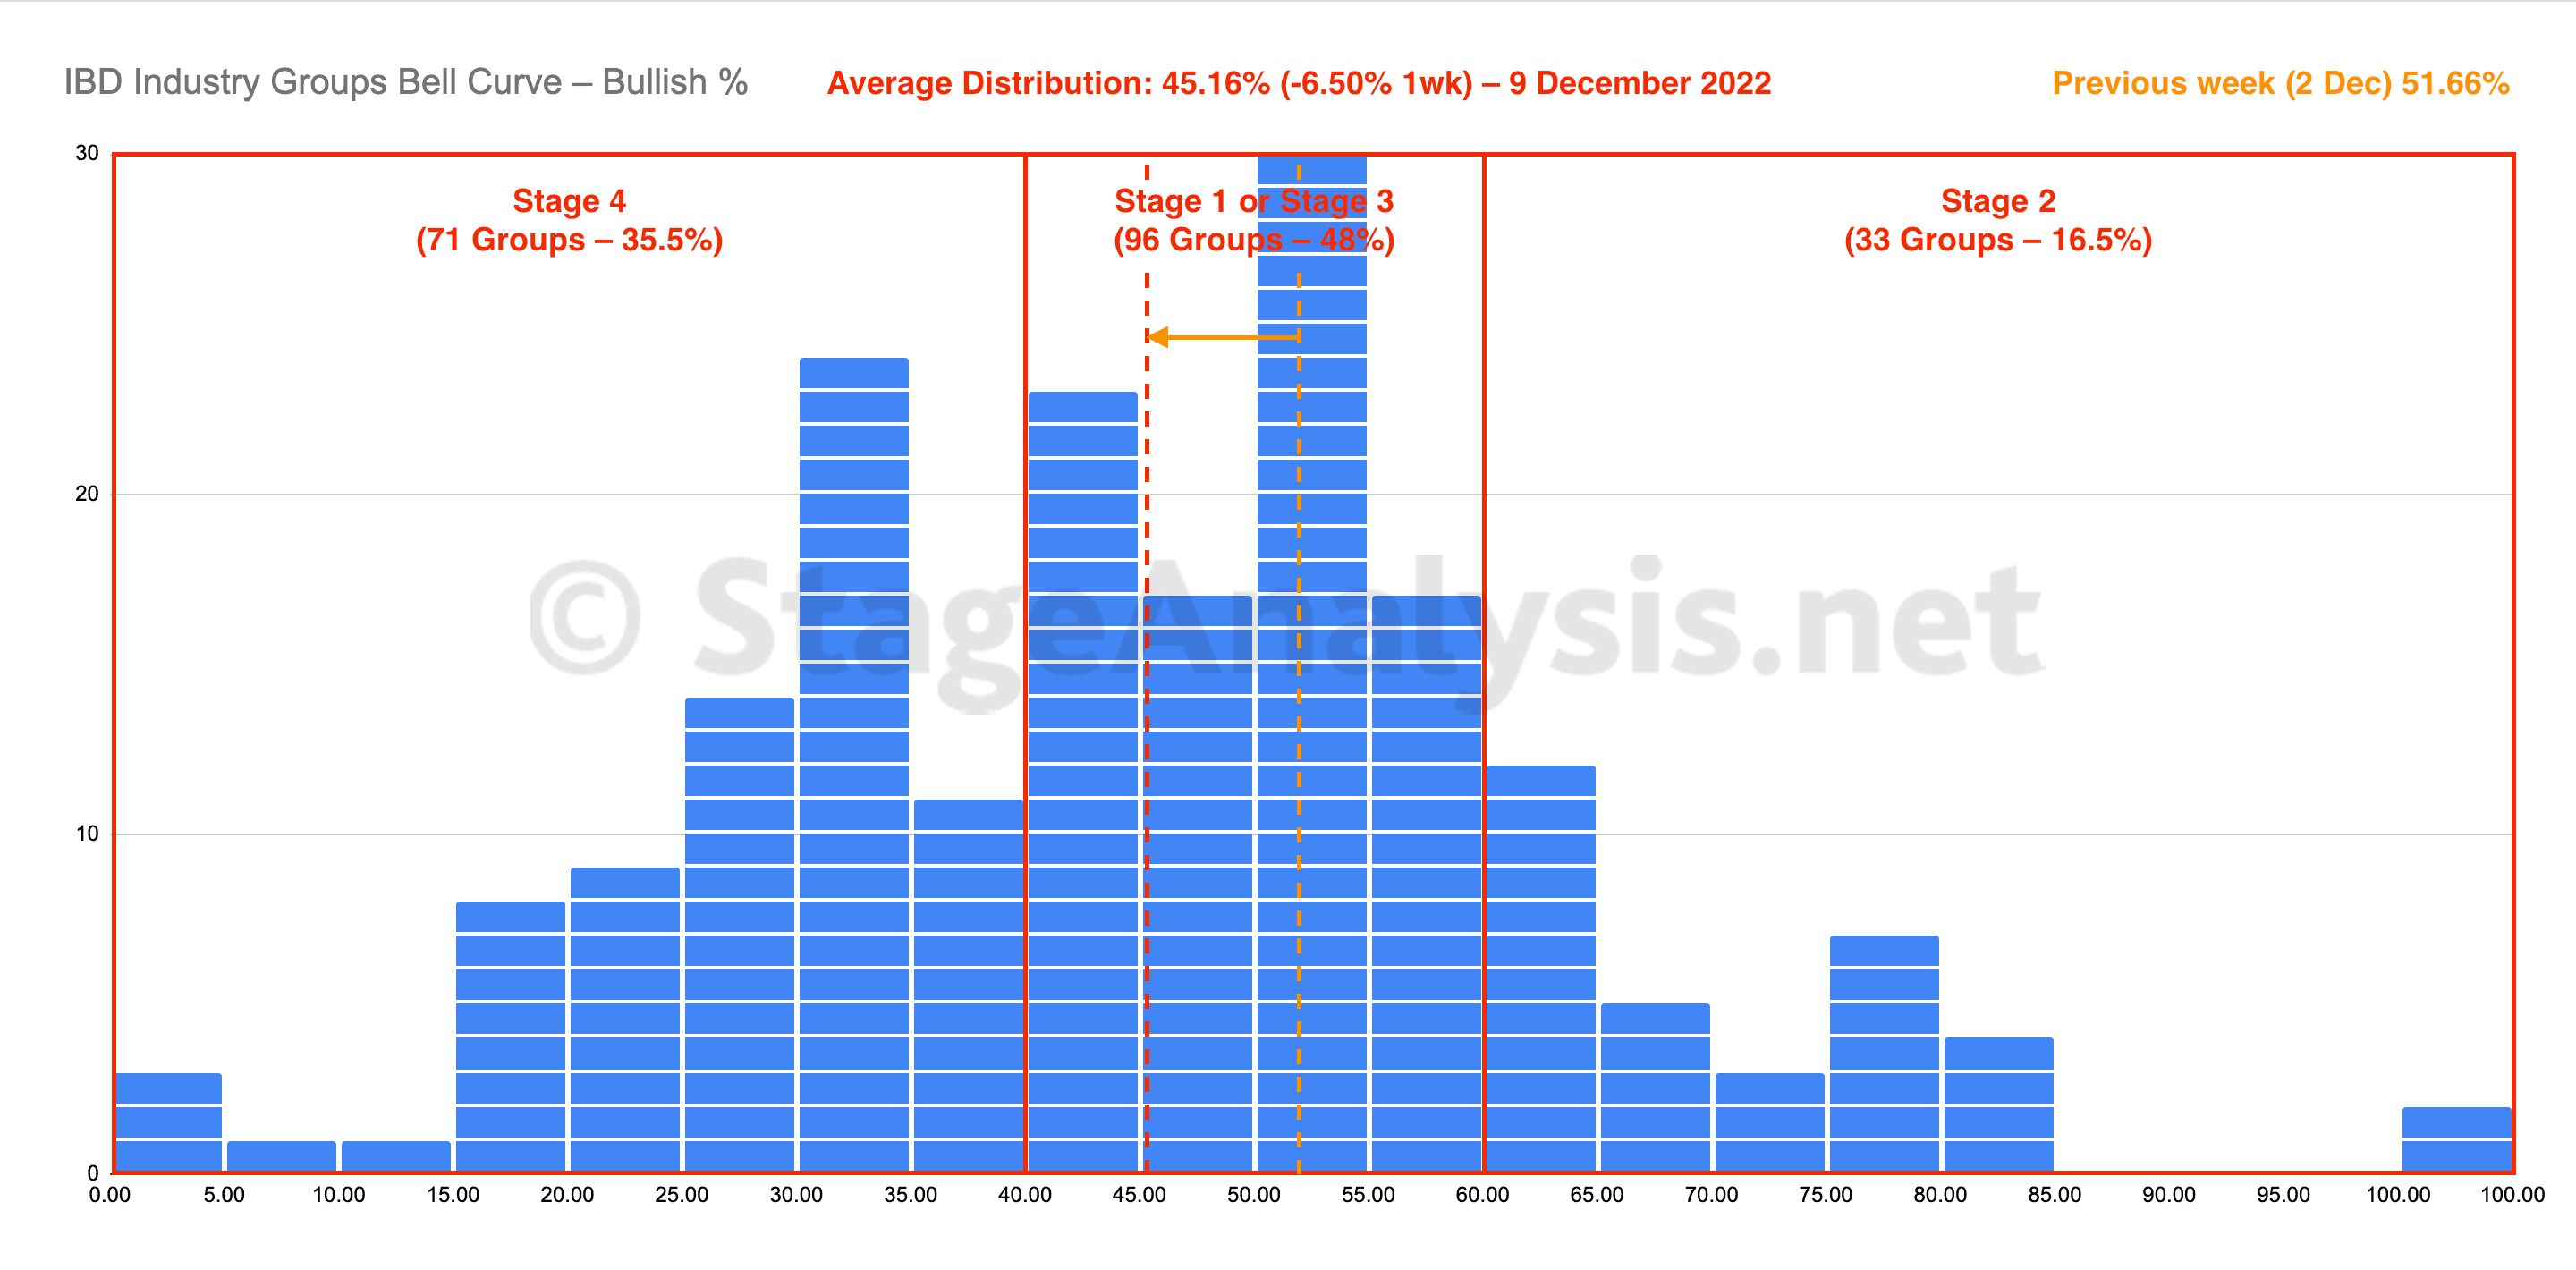
IBD Industry Groups Bell Curve – Bullish Percent
The IBD Industry Groups Bell Curve declined by -6.50% this week, dropping back into the lower half of the Stage 1 zone (between 40% and 60%). The amount of groups in Stage 4 increased by +22 (+11%), and the amount of groups in Stage 2 decreased by -31 (-15.5%), while the amount groups in Stage 1 or Stage 3 increased by +9 (+4.5%).
Read More
10 December, 2022
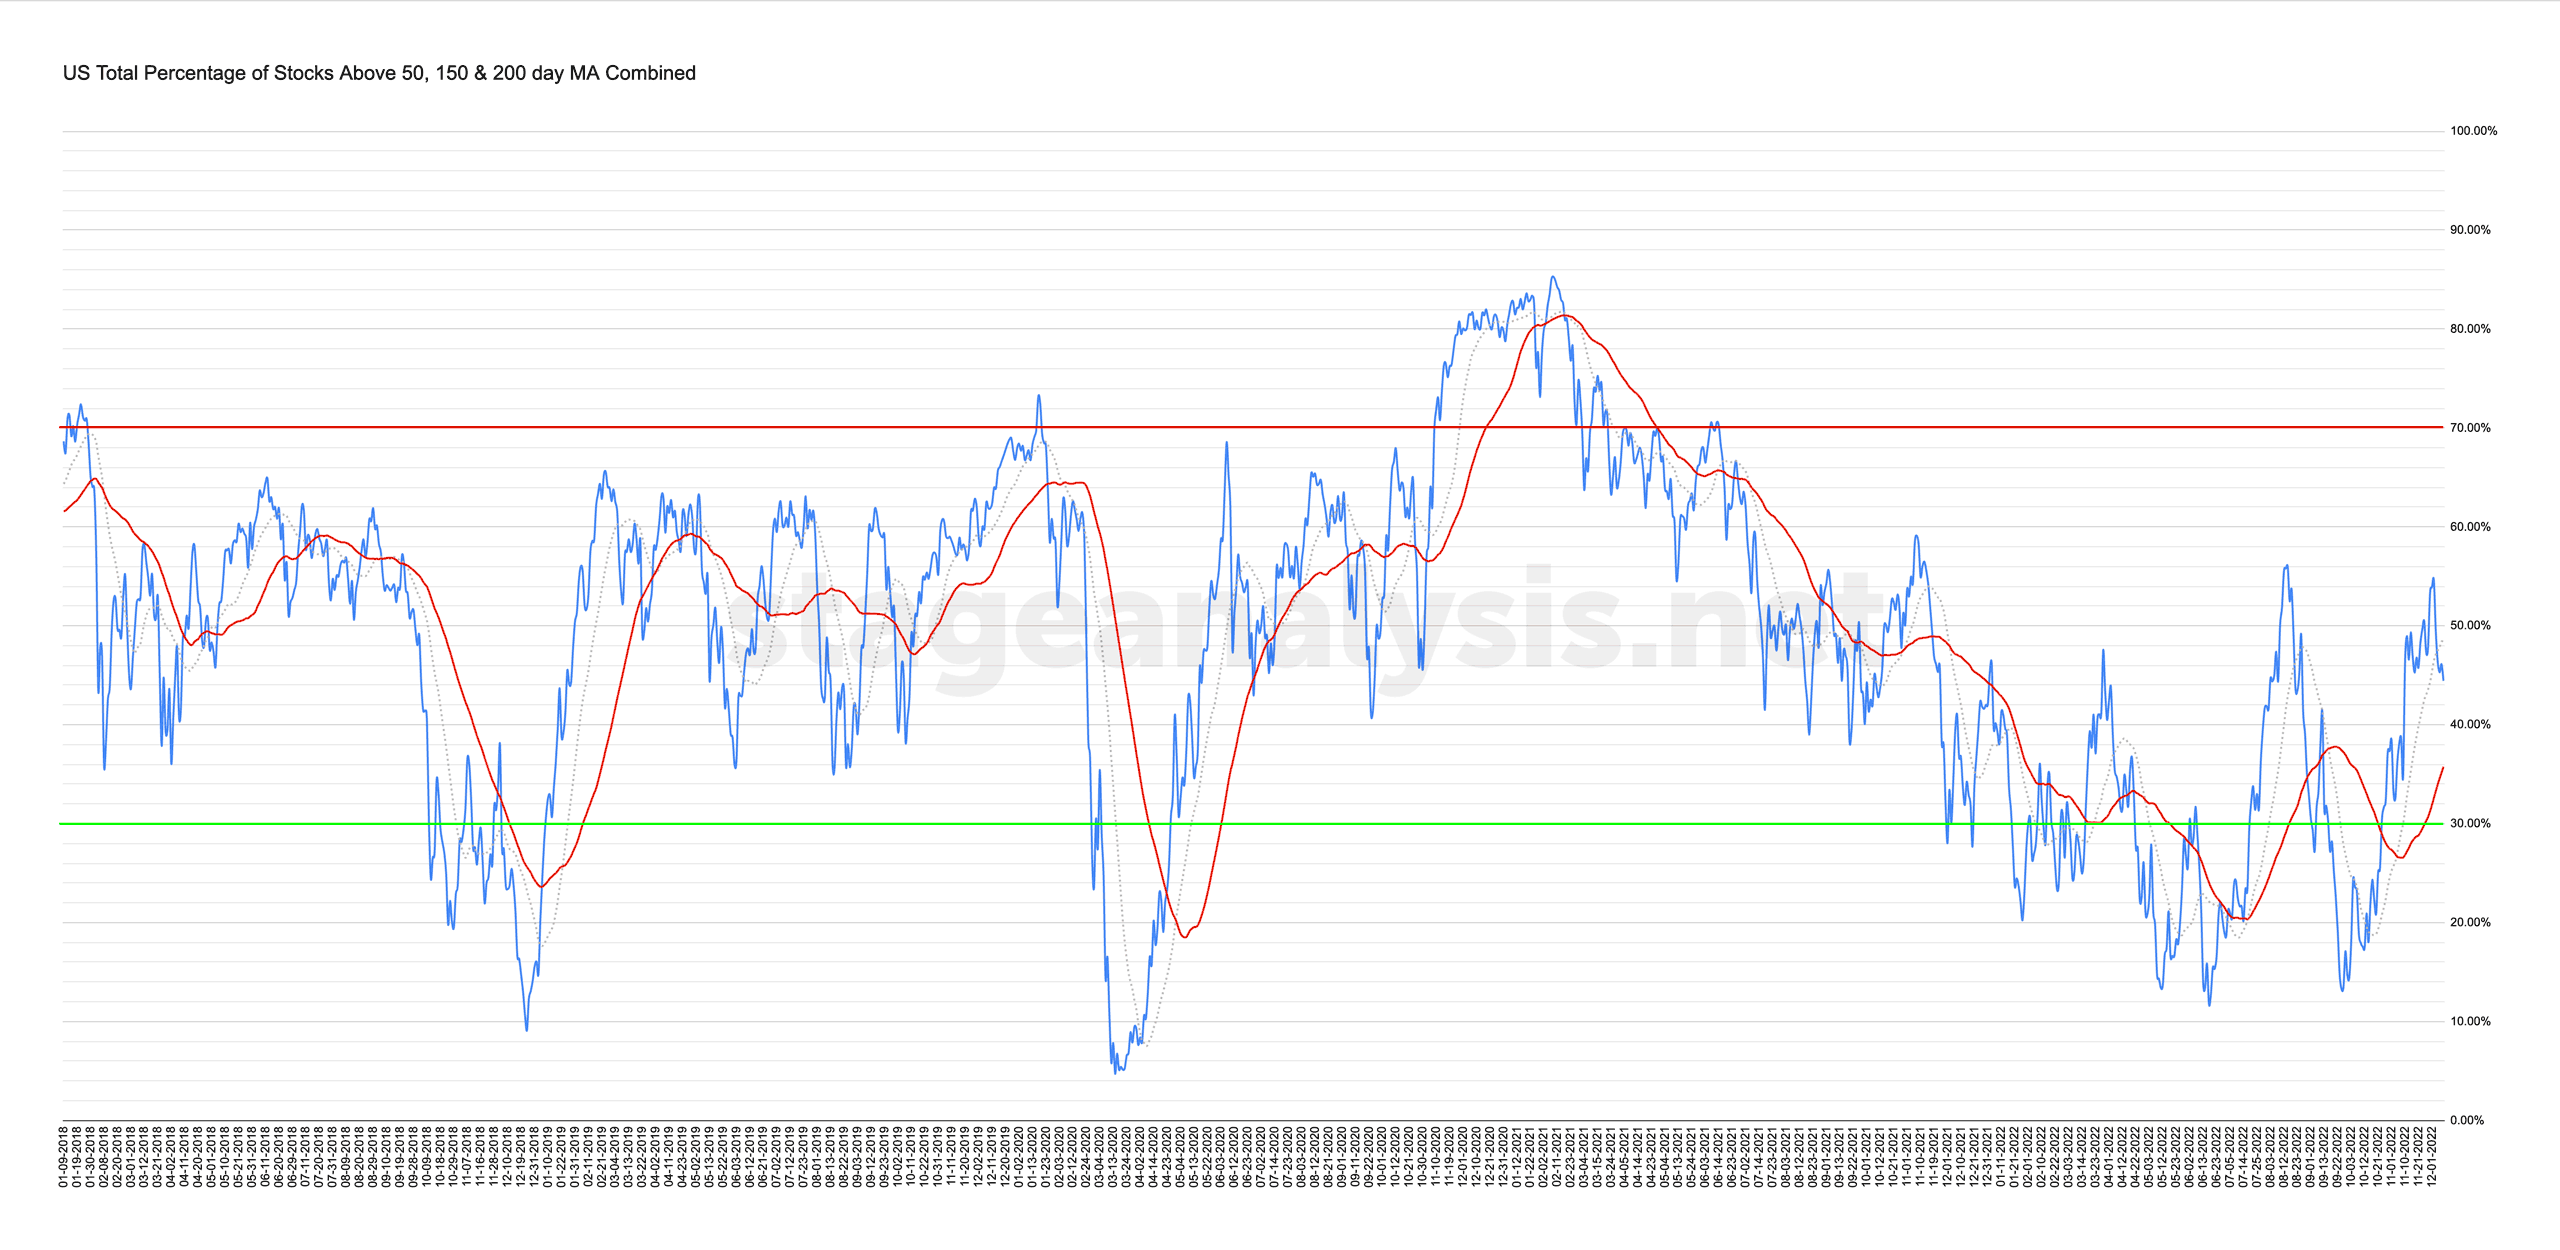
Market Breadth: Percentage of Stocks Above their 50 Day, 150 Day & 200 Day Moving Averages Combined
Custom Percentage of Stocks Above Their 50 Day, 150 Day & 200 Day Moving Averages Combined Market Breadth Charts for the Overall US Market, NYSE and Nasdaq for Market Timing and Strategy.
Read More
09 December, 2022
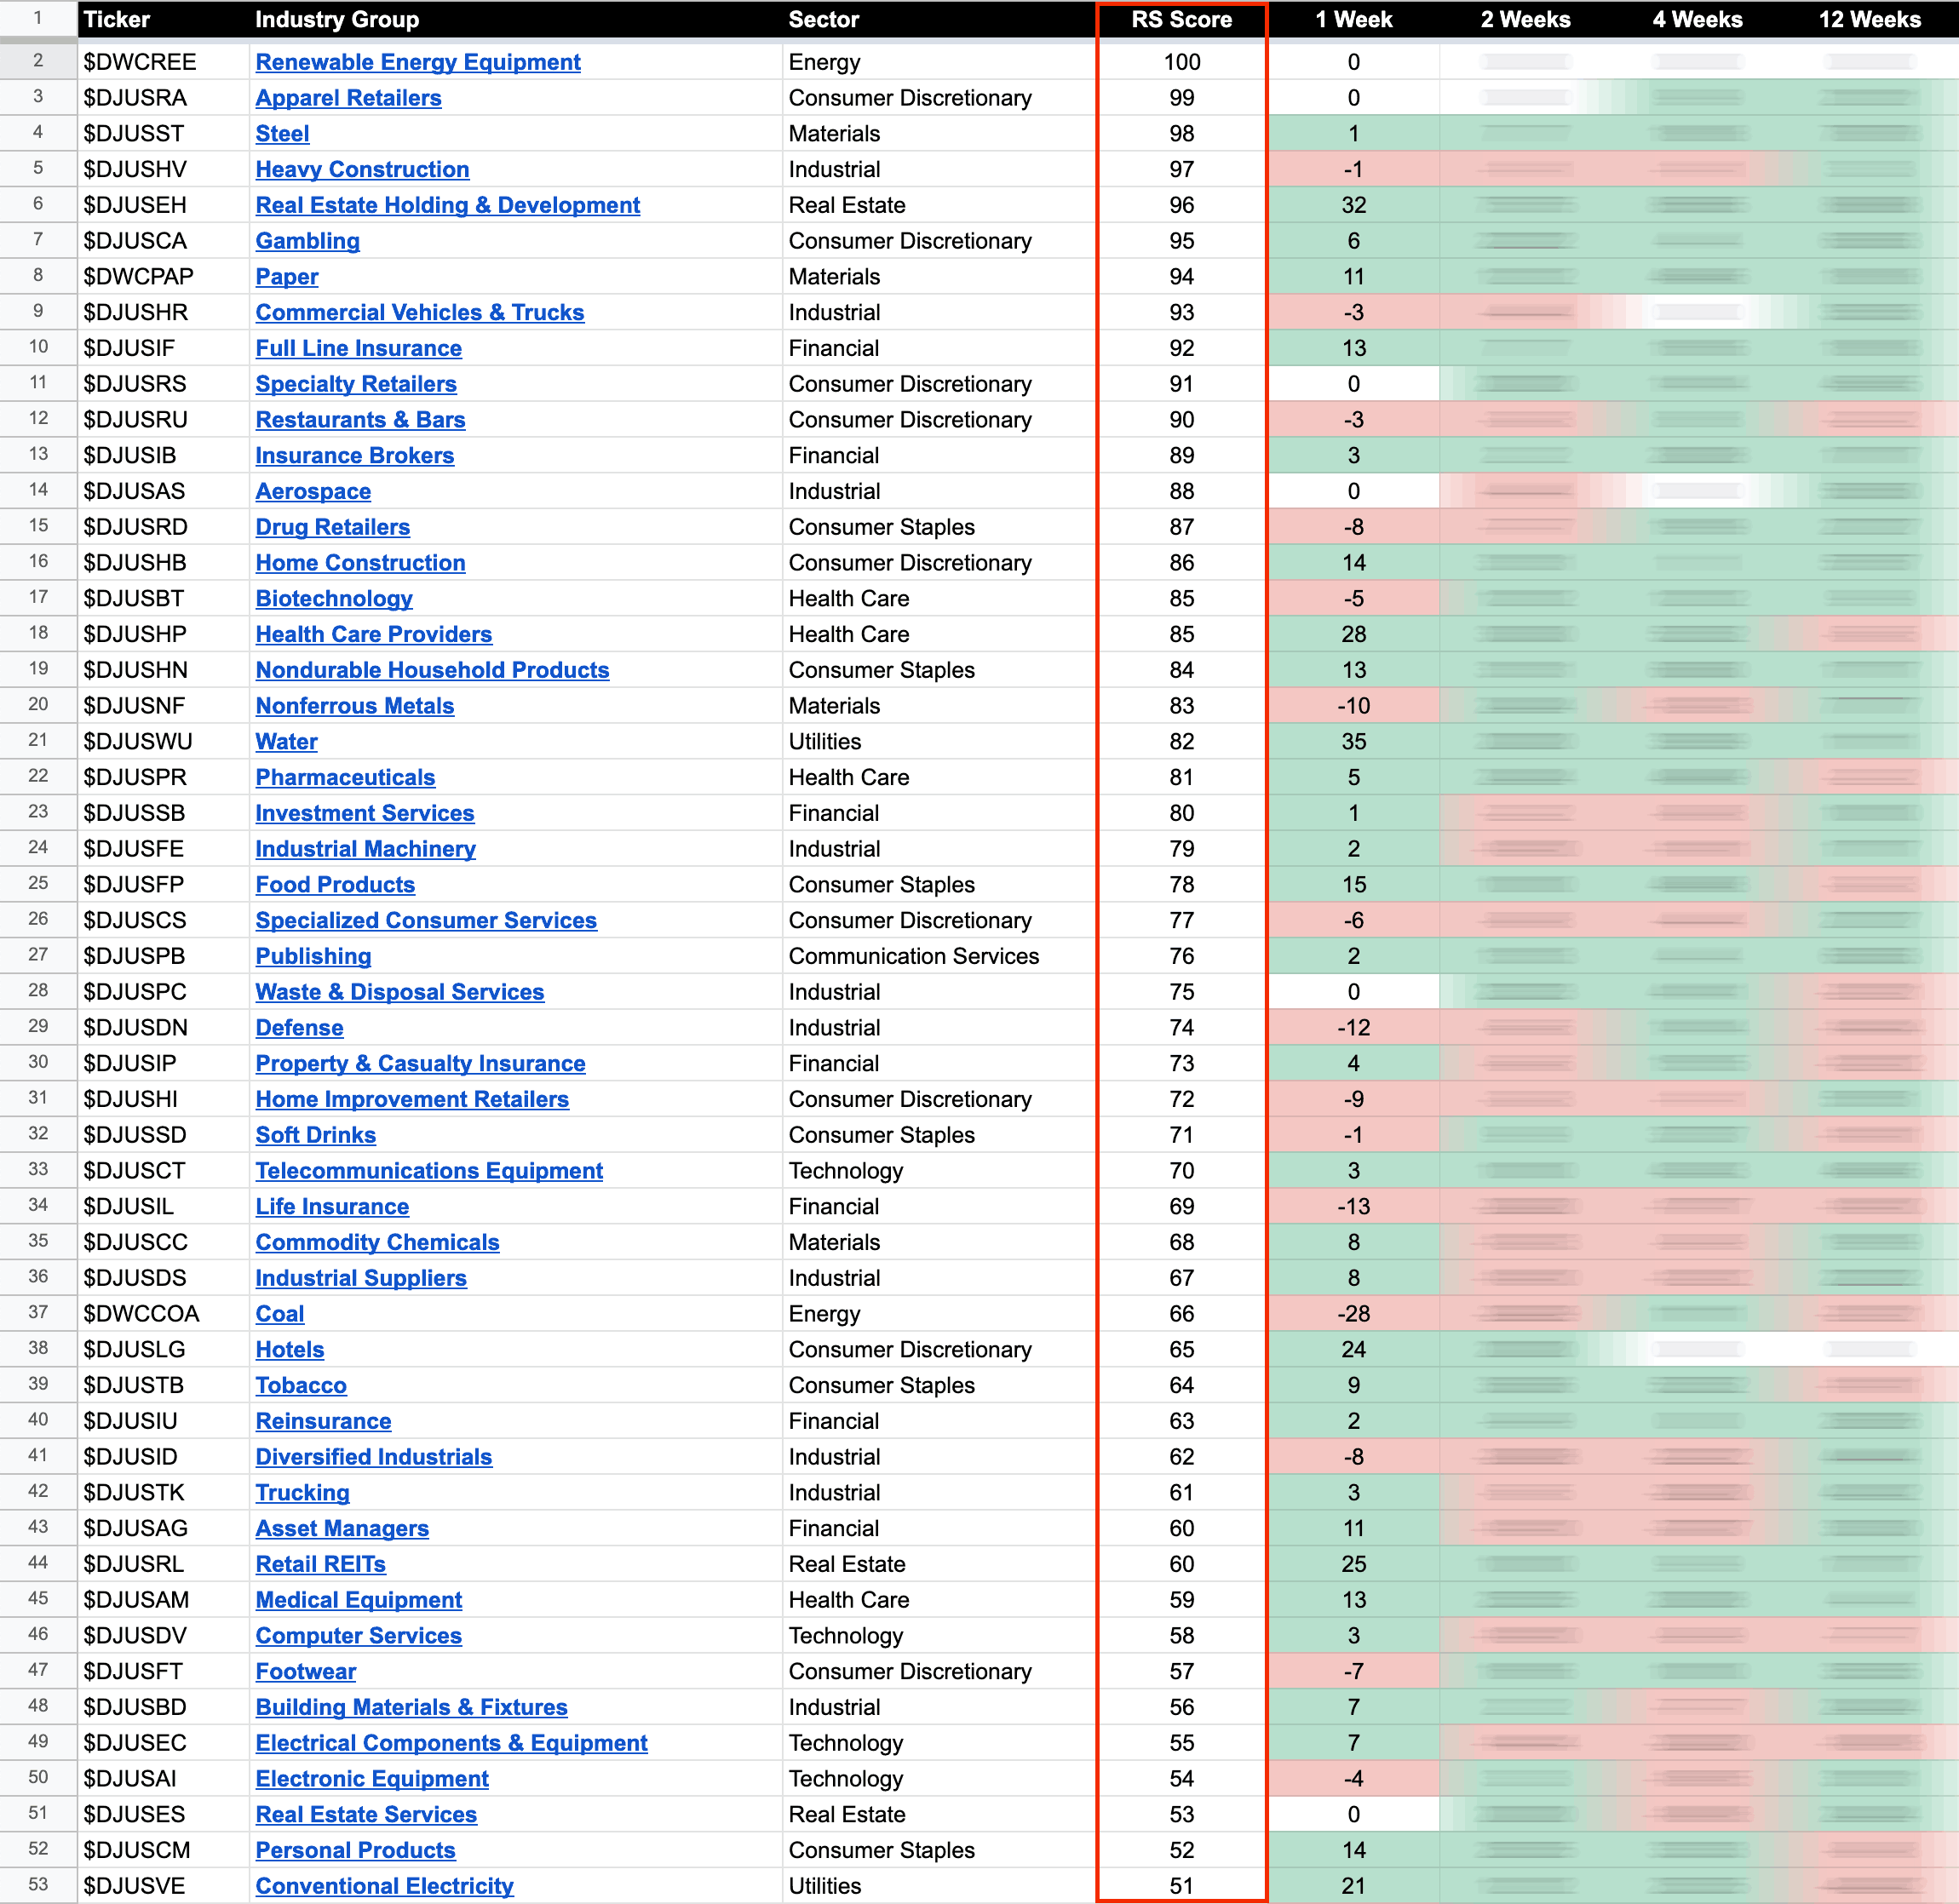
US Stocks Industry Groups Relative Strength Rankings
The purpose of the Relative Strength (RS) tables is to track the short, medium and long term RS changes of the individual groups to find the new leadership earlier than the crowd...
Read More
08 December, 2022
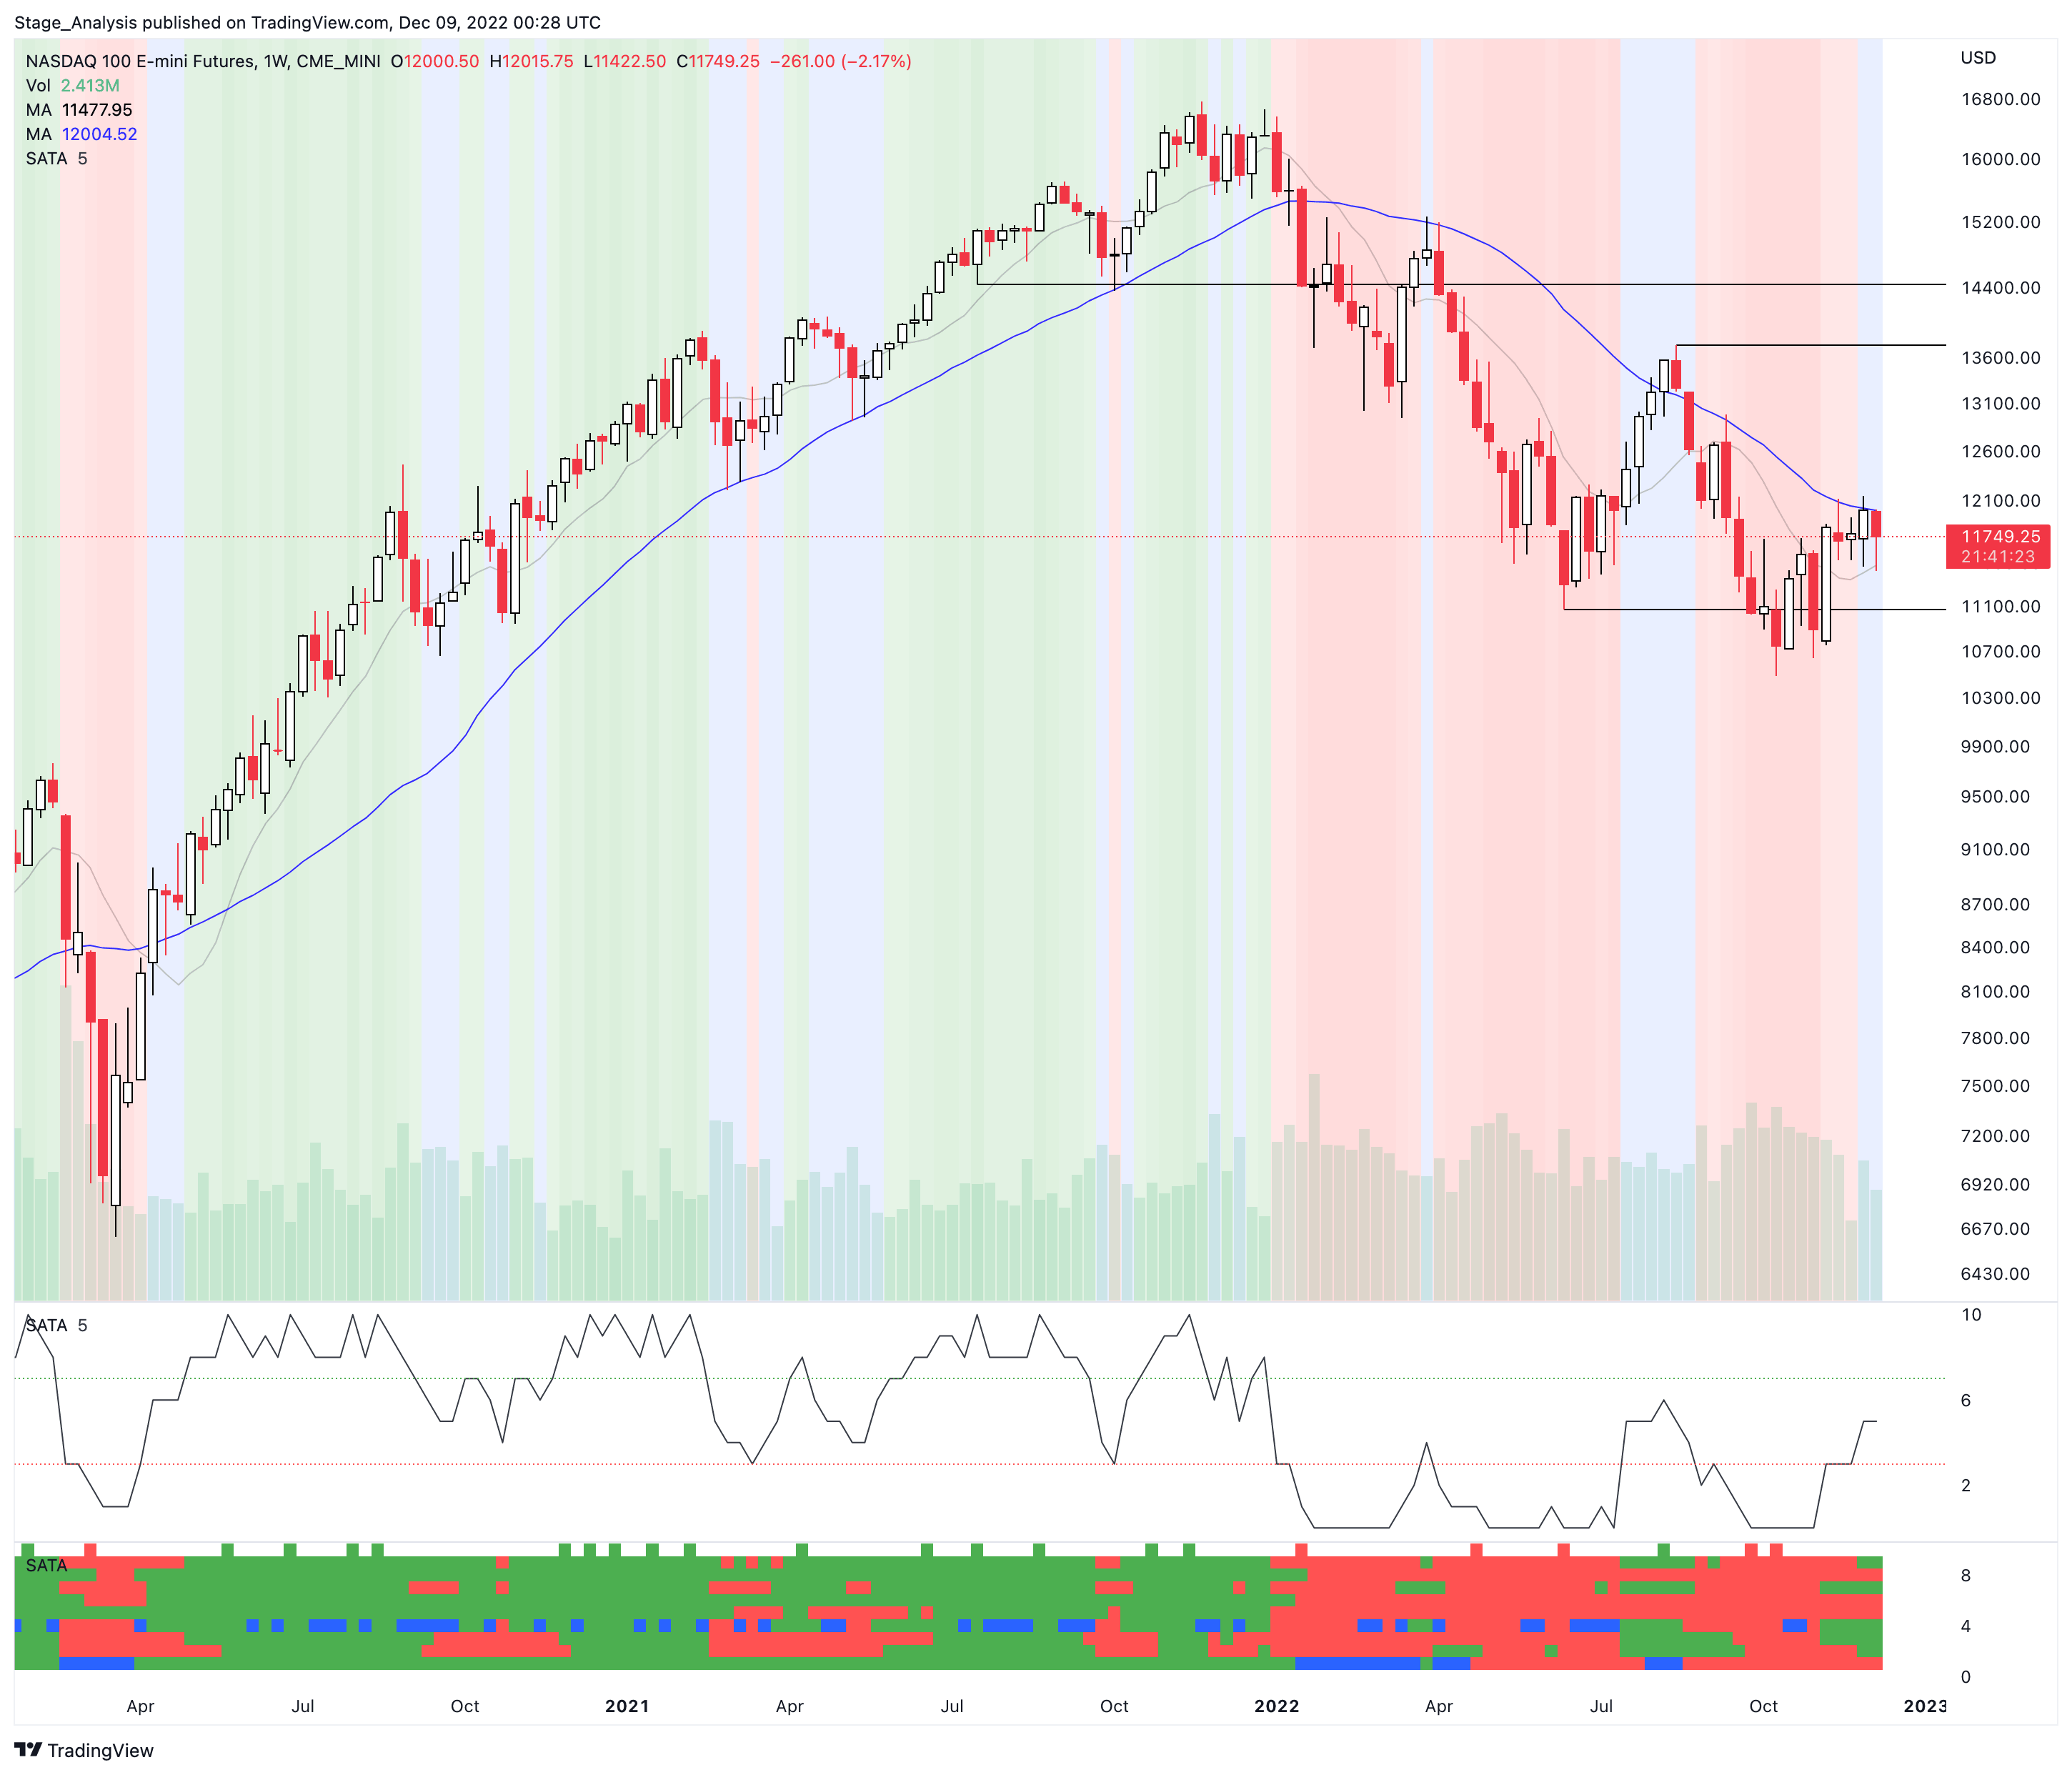
Nasdaq 100 Developing in Stage 1 and the US Stocks Watchlist – 8 December 2022
The Nasdaq 100 continues to be a laggard of the major indexes, but its Stage Analysis Technical Attributes (SATA) have been improving over the last month with those increasing to a weekly SATA score of 5 of 10, which is the Stage 1 range.
Read More