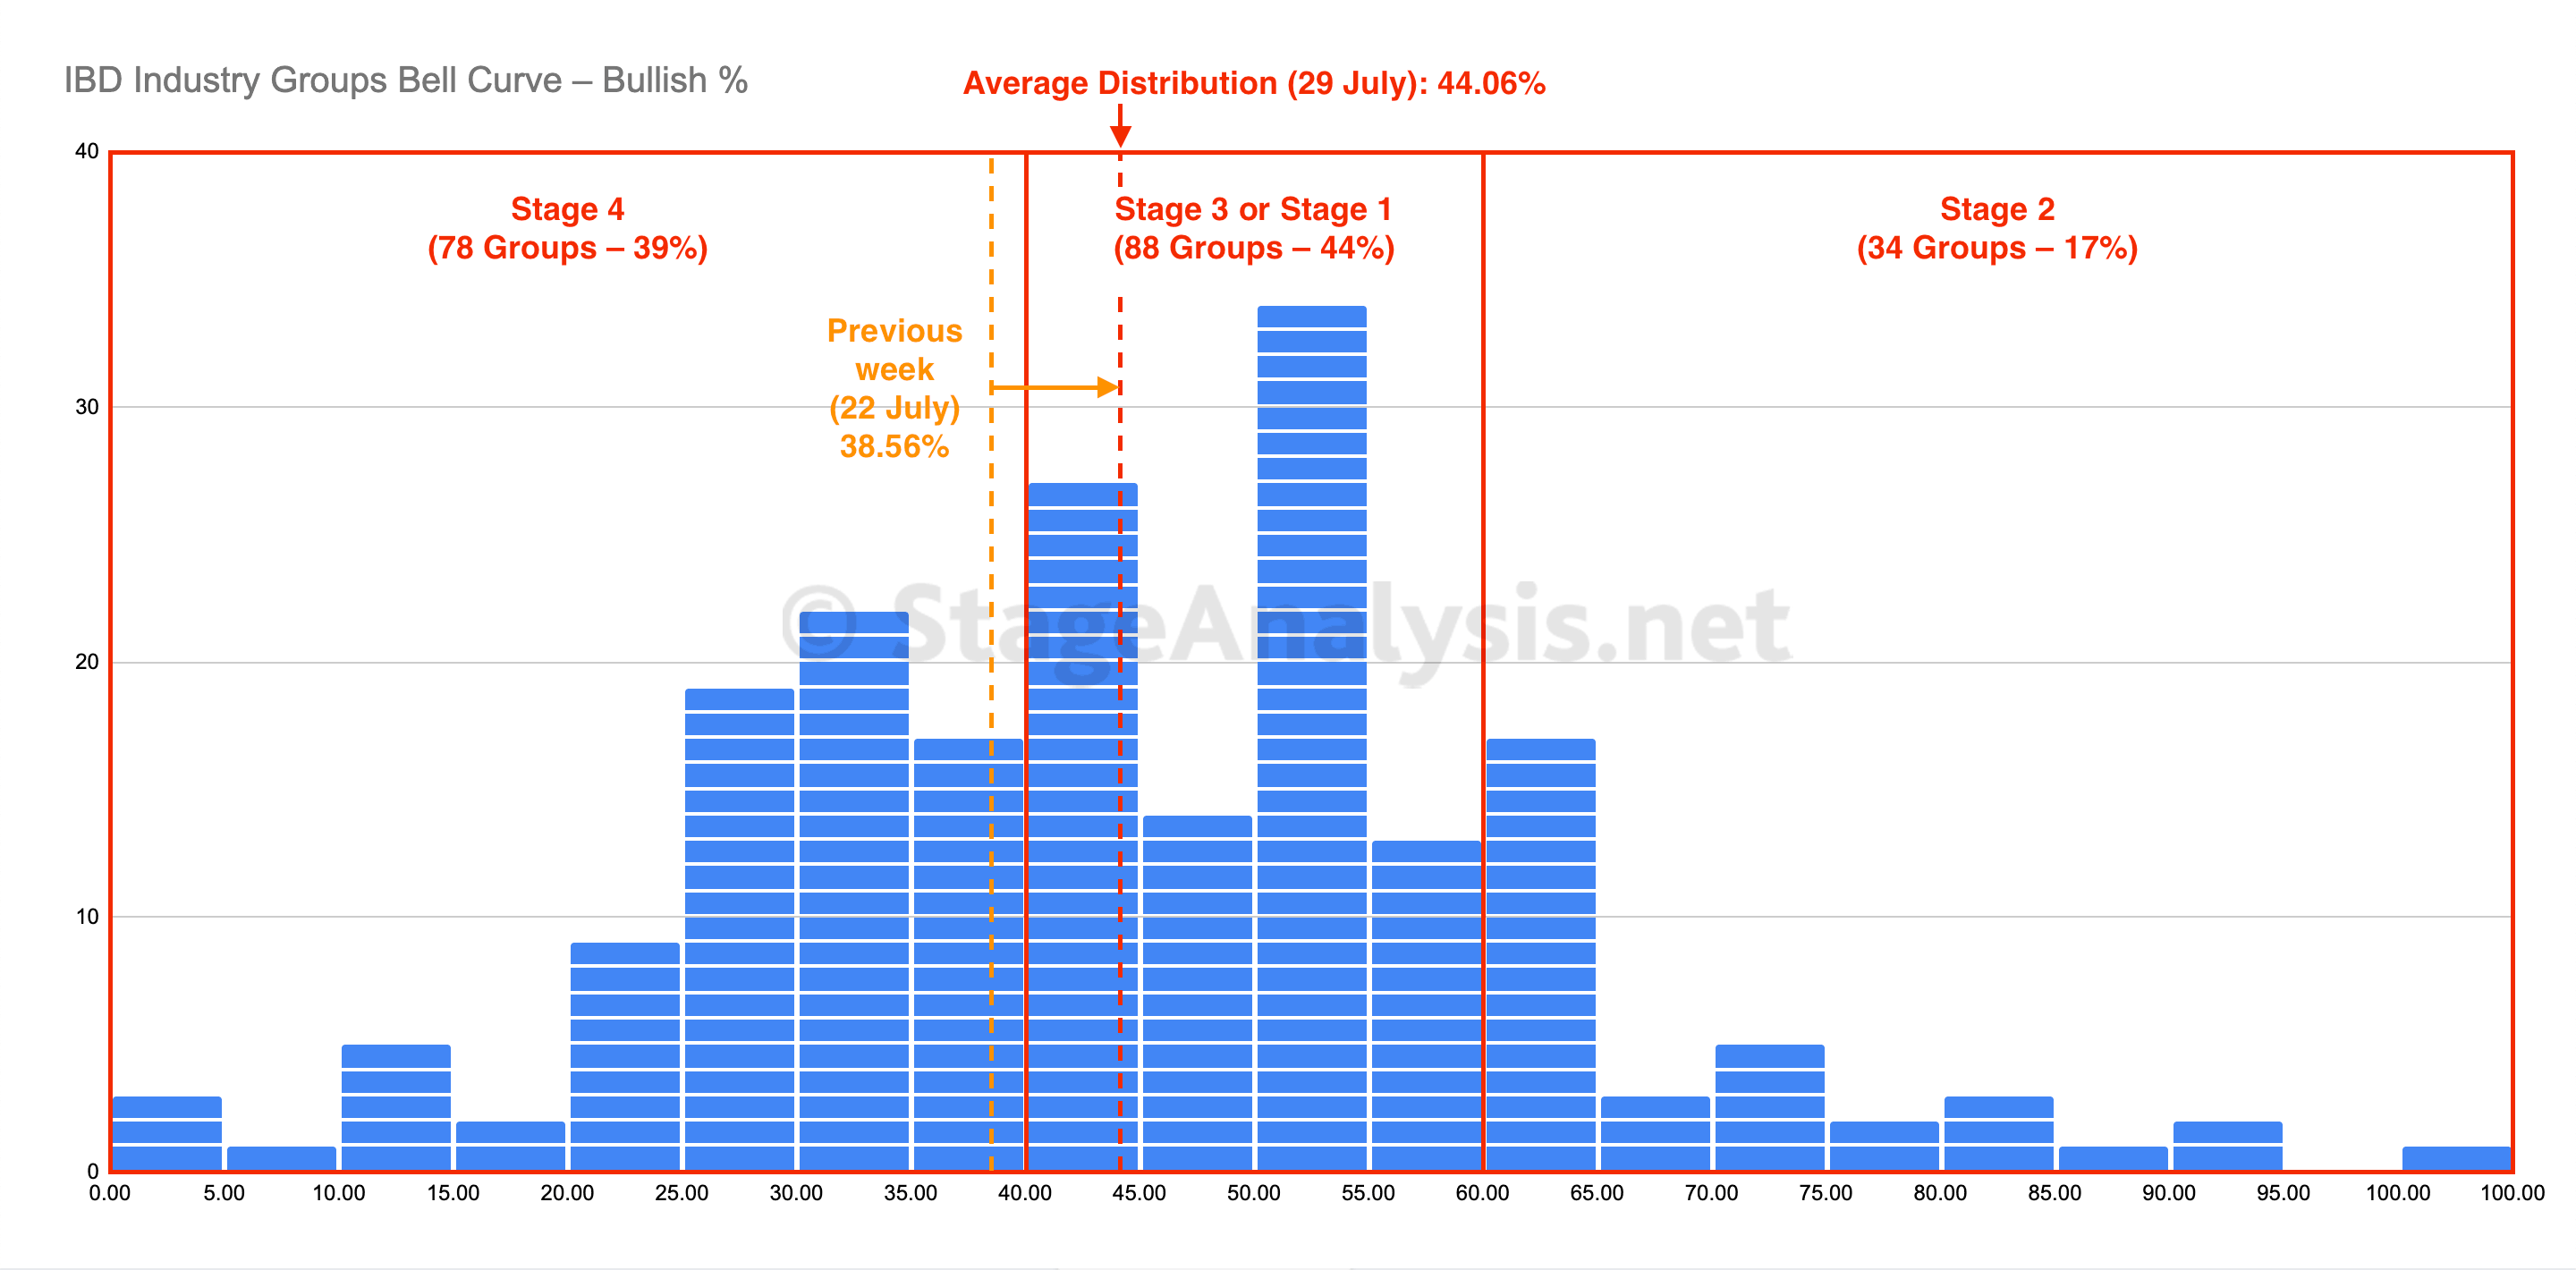
The IBD Industry Groups Bell Curve – Bullish Percent continued to improve with more groups leaving the Stage 4 zone and shifting to the Stage 1 zone, as well as an additional 5.5% of groups moving into the Stage 2 zone. The average distribution stands at 44.06%, and so the improvements have moved it out from the Stage 4 zone and back into the Stage 1 zone (between 40% and 60%).
Read More
Blog
31 July, 2022
IBD Industry Groups Bell Curve – Bullish Percent
31 July, 2022
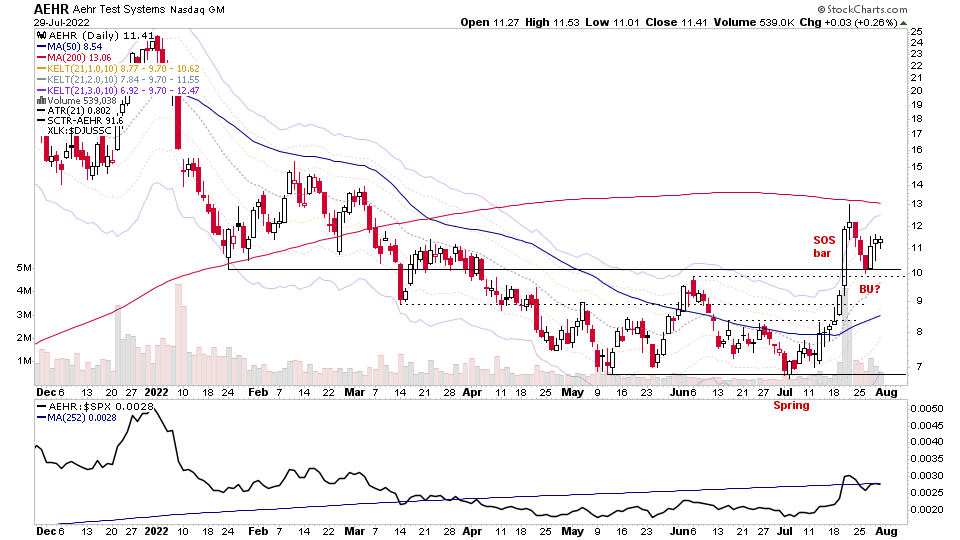
US Stocks Watchlist – 31 July 2022
For the watchlist from the weekend scans...
Read More
30 July, 2022
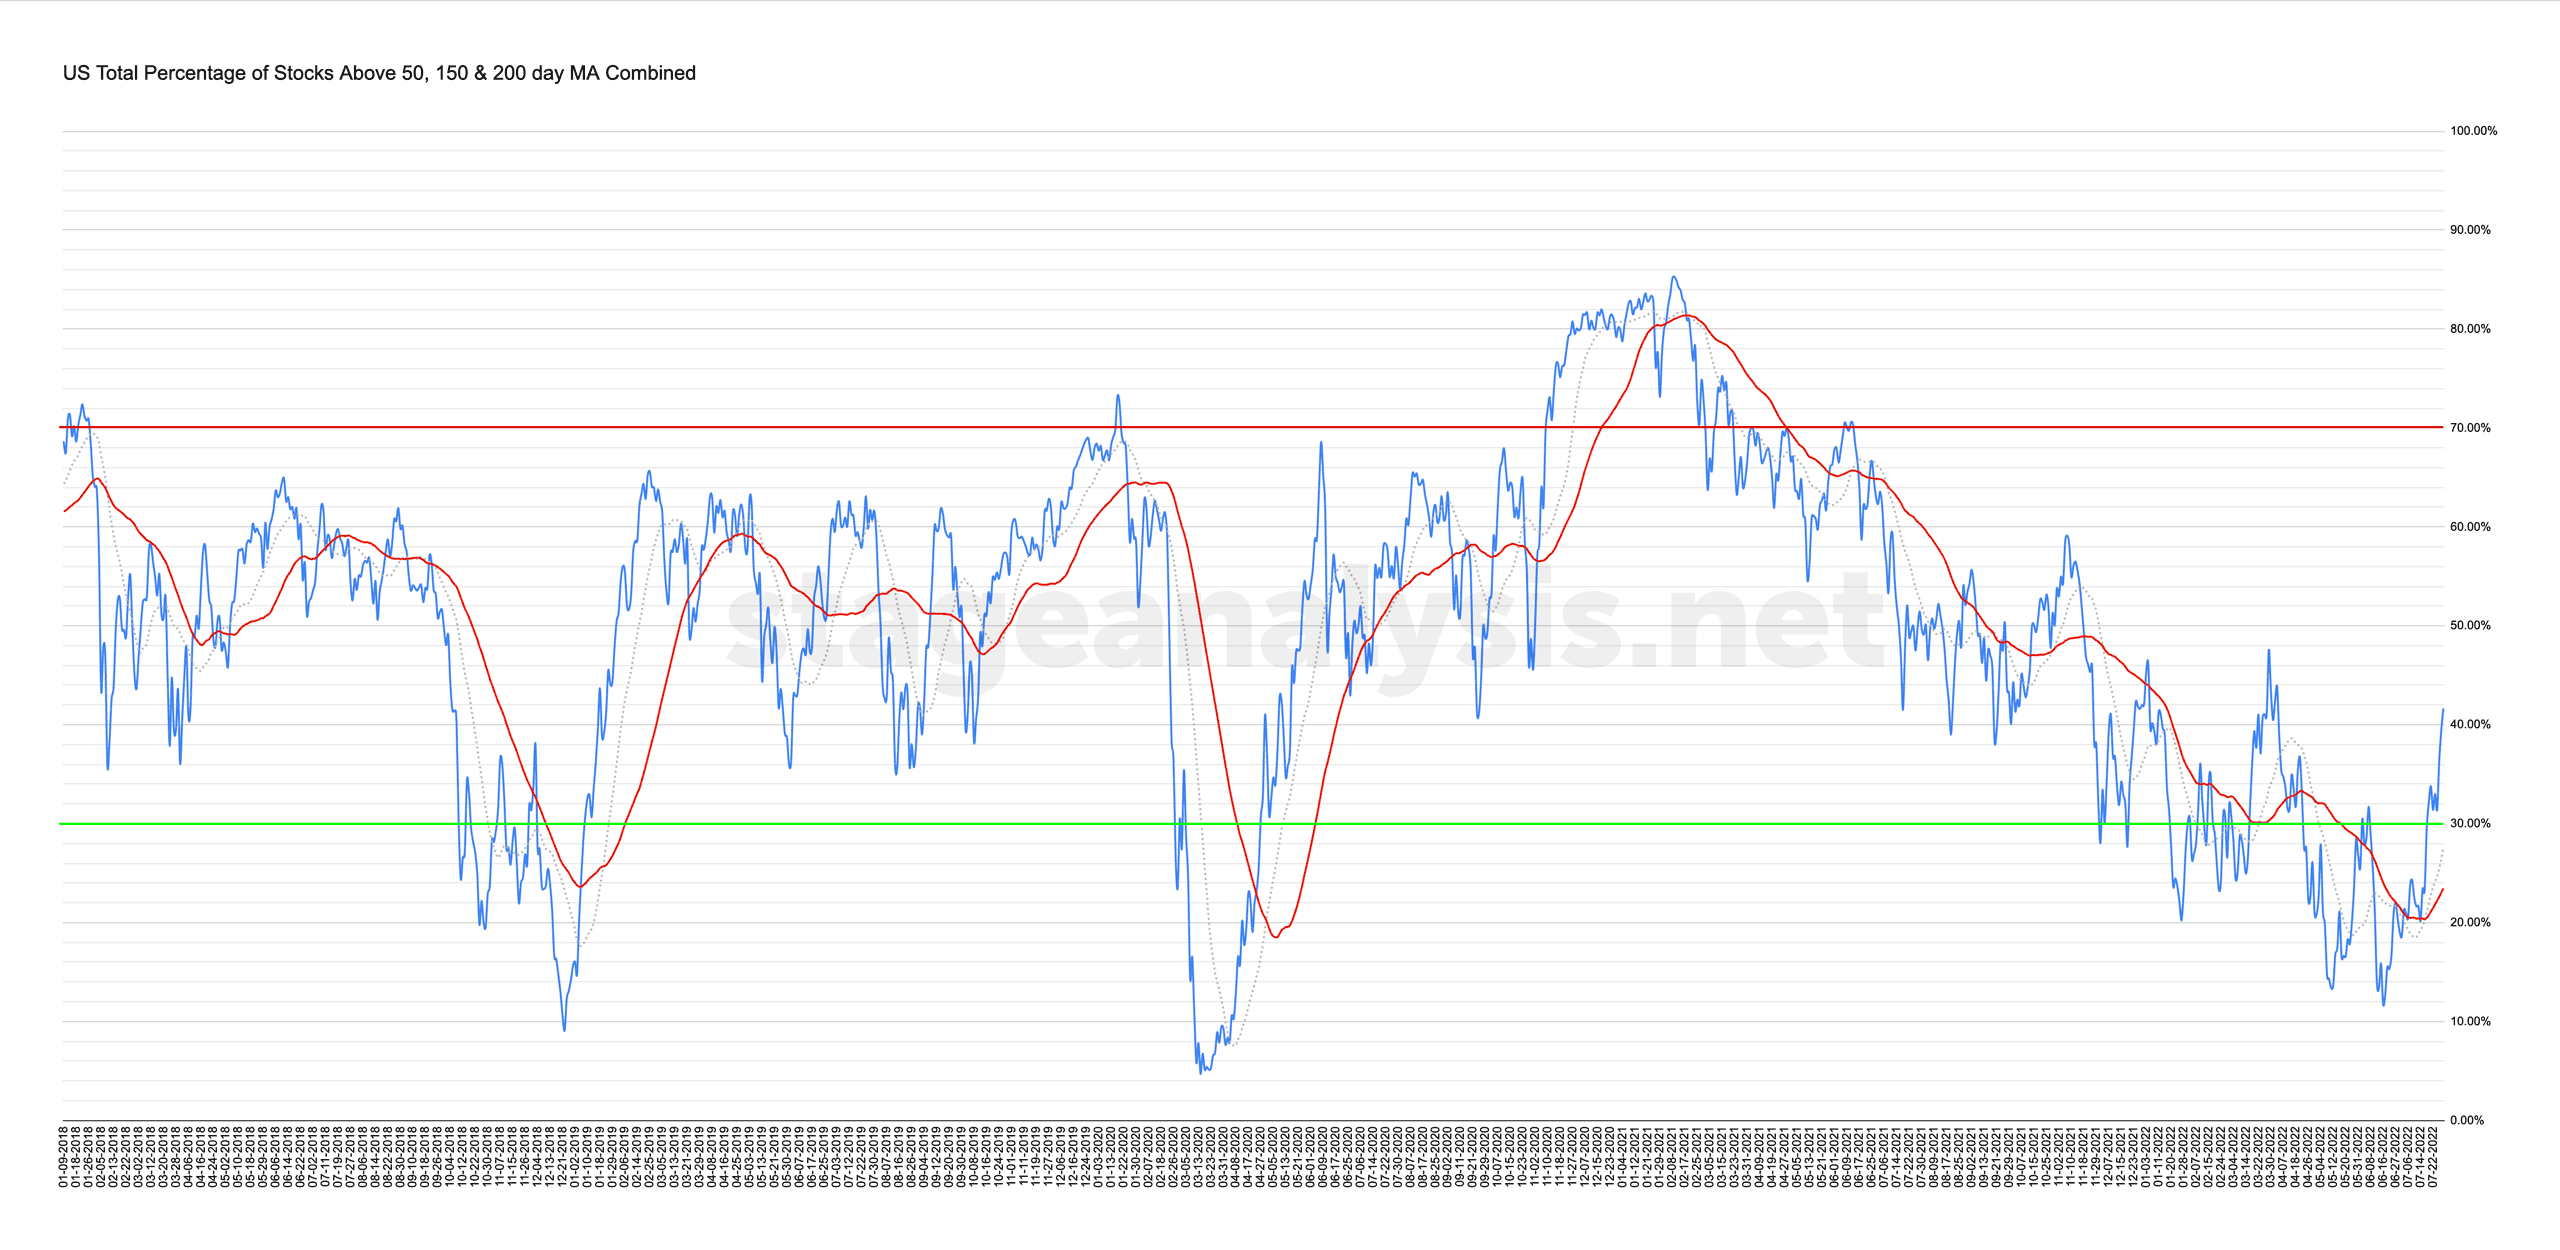
Market Breadth: Percentage of Stocks Above their 50 Day, 150 Day & 200 Day Moving Averages Combined
Custom Percentage of Stocks Above Their 50 Day, 150 Day & 200 Day Moving Averages Combined Market Breadth Charts for the Overall US Market, NYSE and Nasdaq for Market Timing and Strategy.
Read More
29 July, 2022
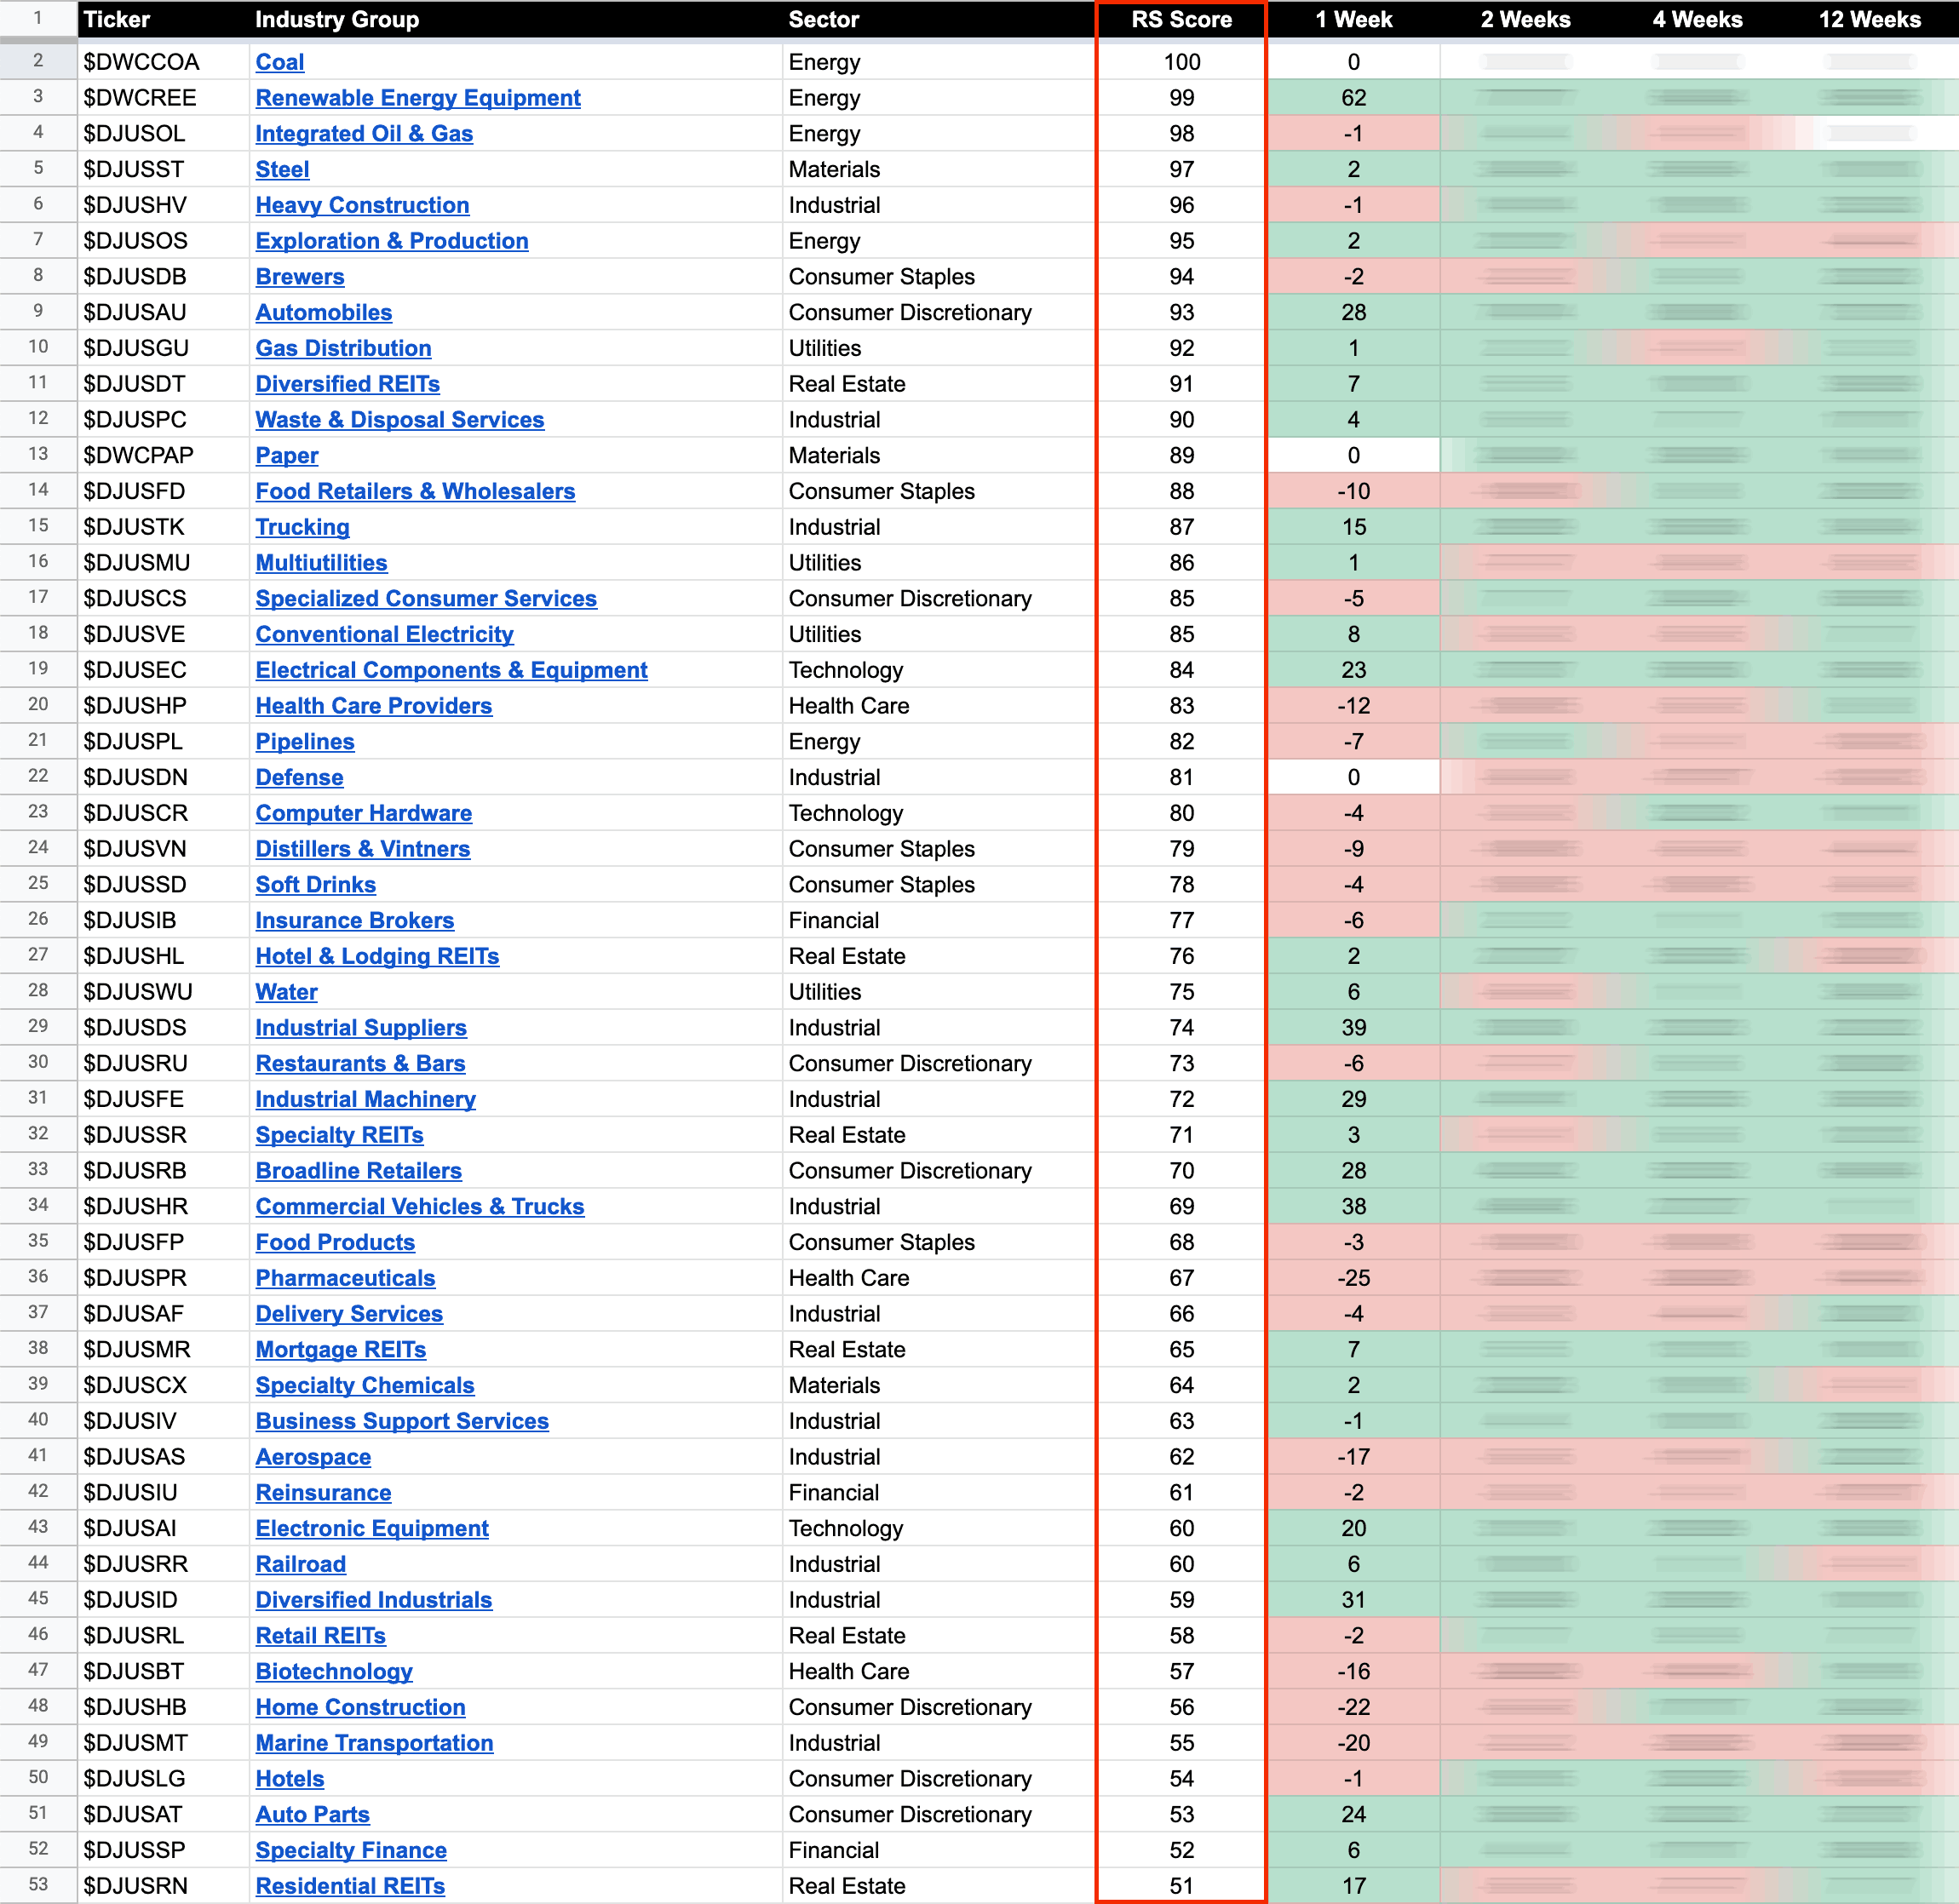
US Stocks Industry Groups Relative Strength Rankings
The purpose of the Relative Strength (RS) tables is to track the short, medium and long term RS changes of the individual groups to find the new leadership earlier than the crowd...
Read More
29 July, 2022
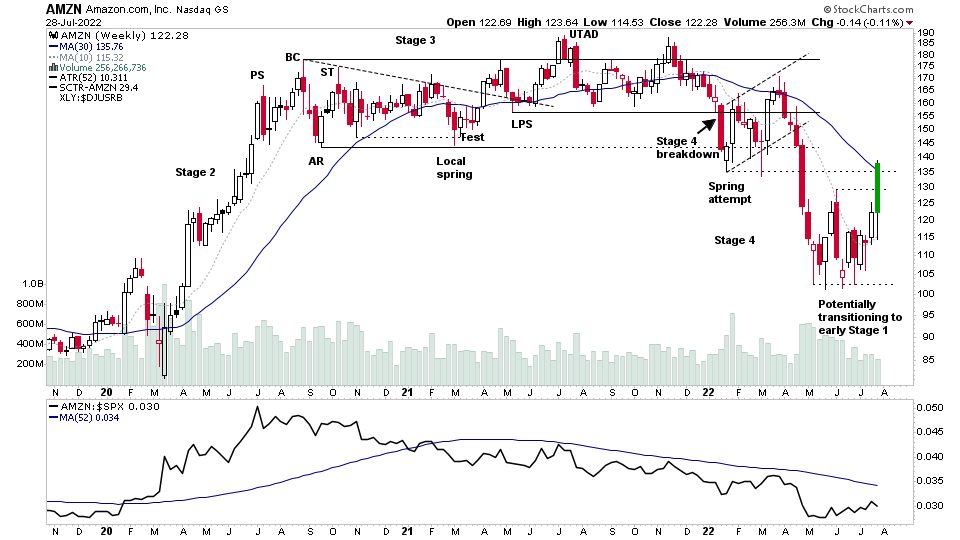
AMZN – Multiple Timeframe Analysis and the US Stocks Watchlist – 28 July 2022
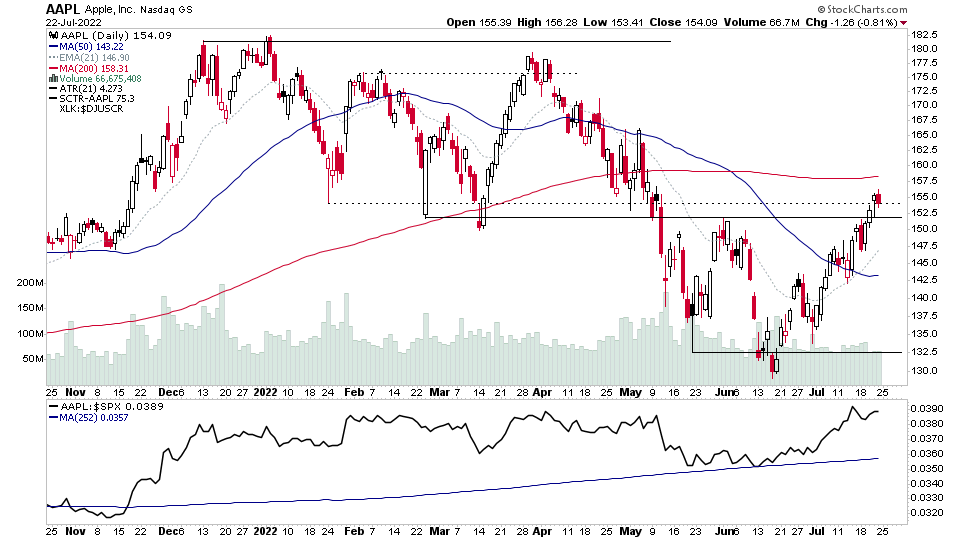
Today was a big day for earnings results, with over 300+ stocks reporting including more mega caps that have greater influence on the US stock market, with AAPL (Apple) and AMZN (Amazon) both reporting and moving higher in the after hours trade.
Read More
28 July, 2022
Stage Analysis Members Midweek Video – 27 July 2022 (1hr)
This weeks Stage Analysis Members midweek video starts with a review of the price and volume action in the major indexes, and some short term Market breadth indicators, such as the Nasdaq Composite Bullish Percent Index, which had a Bull Confirmed P&F status change today and the Percentage of Stocks above their 20 day EMAs.
Read More
26 July, 2022
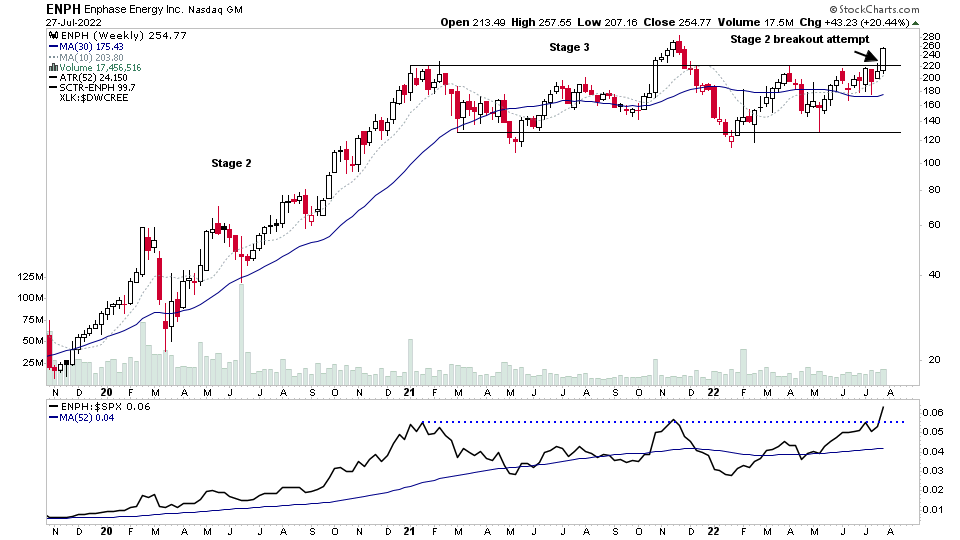
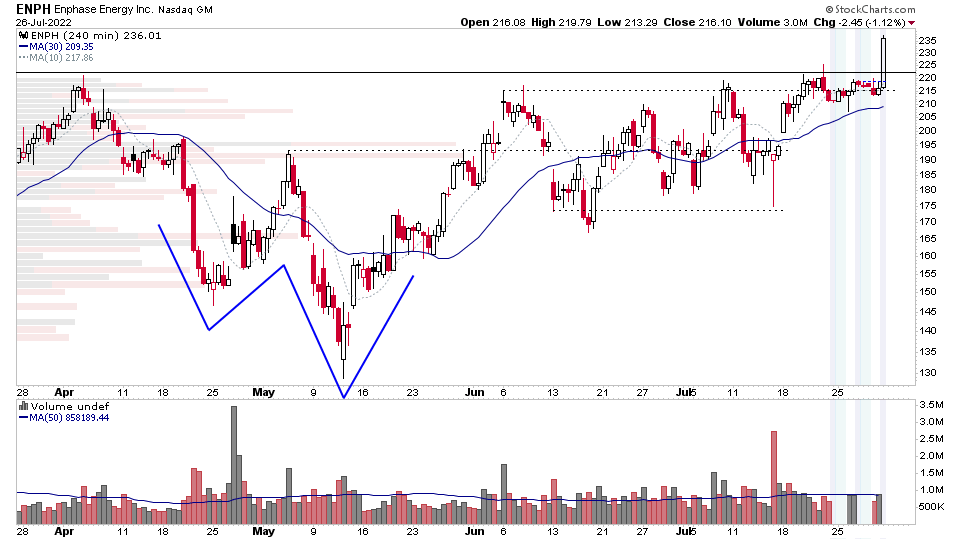
Earnings Focus – Springs and Breakouts – 26 July 2022
There were a number of important mega cap stocks reporting today, as well some others from the watchlist. So below is a multiple timeframe analysis a few of the key stocks reporting today – GOOGL, MSFT, ENPH & CMG...
Read More
26 July, 2022
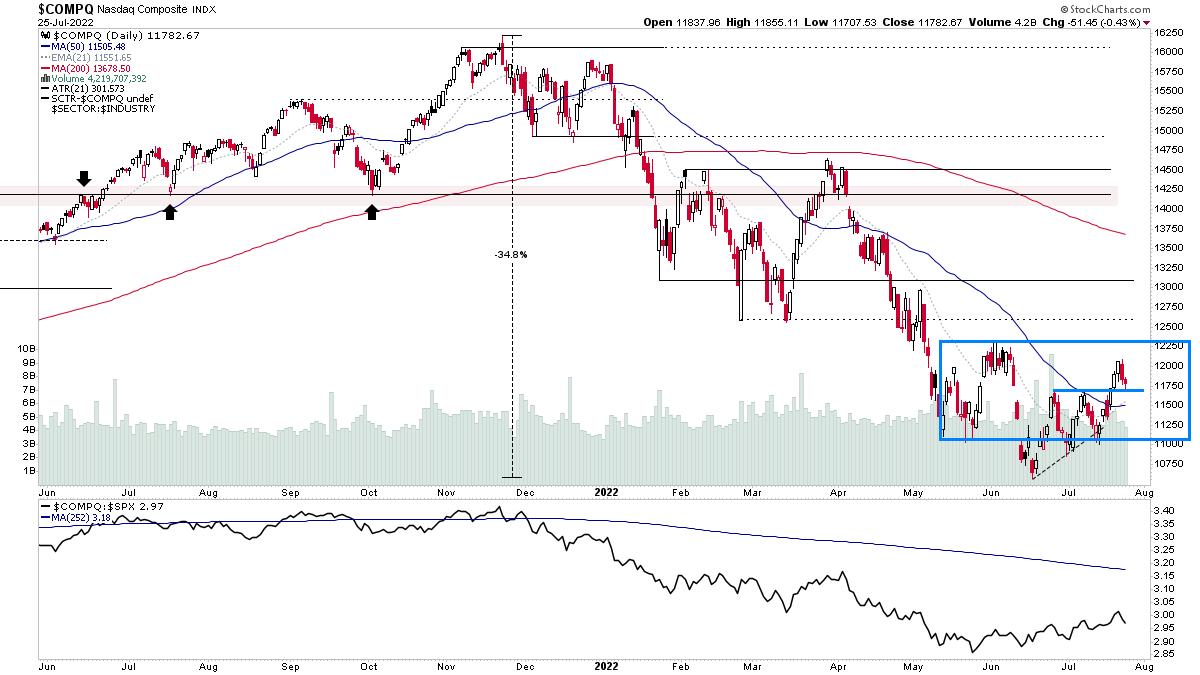
Stock Market Update and US Stocks Watchlist – 25 July 2022
The Nasdaq Composite pulled back and closed lower for a second day into the prior two short-term pivot highs, which turned support today and formed a tight candle with a small demand tail (lower wick). The Nasdaq remains in a weekly Stage 4 declining phase – so the major trend is down. However...
Read More
24 July, 2022
Stage Analysis Members Weekend Video – 24 July 2022 (1hr 17mins)
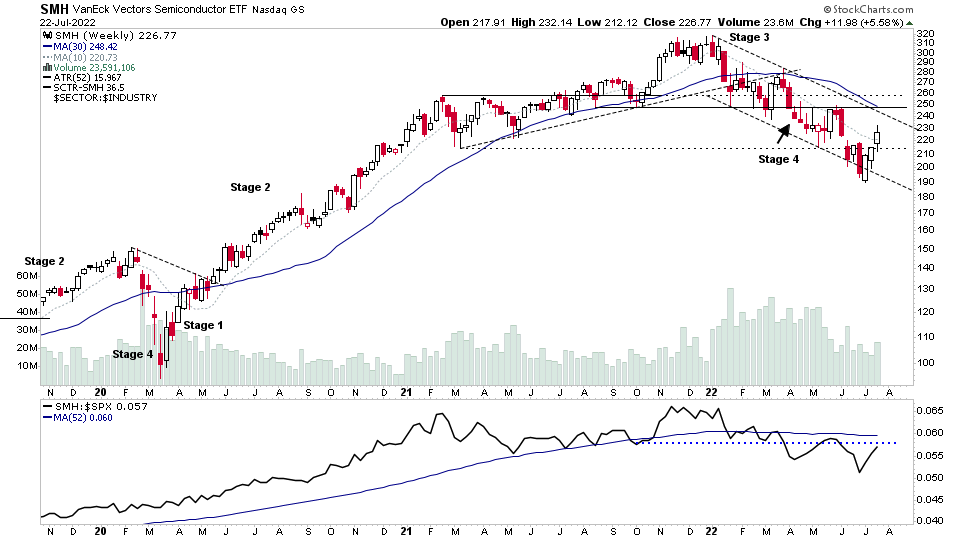
The Stage Analysis members weekend video starts this week with a focus on the Semiconductors group, as around 1/4 of the group are reporting earnings in the coming week, and have shown strong relative strength since the start of the month, rising back up the relative strength rankings and and industry group bell curve.
Read More
24 July, 2022
Earnings Watchlist – 25-29 July 2022
It's a big week for earnings with multiple mega-cap stocks reporting, as well a number of stocks featured over the last month in the watchlist posts. So I've compiled the list of those reporting this week below, and I'll be talking through them in more detail in the weekend members video, which will be out later today (Sunday 24th).
Read More

