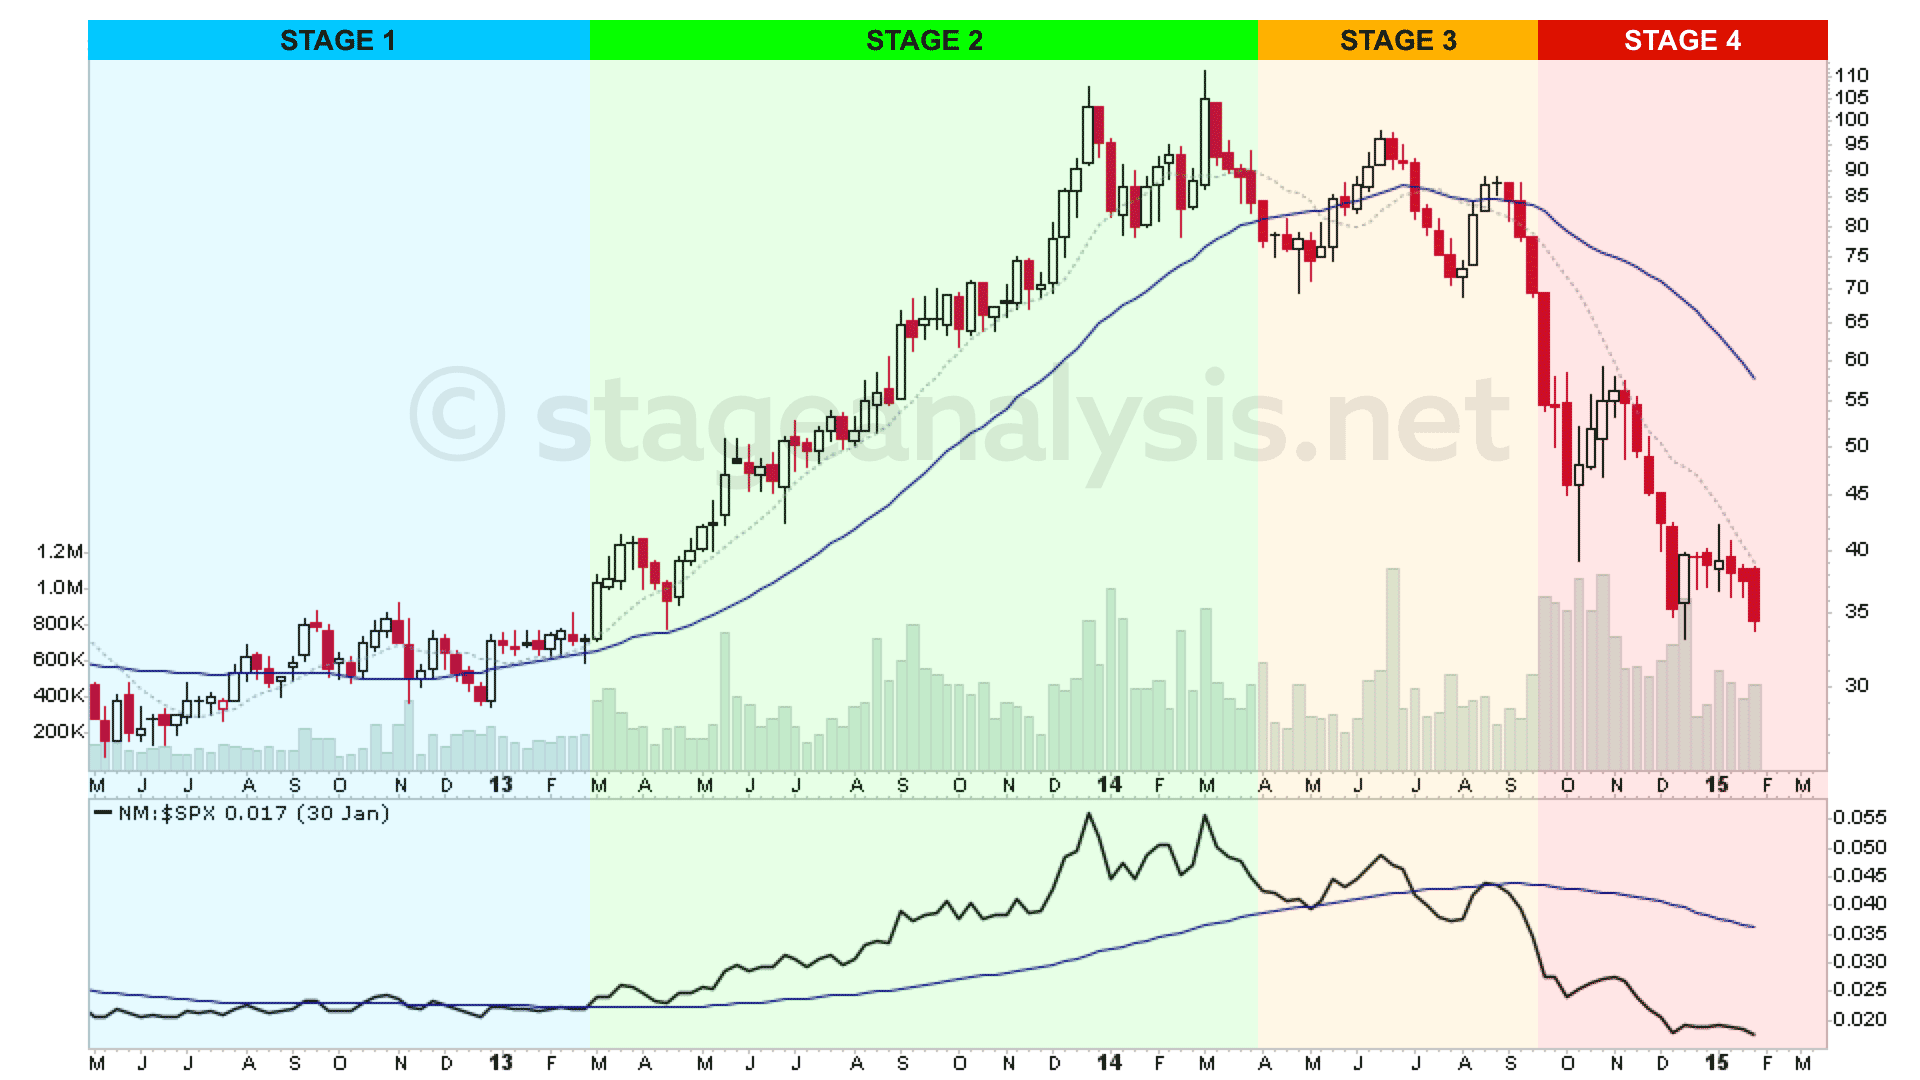
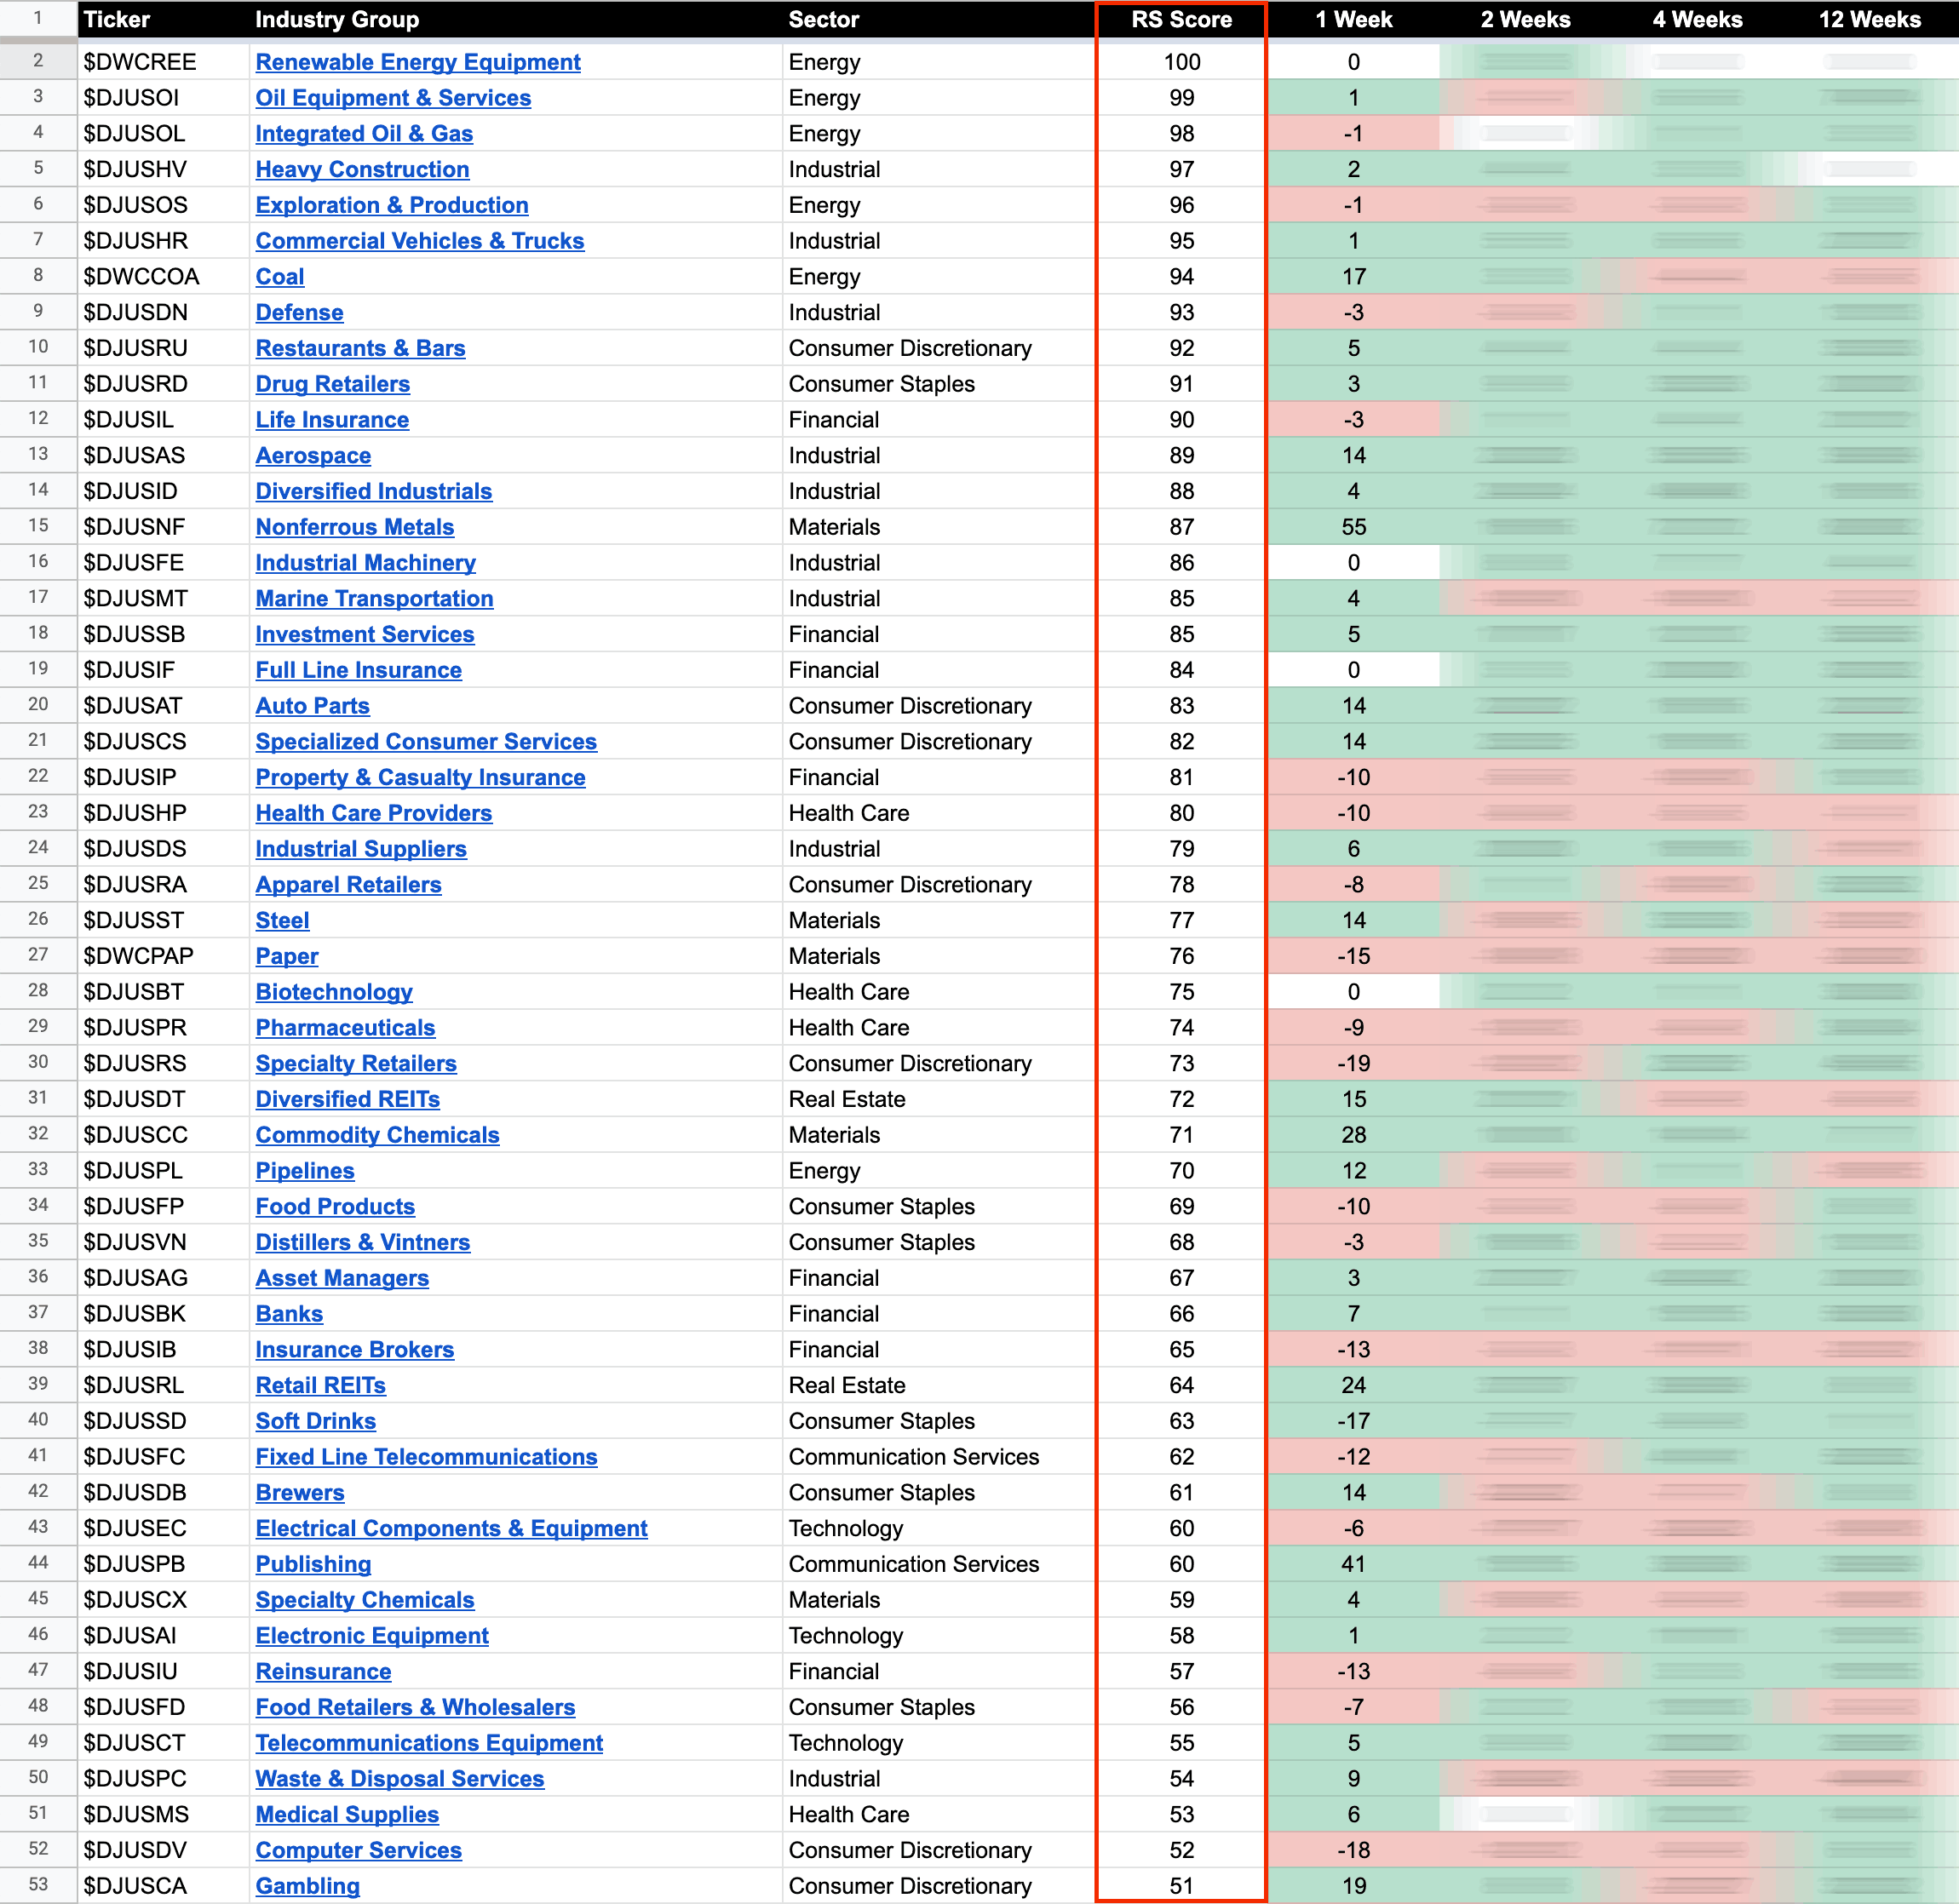
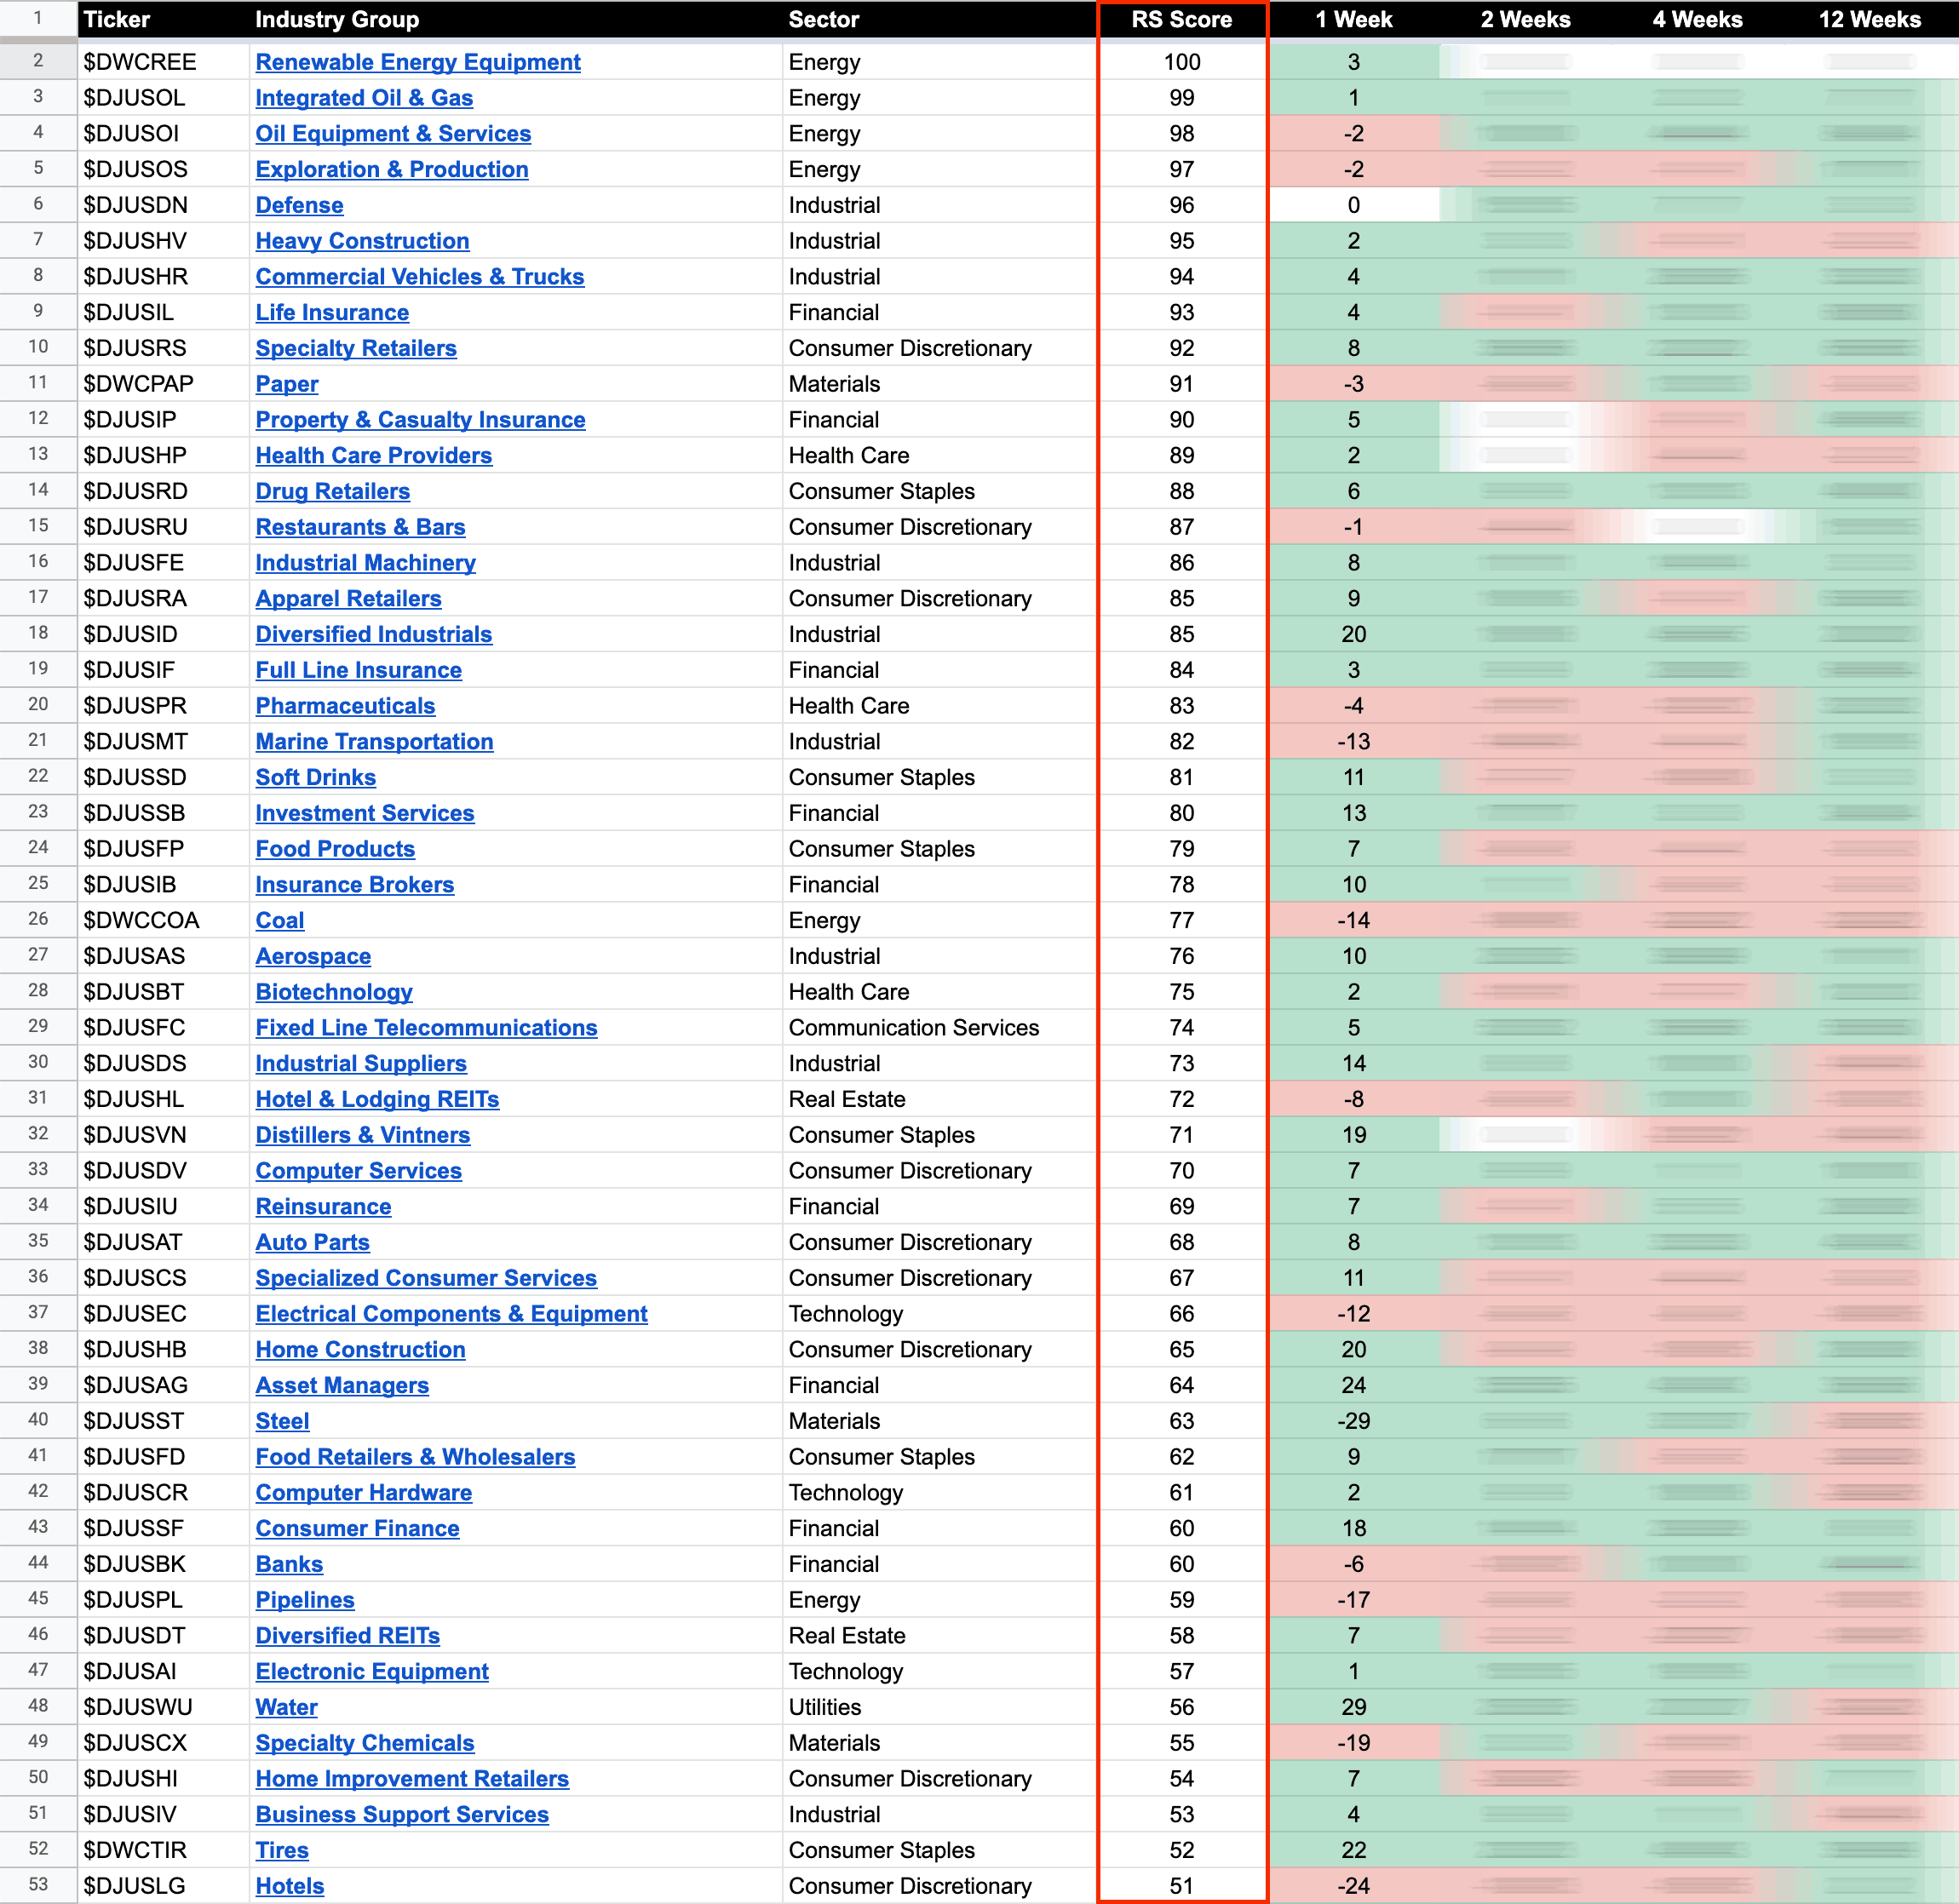
The purpose of the Relative Strength (RS) tables is to track the short, medium and long term RS changes of the individual groups to find the new leadership earlier than the crowd...
Read More
Blog
04 November, 2022
US Stocks Industry Groups Relative Strength Rankings
03 November, 2022
Stage Analysis Members Video – 03 November 2022 (1hr 2mins)
The members midweek video begins today with a group focus on the leading group Renewable Energy Equipment which made a Stage 2 continuation attempt today. Followed by analysis of the S&P 500 and VIX and the short-term Market Breadth charts...
Read More
01 November, 2022
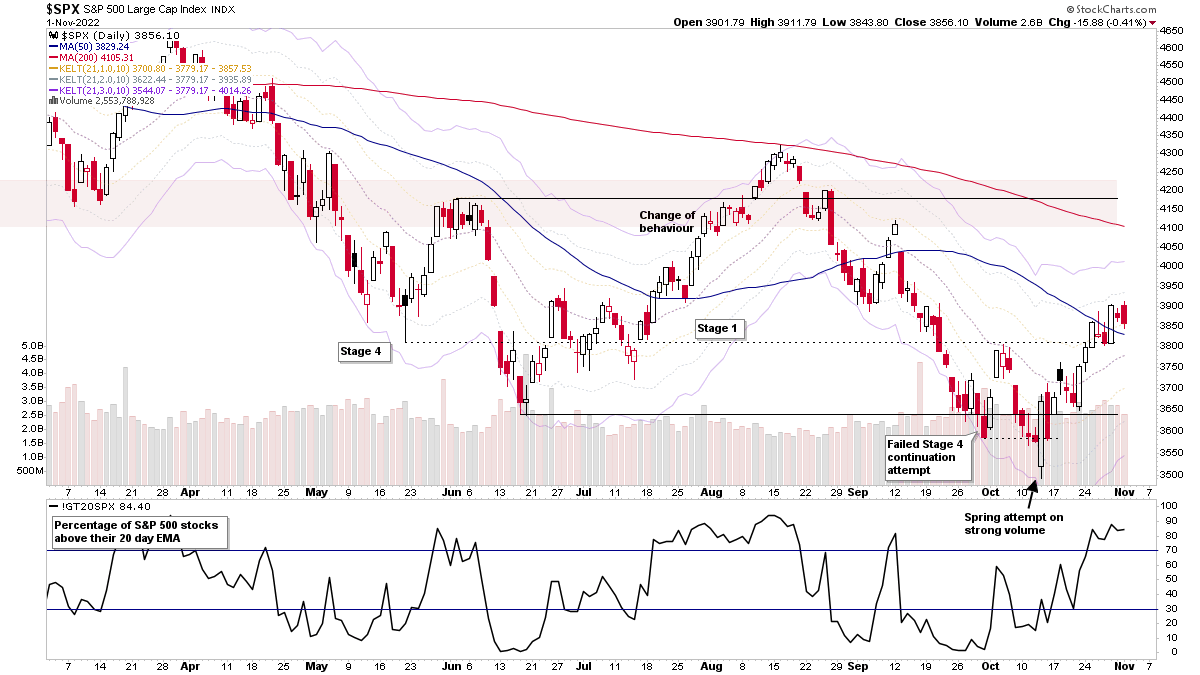
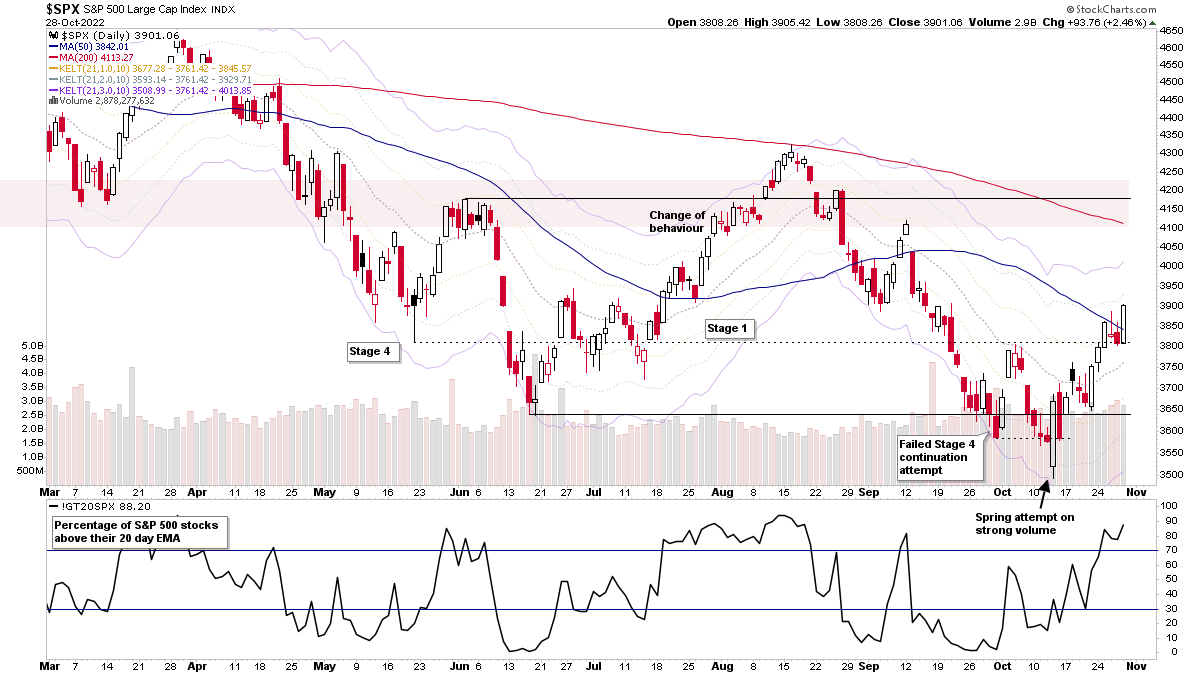
S&P 500 Consolidates Above 50 Day MA Ahead of FOMC and the US Stocks Watchlist – 1 November 2022
Marine Transportation stocks featured heavily in todays scans with STNG leading the group and pushing to strongly to new highs with a further Stage 2 continuation breakout attempt on earnings results, which had a knock on effect in the other stocks in the groups...
Read More
31 October, 2022
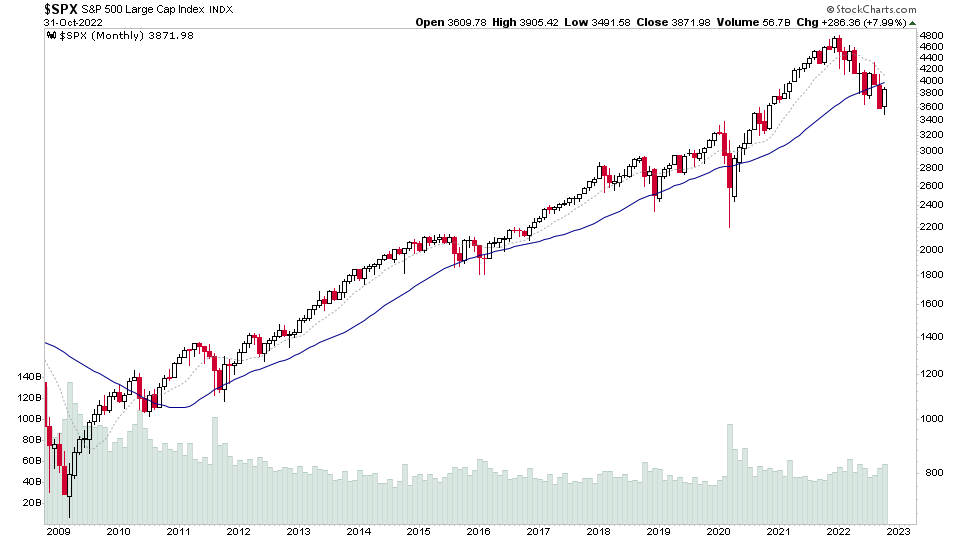
Monthly Charts Review – 31 October 2022
As we come to the end of October, it's worth zooming out from your regular chart timescales and taking a look at the bigger picture across different areas of the markets for some perspective.
Read More
30 October, 2022
Stage Analysis Members Video Part 3 – Market Breadth – 30 October 2022 (18 mins)
Part 3 of the regular members weekend video discussing the market breadth to determine the weight of evidence.
Read More
30 October, 2022
Stage Analysis Members Video Part 2 – US Market Review – 30 October 2022 (28 mins)
Part 2 of the regular members weekend video discussing the market, industry groups and market breadth to determine the weight of evidence.
Read More
30 October, 2022
Stage Analysis Members Video Part 1 – US Stocks Watchlist – 30 October 2022 (42 mins)
Part 1 of the weekend video discussing the US watchlist stocks in detail.
Read More
29 October, 2022
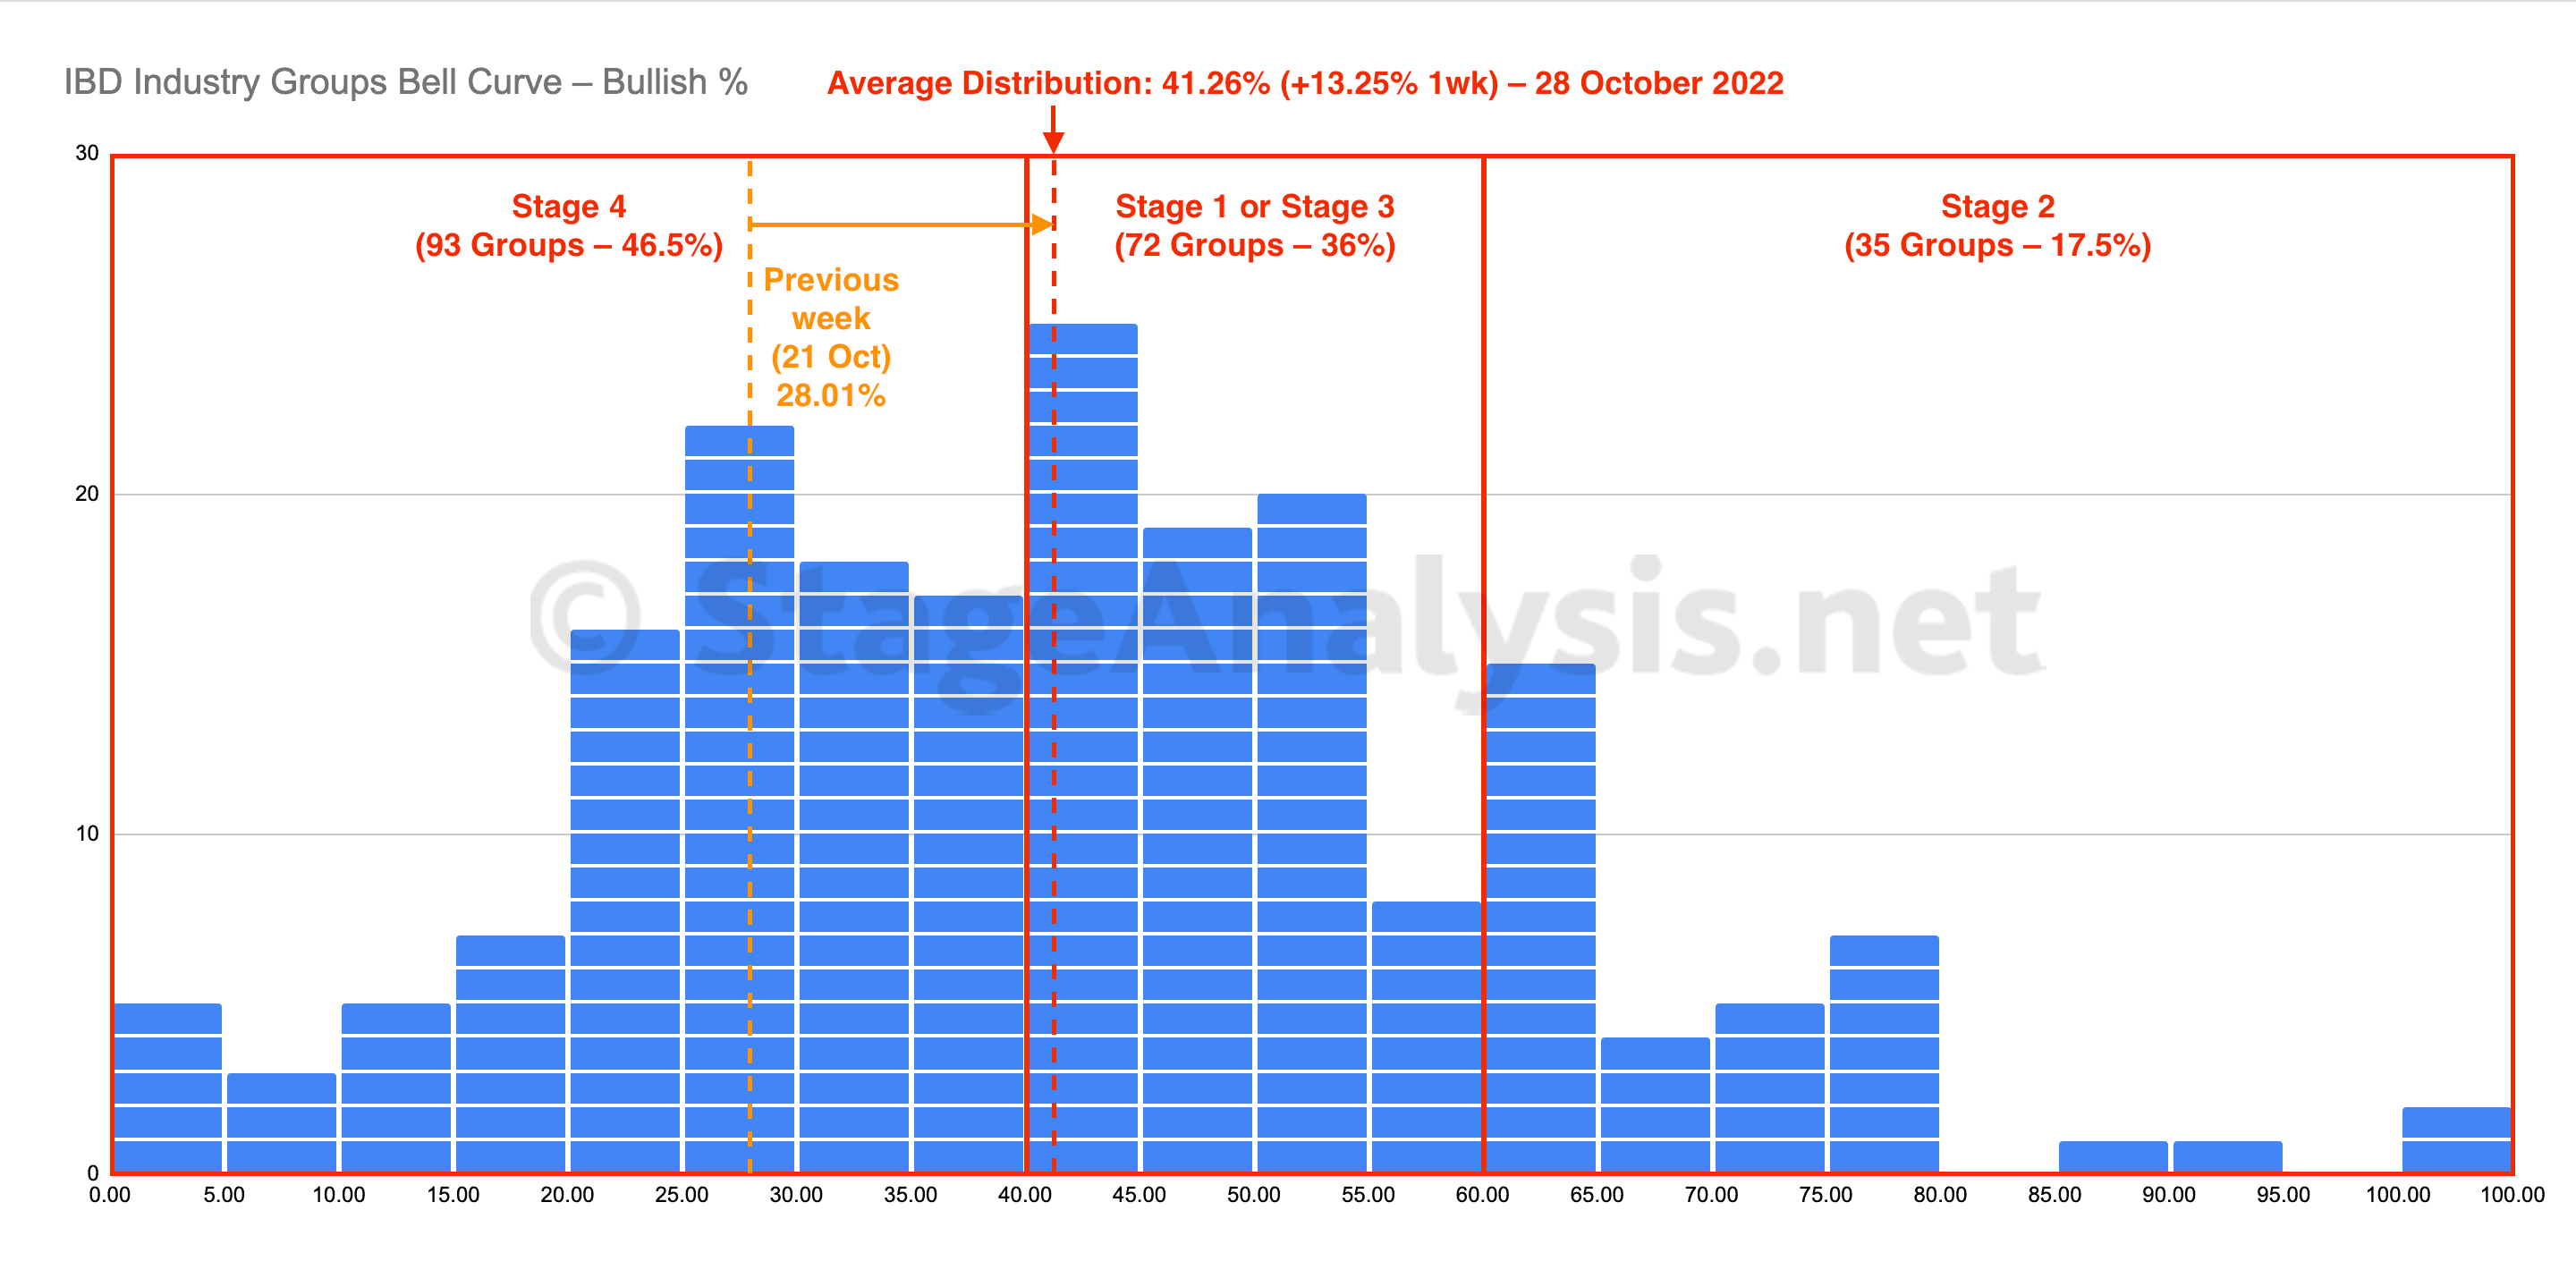
IBD Industry Groups Bell Curve – Bullish Percent
The IBD Industry Groups Bell Curve – Bullish Percent moved strongly higher over the last week with a +13.25% improvement, with 57 Groups (-28.5%) moving out of the Stage 4 zone, and 34 Groups (+17%) moved into the Stage 1 zone, and 23 Groups (+11.5%) moved into the Stage 2 zone...
Read More
29 October, 2022
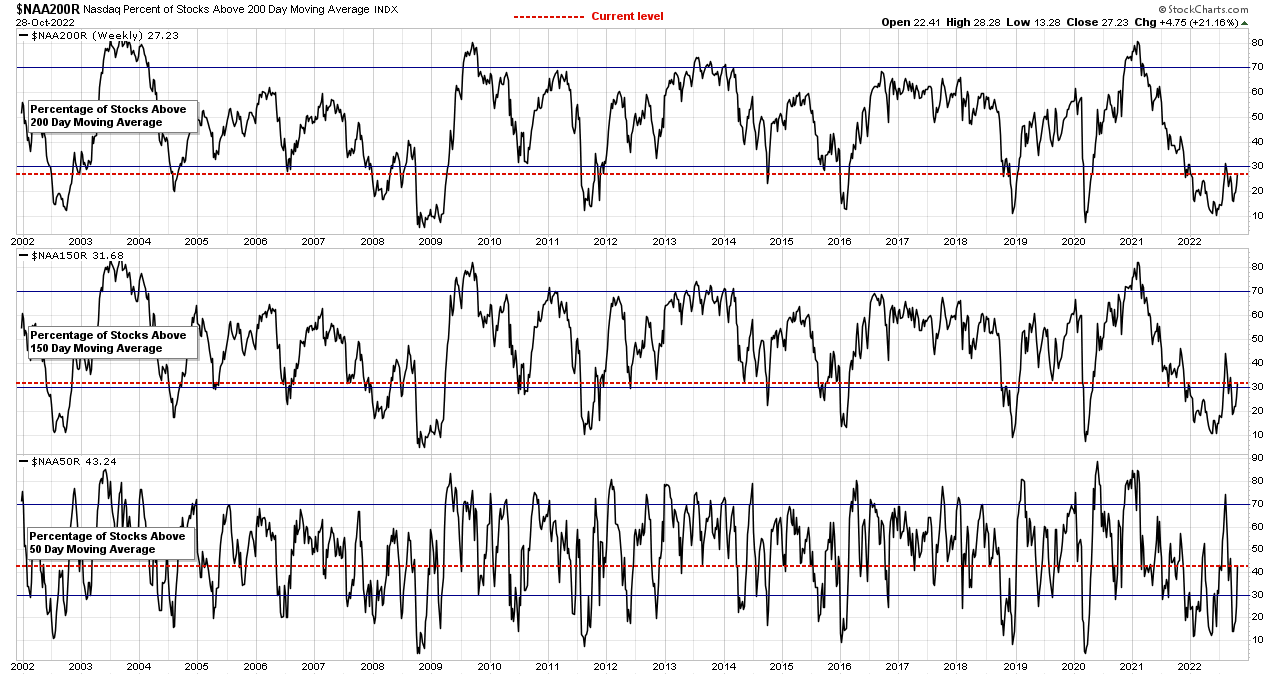
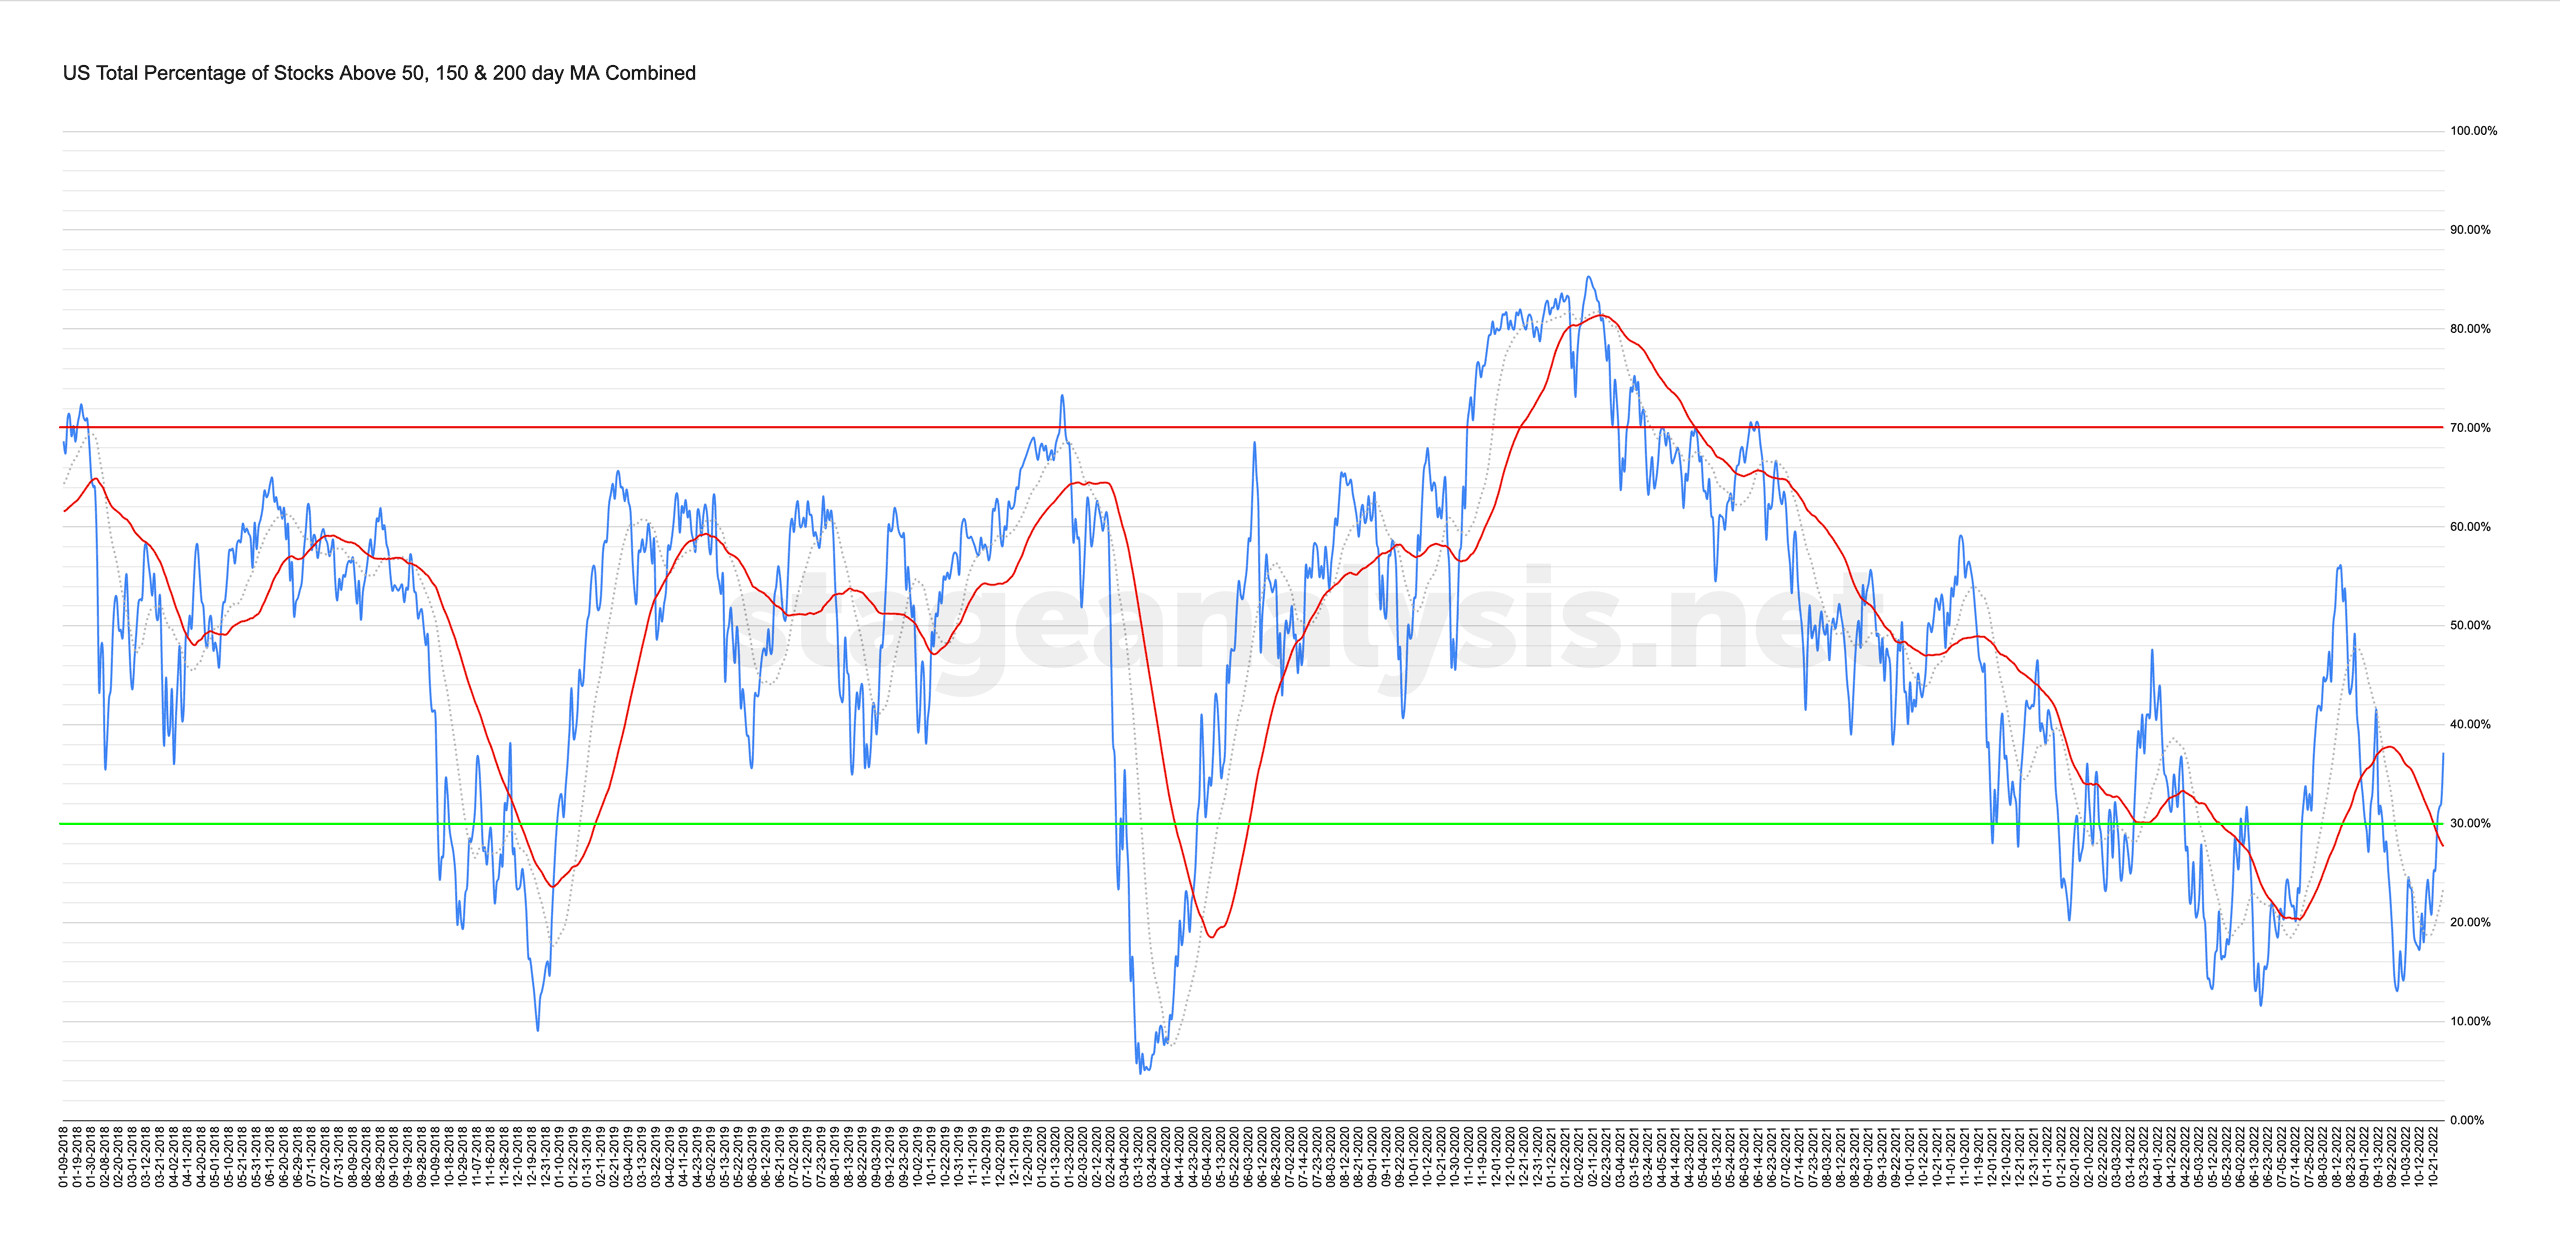
Market Breadth: Percentage of Stocks Above their 50 Day, 150 Day & 200 Day Moving Averages Combined
Custom Percentage of Stocks Above Their 50 Day, 150 Day & 200 Day Moving Averages Combined Market Breadth Charts for the Overall US Market, NYSE and Nasdaq for Market Timing and Strategy.
Read More
28 October, 2022
US Stocks Industry Groups Relative Strength Rankings
The purpose of the Relative Strength (RS) tables is to track the short, medium and long term RS changes of the individual groups to find the new leadership earlier than the crowd...
Read More

