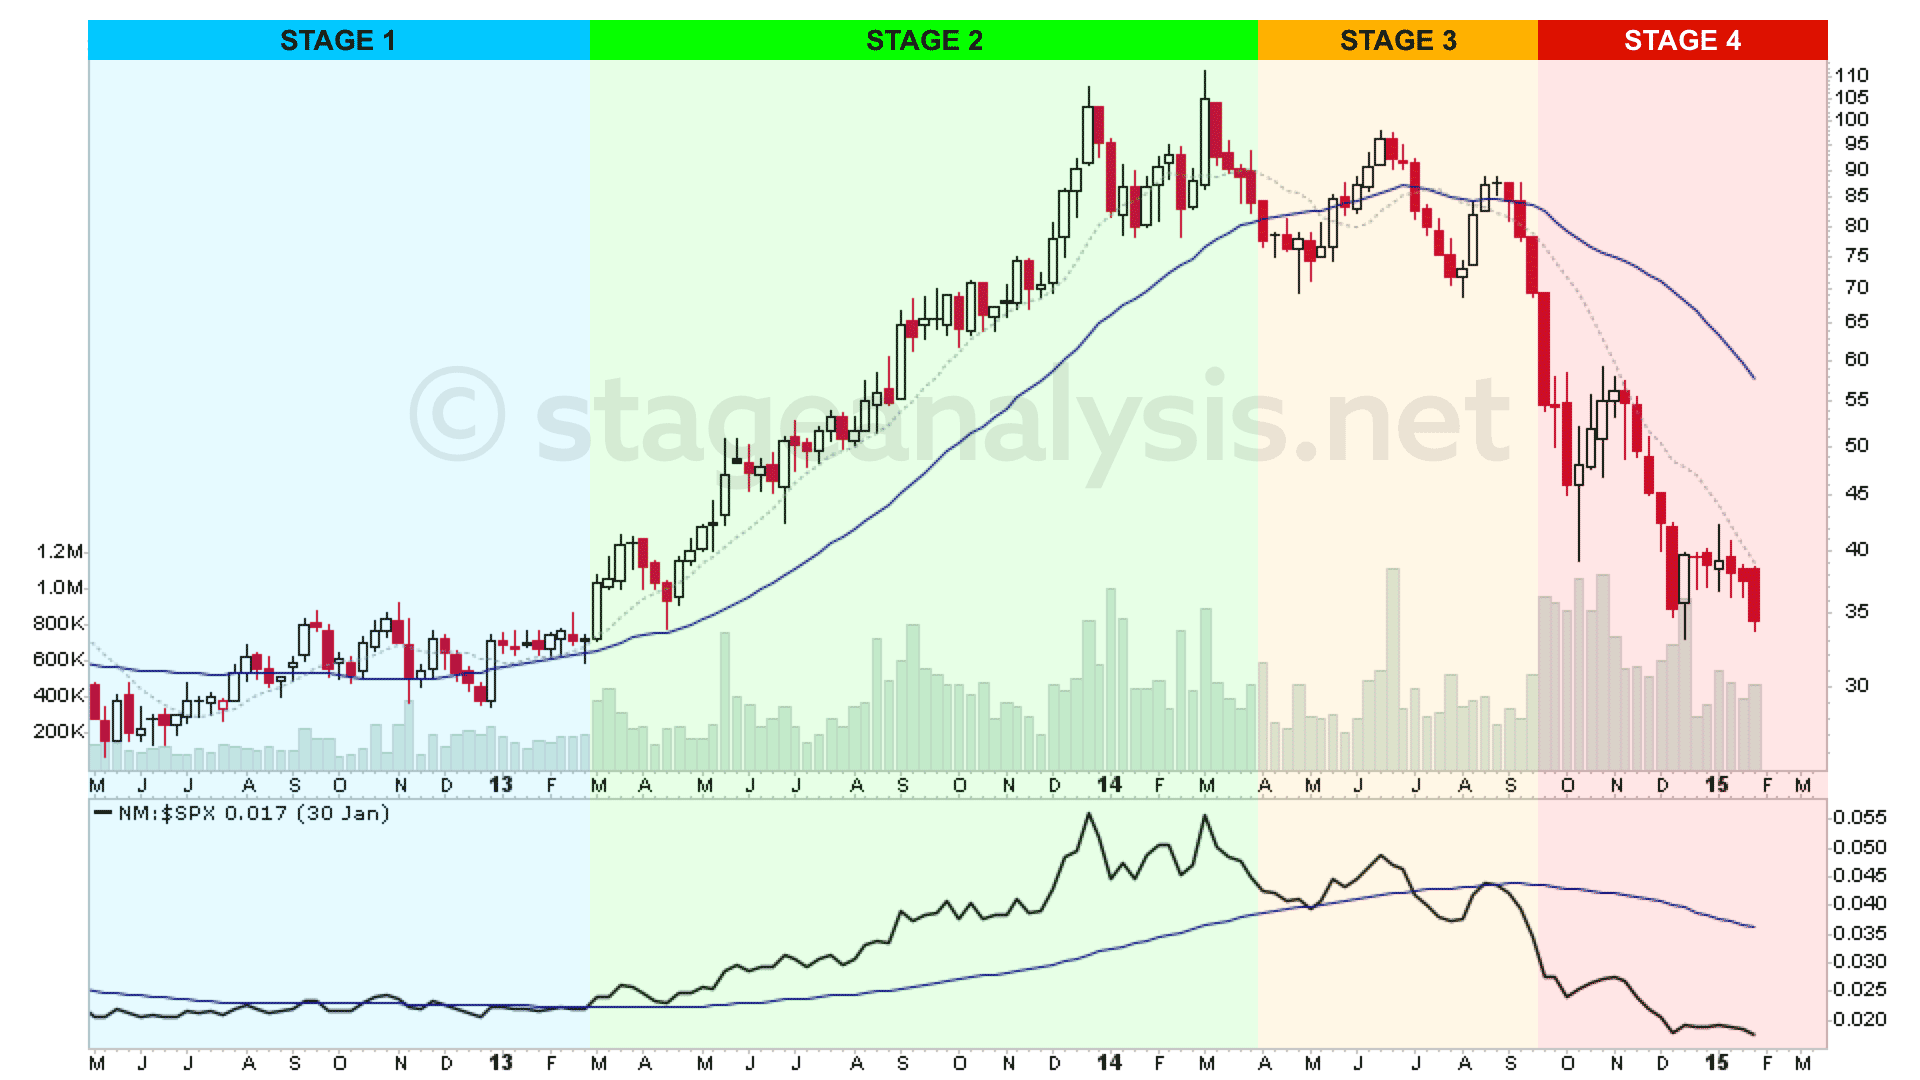
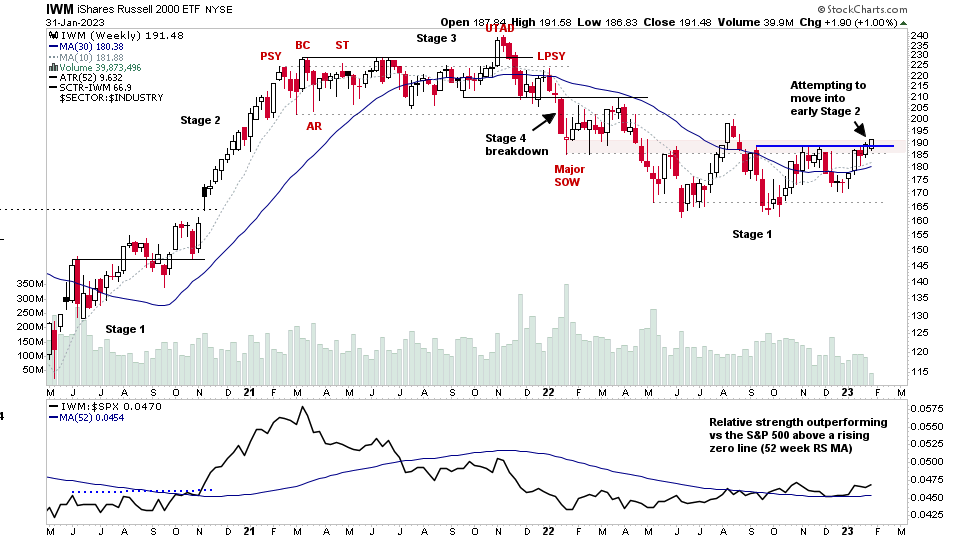
Todays post is a special feature looking at the Small Caps, as ahead of the FOMC on Wednesday, the Russell 2000 Small Caps ETF (IWM) is attempting to breakout into early Stage 2 (see above weekly and daily charts). Hence, with Stage Analysis its the perfect time to drill down into this area of the market, looking at the Small Cap sector Relative Strength, leading Small Cap stocks already in early Stage 2 or testing their Stage 2 level, and some of the market breadth stats from the group to get a broader picture of their internal health...
Read More
Blog
30 January, 2023
US Stocks Watchlist – 30 January 2023
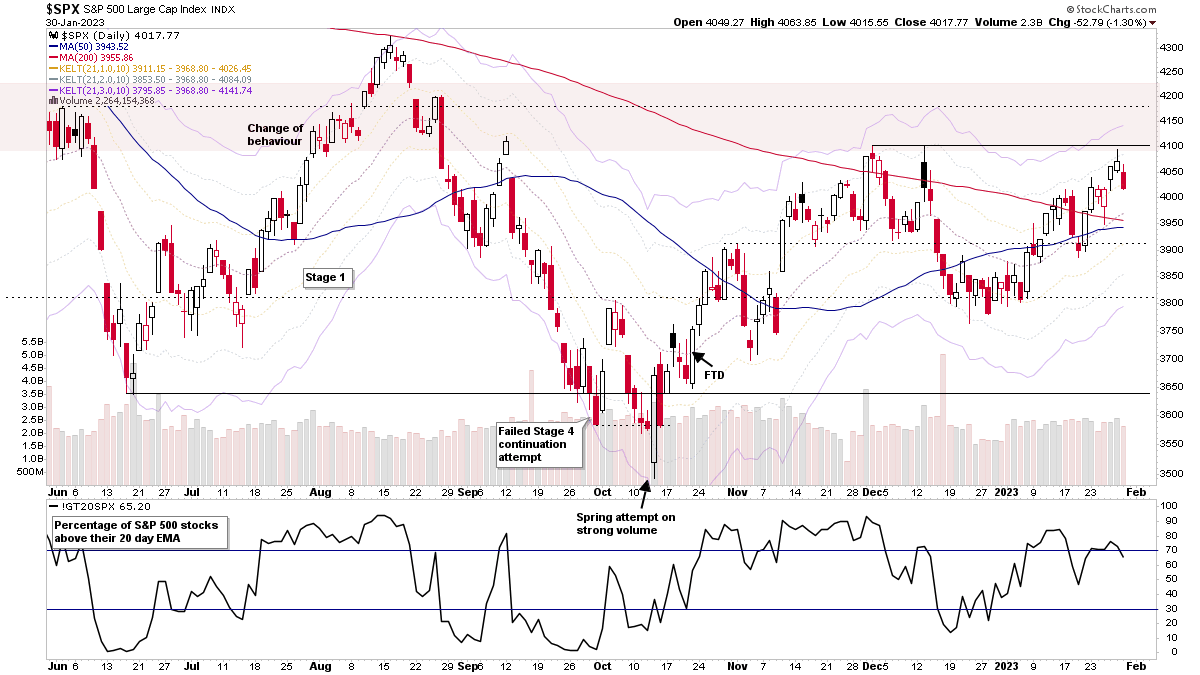
The market pulled back today at key resistance, with multiple market indexes testing their Stage 2 levels at the end of last week. The Fed meeting looms over the market this week, which will be a key driver as to whether the market breaks out into a potential early Stage 2 environment or fails once more and reverses lower – which was the pattern through 2022. So it could be a pivotal week...
Read More
24 January, 2023
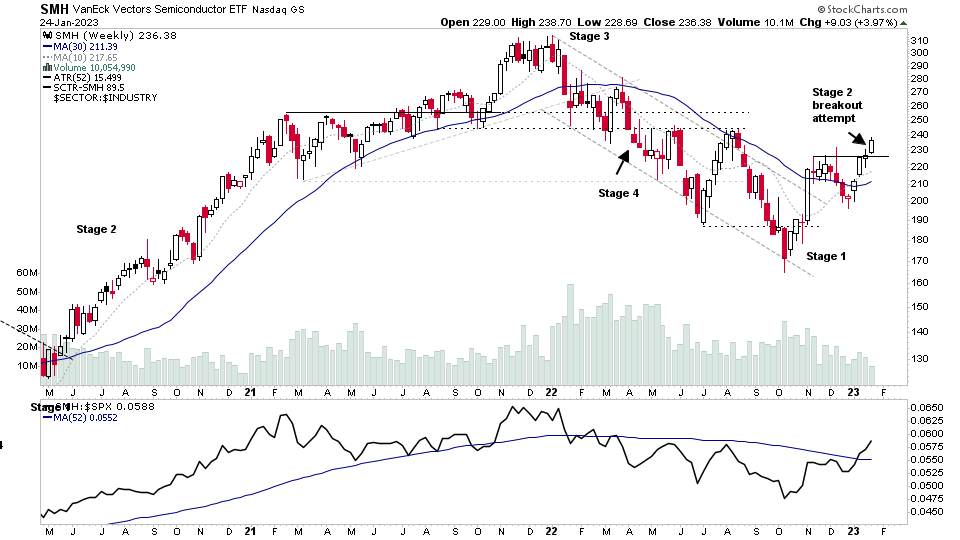
Semiconductors Attempting to Move into Stage 2 – US Stocks Watchlist – 25 January 2023
The week had a strong start with the Semiconductors group ETF SMH breaking out into potential Stage 2, with many stocks from the group doing the same. NVDA, AMAT, MPWR, TER to name a few...
Read More
23 January, 2023
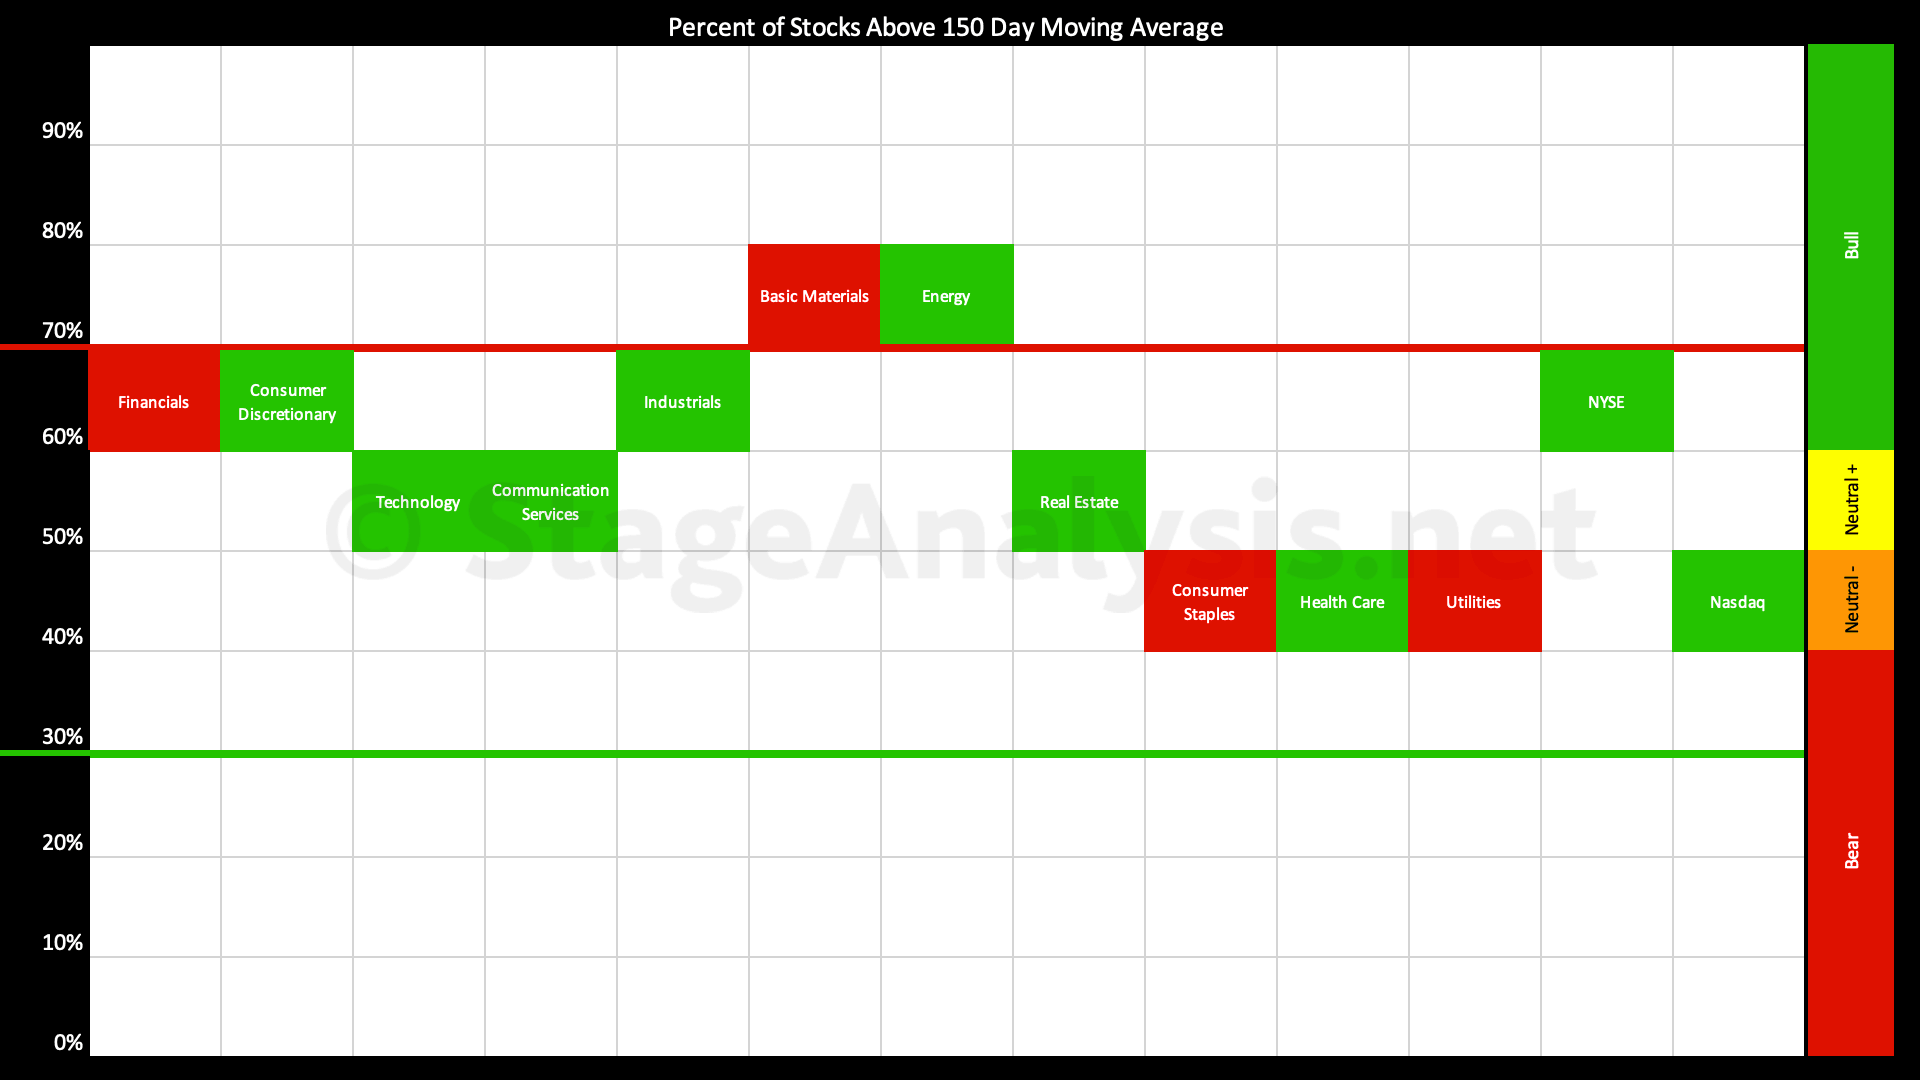
Sector Breadth: Percentage of US Stocks Above Their 150 day (30 Week) Moving Averages
The Percentage of US Stocks Above Their 150 day Moving Averages in the 11 major sectors has shown continued improvement over the last two weeks since the previous post of the 9th January 2023, increasing by a further +9.07% to 58.47% overall, which puts it at the top of the middle range (Neutral+), which is the Stage 1 zone.
Read More
22 January, 2023
Stage Analysis Members Video – 22 January 2023 (1hr 12mins)
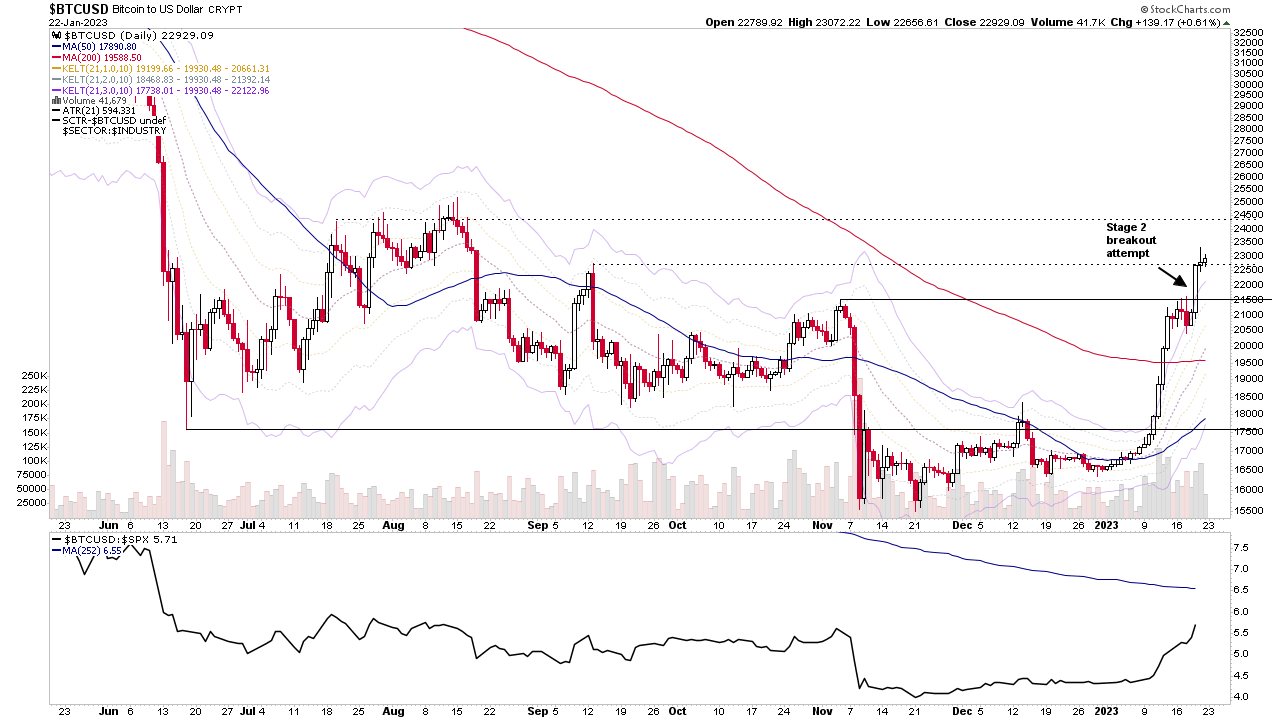
The Stage Analysis members weekend video featuring analysis of the early Stage breakout attempt in Bitcoin, and then the regular content with the major US Indexes, the futures charts, US Industry Groups RS Rankings, IBD Industry Groups Bell Curve - Bullish Percent, the Market Breadth Update to help to determine the Weight of Evidence and finishing with the US Stocks Watchlist in detail on multiple timeframes.
Read More
22 January, 2023
US Stocks Watchlist – 22 January 2023
For the watchlist from the weekend scans...
Read More
21 January, 2023
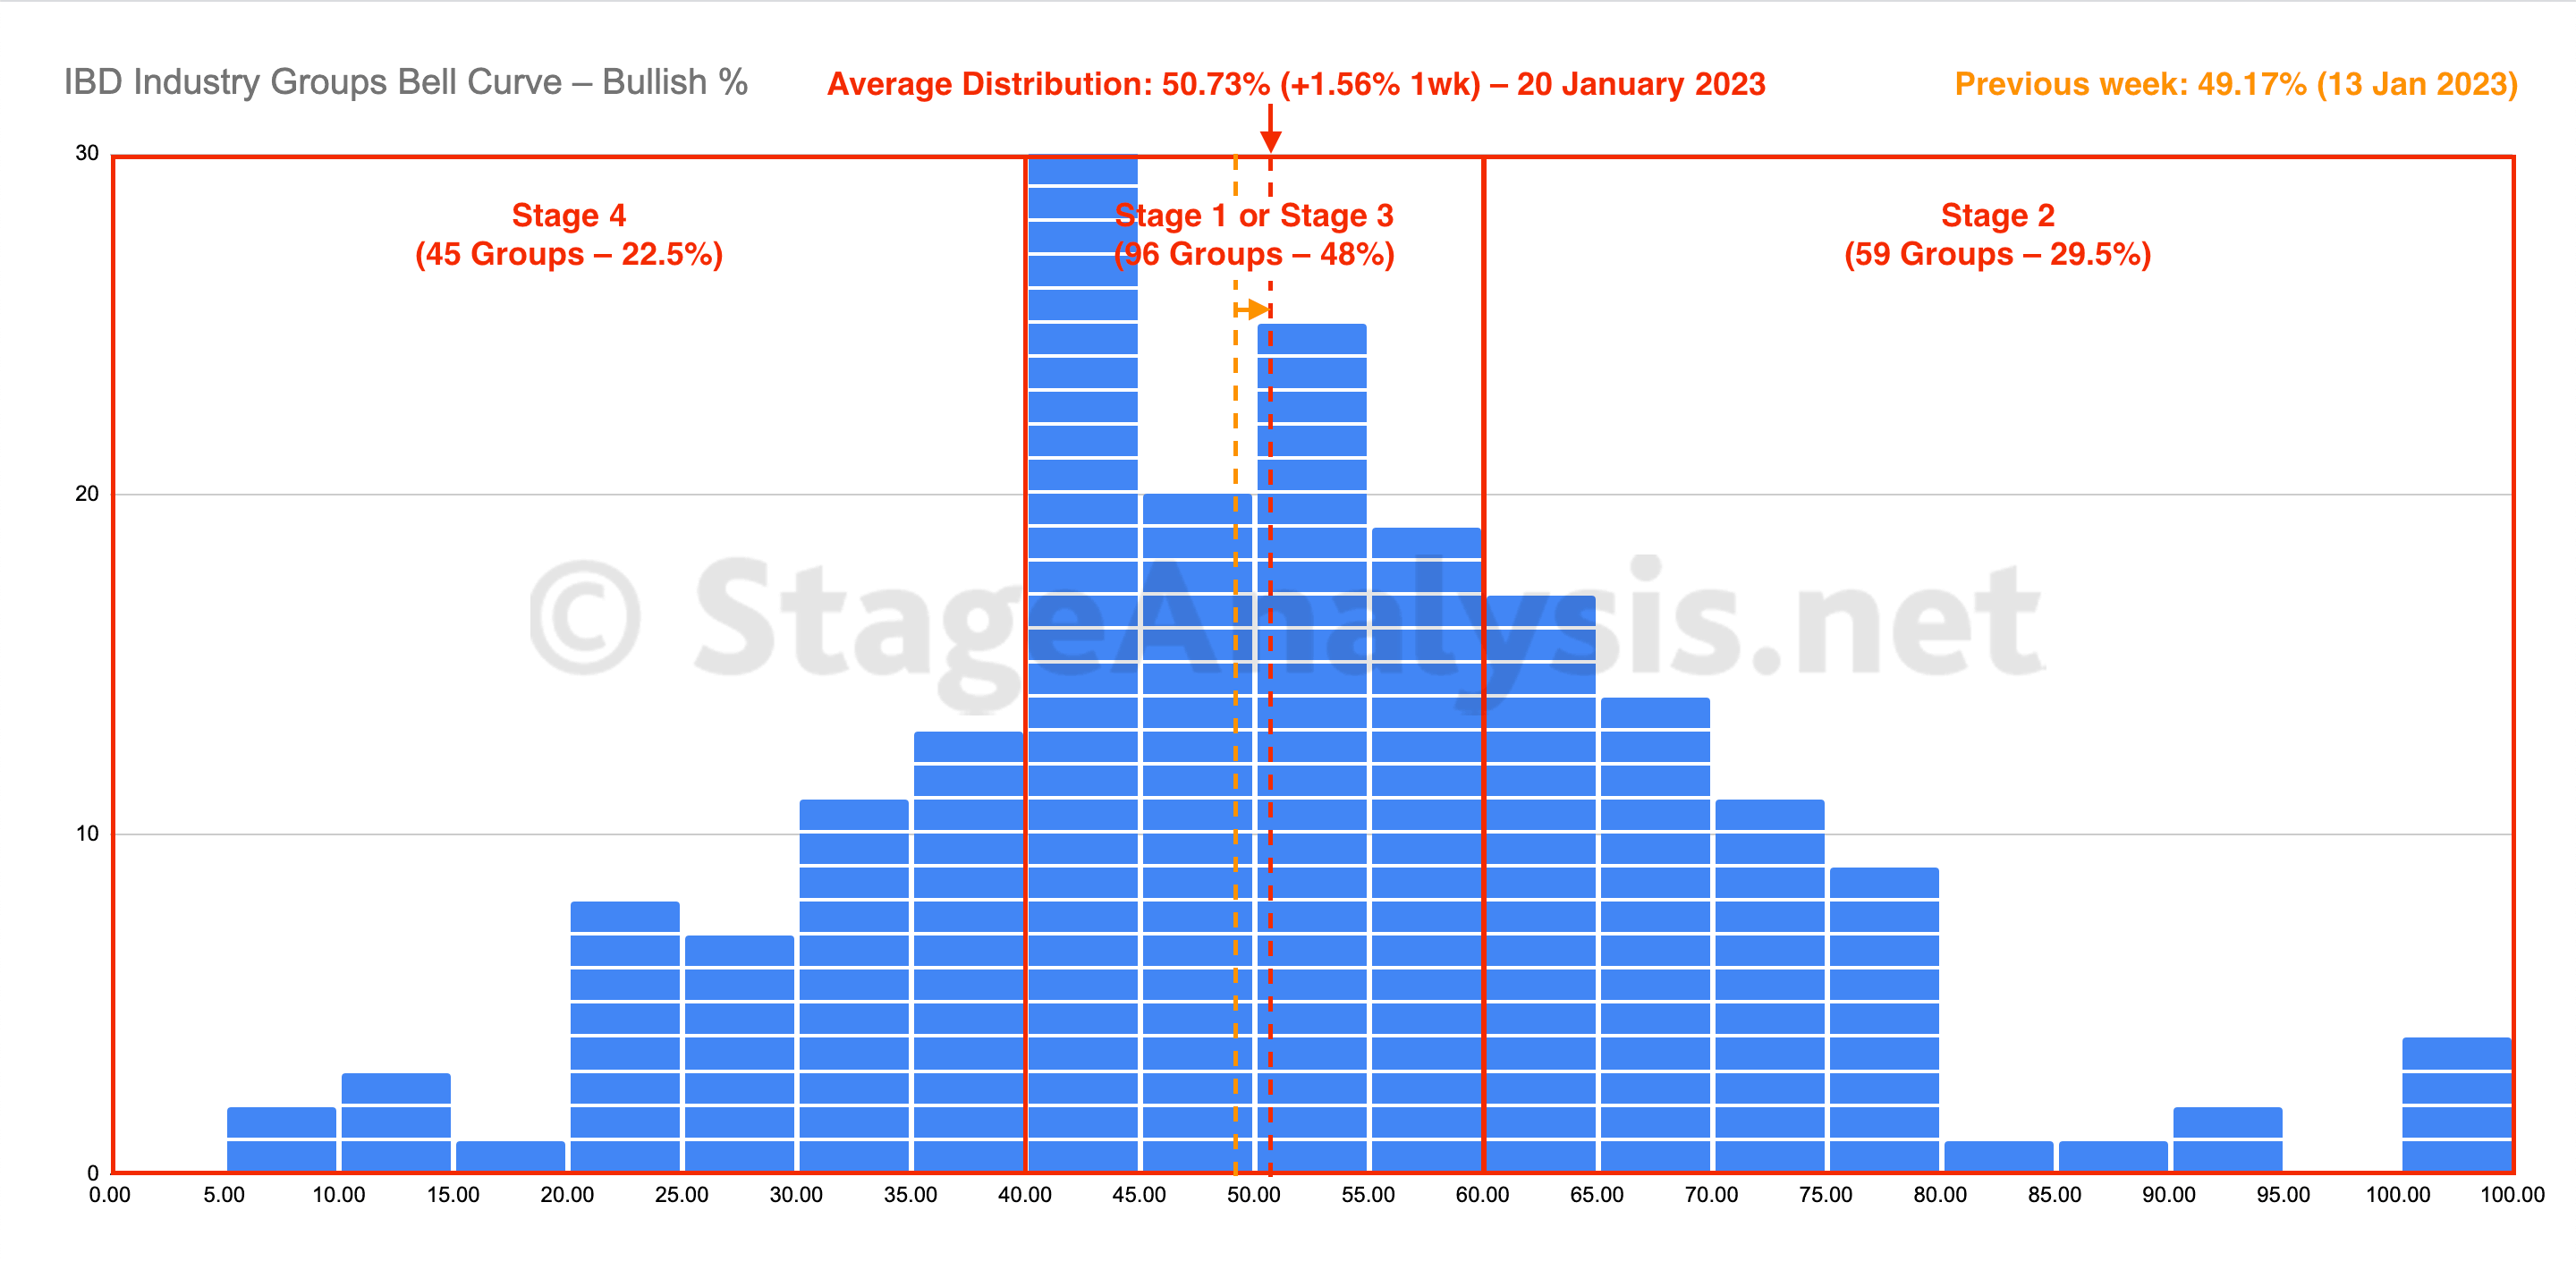
IBD Industry Groups Bell Curve – Bullish Percent
The IBD Industry Groups Bell Curve had a slight gain over the week of +1.56%. The amount of groups in Stage 4 decreased by -10 (-5%), and the amount of groups in Stage 2 increased by +9 (+4.5%), while the amount groups in Stage 1 or Stage 3 decreased by -1 (-0.5%).
Read More
21 January, 2023
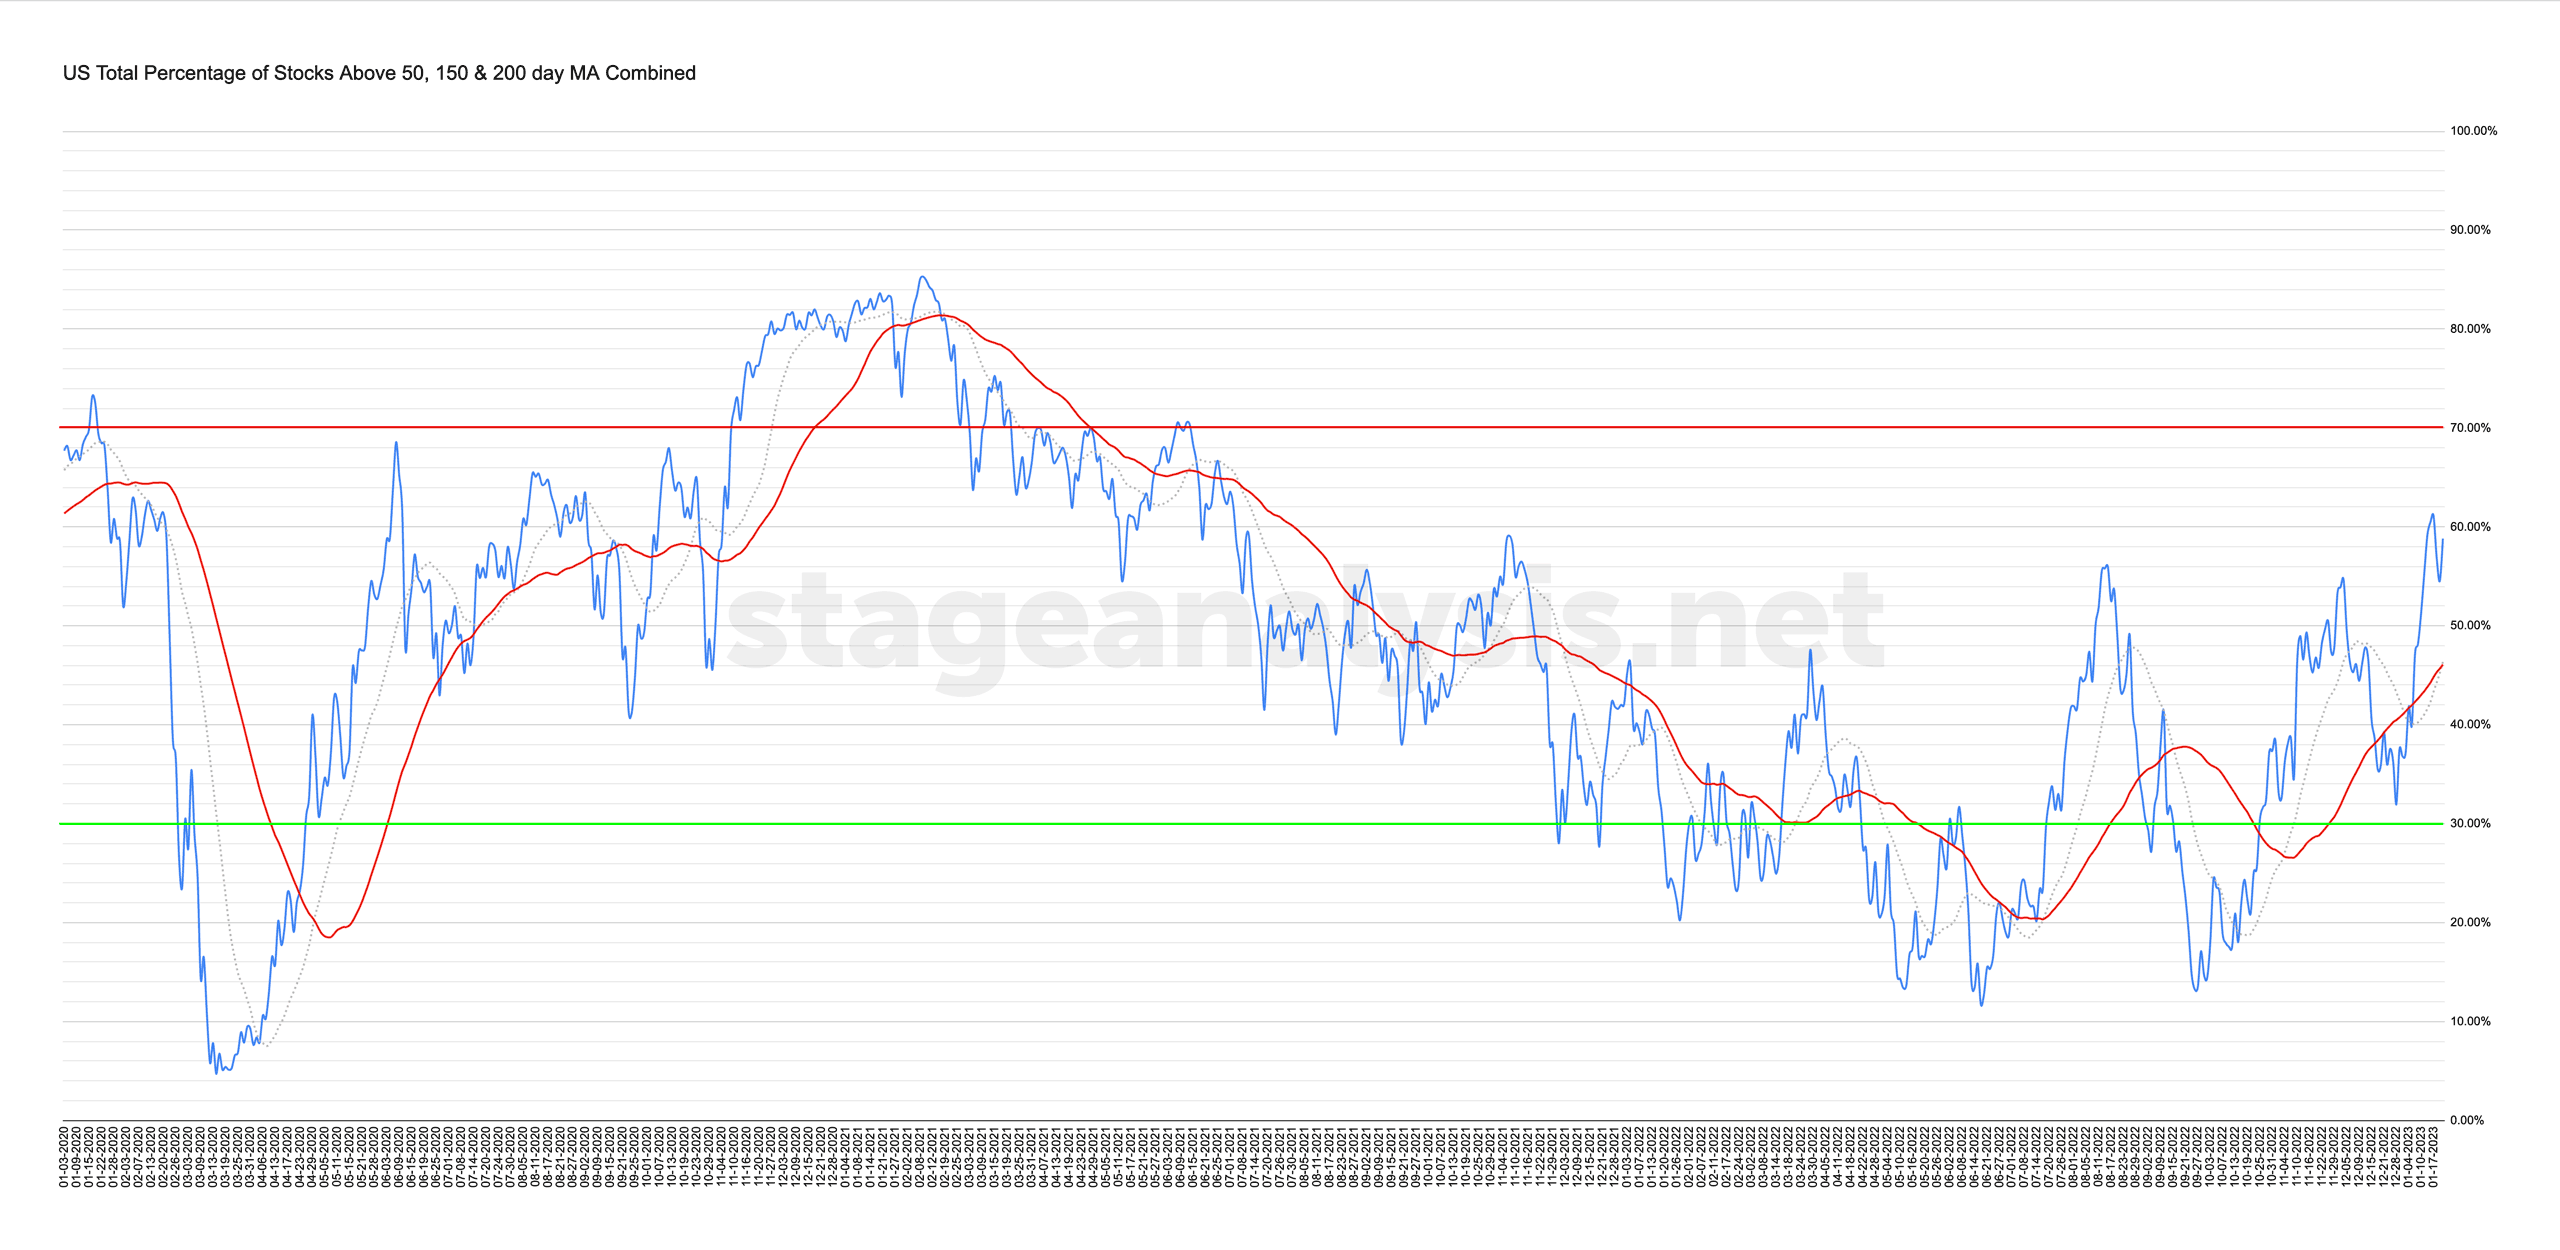
Market Breadth: Percentage of Stocks Above their 50 Day, 150 Day & 200 Day Moving Averages Combined
Custom Percentage of Stocks Above Their 50 Day, 150 Day & 200 Day Moving Averages Combined Market Breadth Charts for the Overall US Market, NYSE and Nasdaq for Market Timing and Strategy.
Read More
20 January, 2023
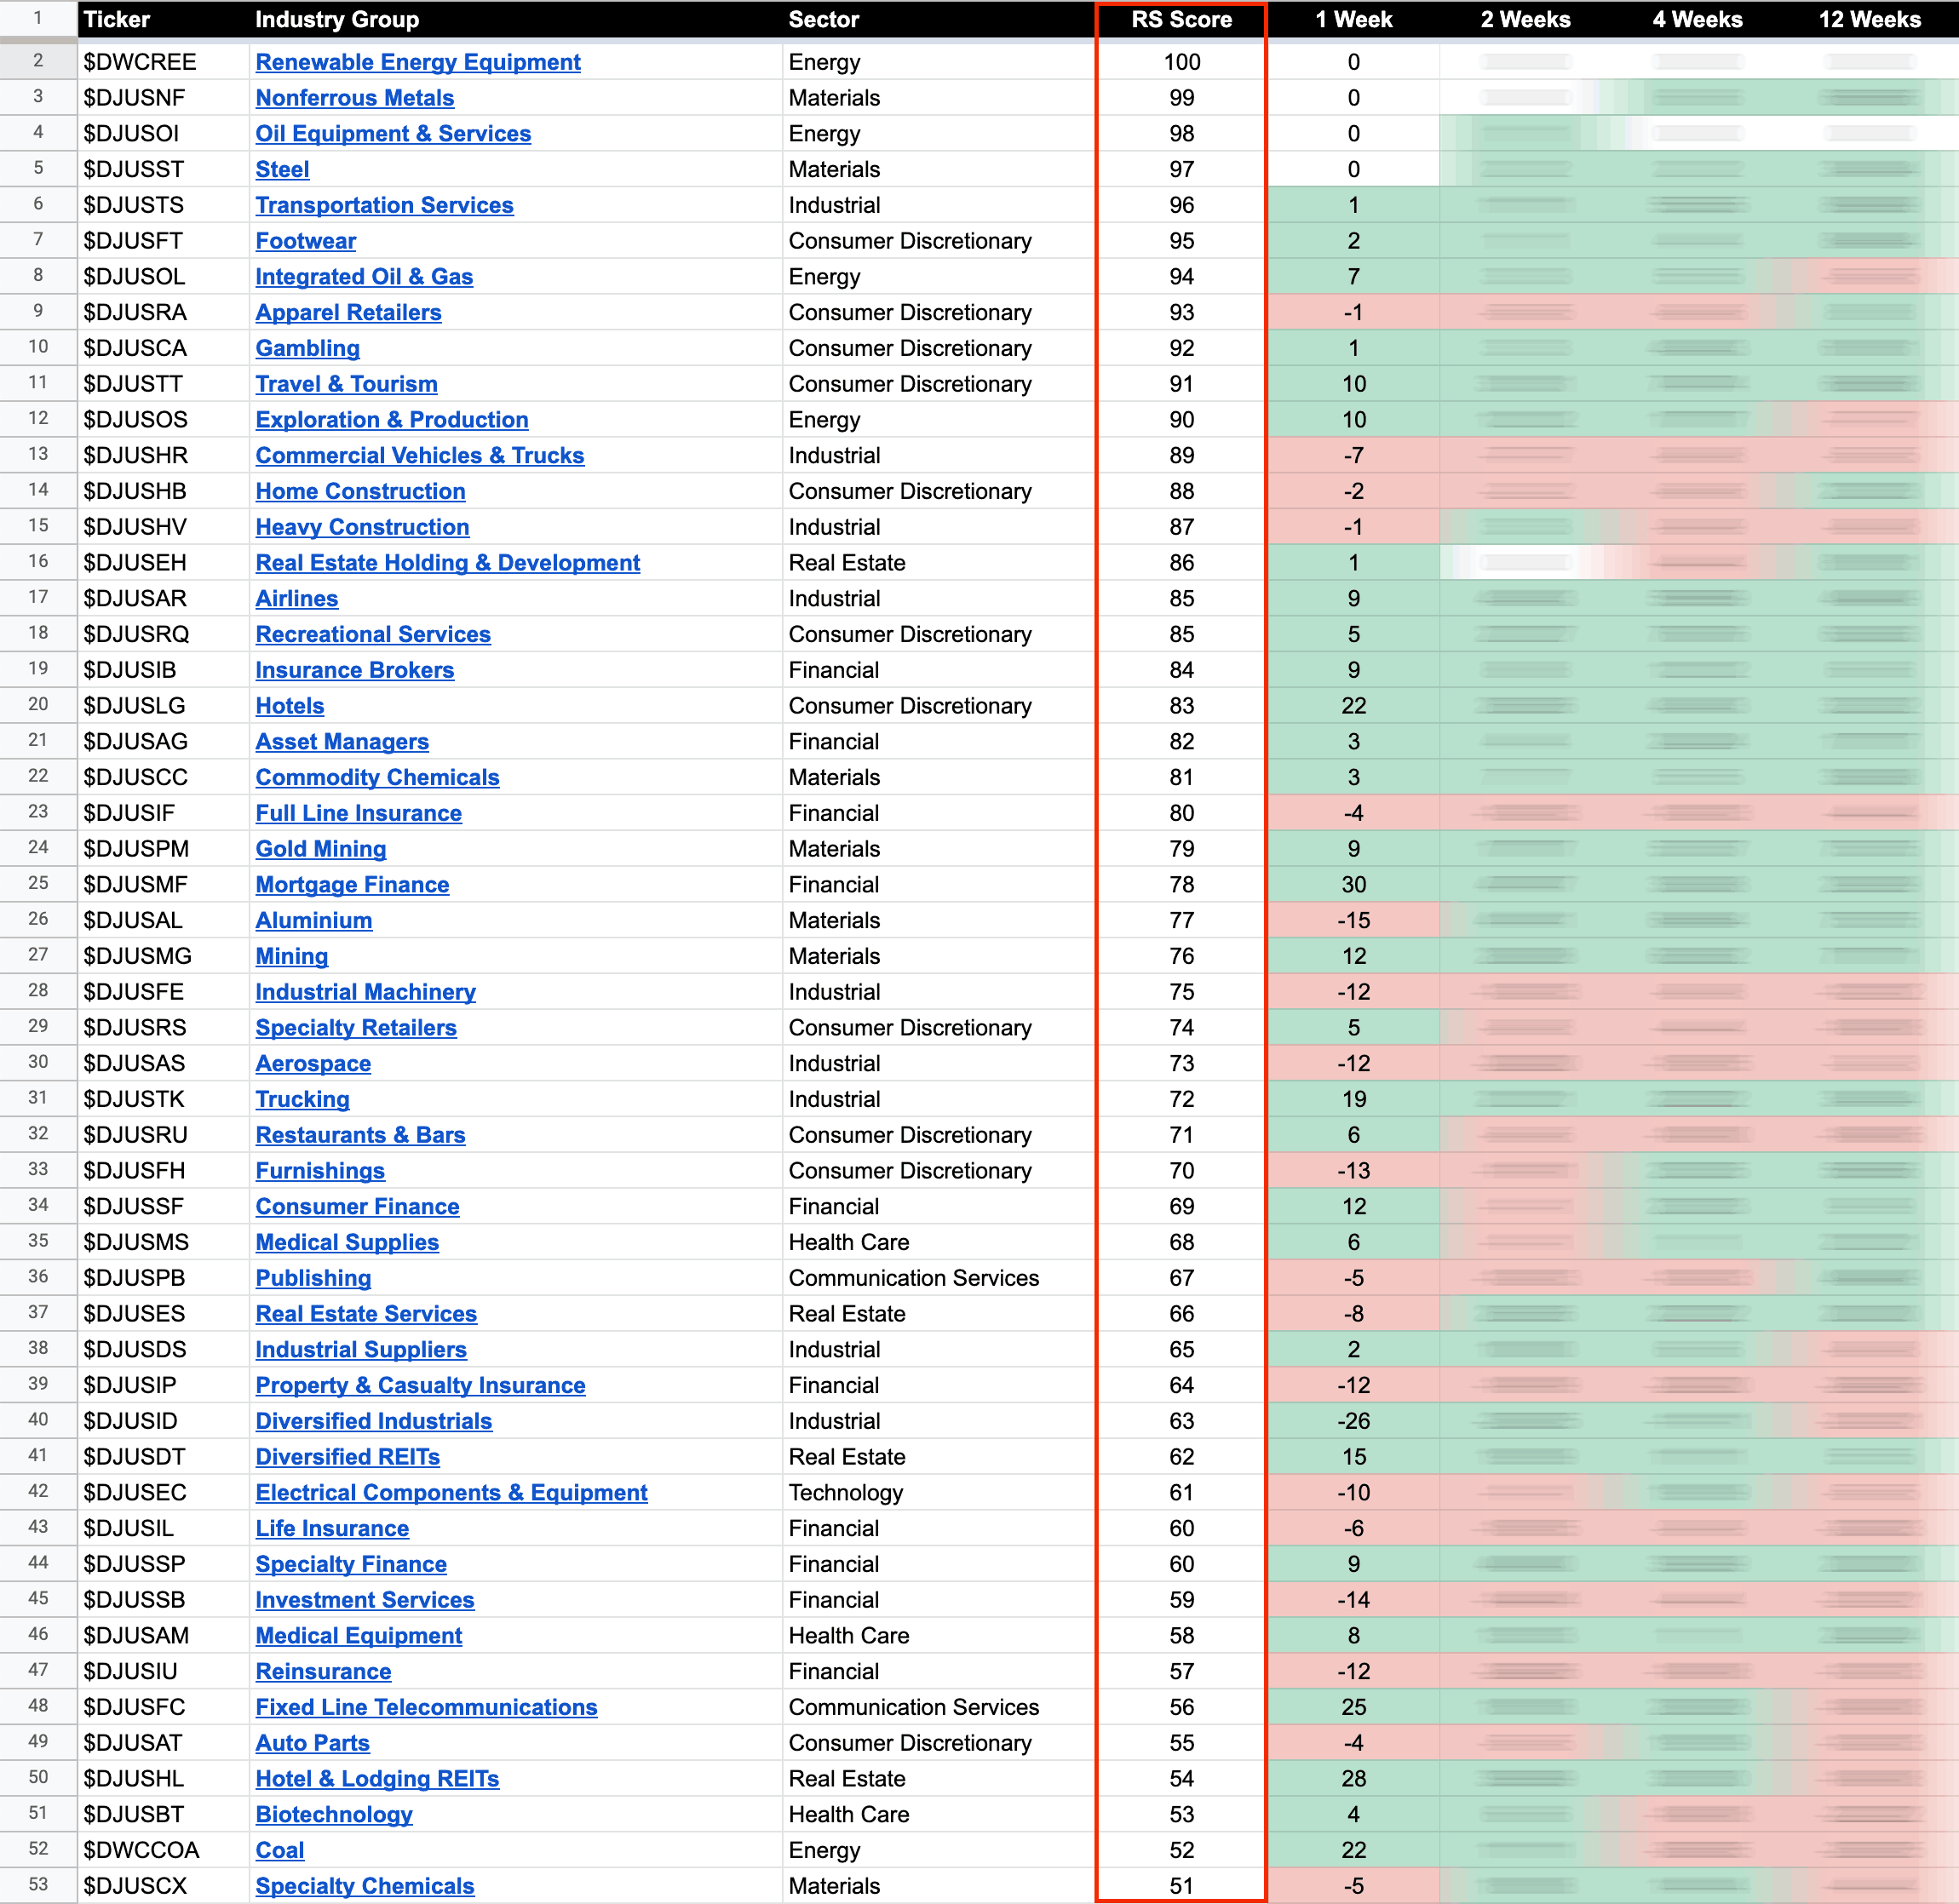
US Stocks Industry Groups Relative Strength Rankings
The purpose of the Relative Strength (RS) tables is to track the short, medium and long term RS changes of the individual groups to find the new leadership earlier than the crowd...
Read More
19 January, 2023
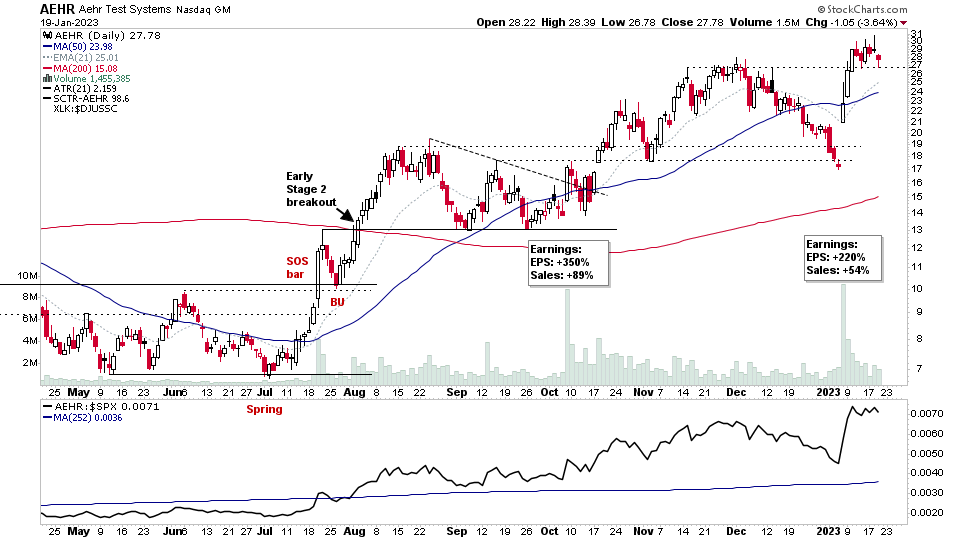
US Stocks Watchlist – 19 January 2023
There were 35 stocks highlighted from the US stocks watchlist scans today...
Read More

