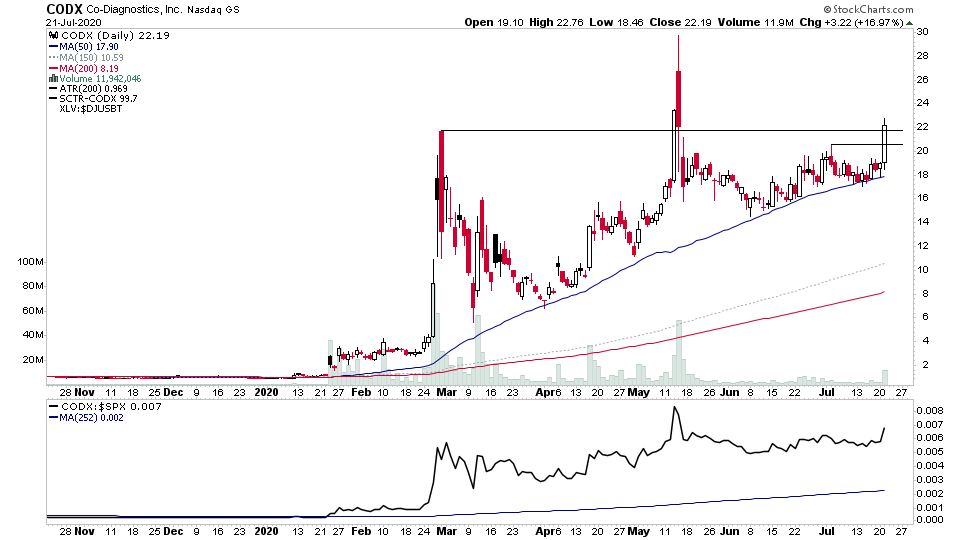
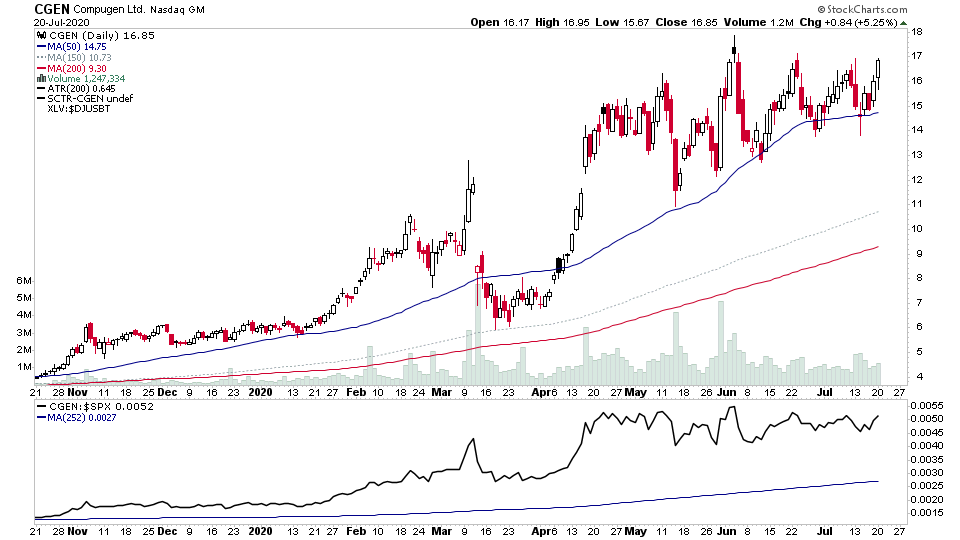
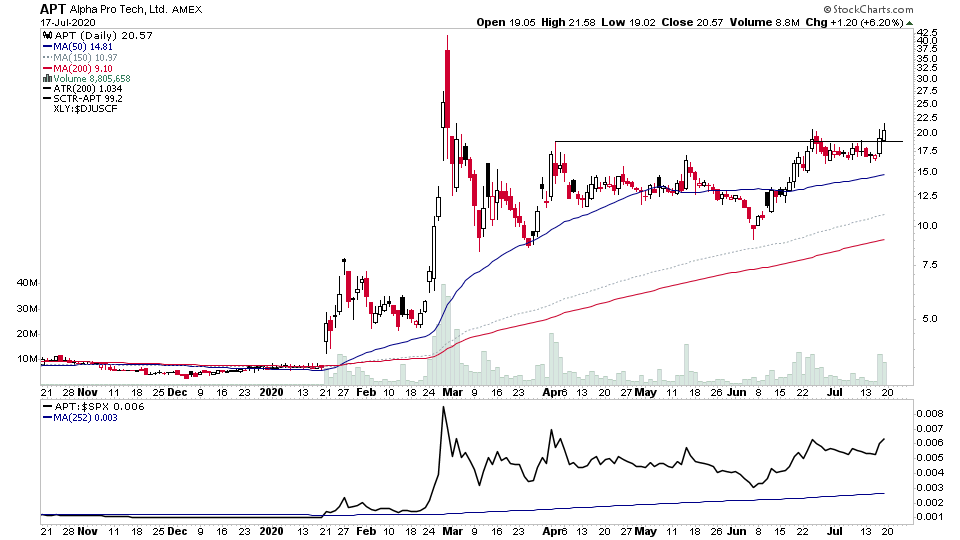
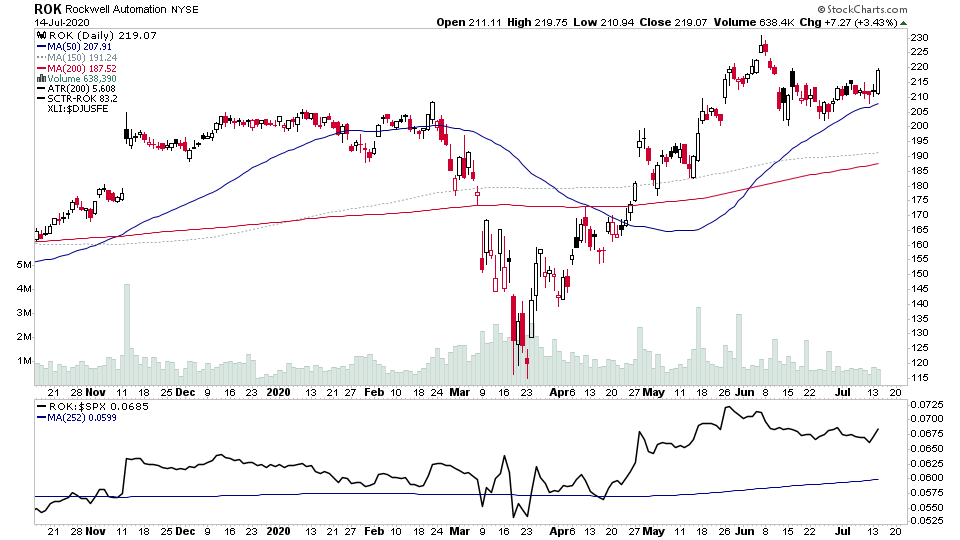
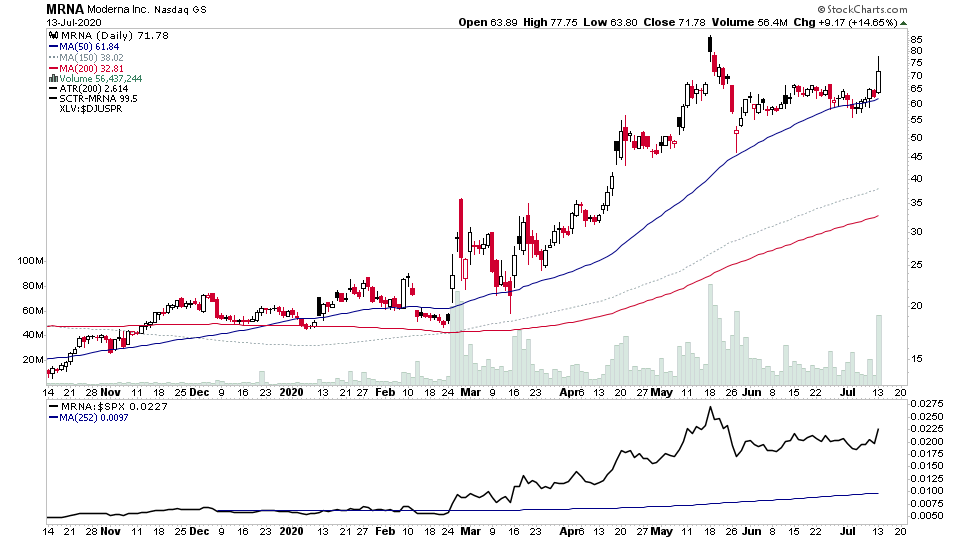
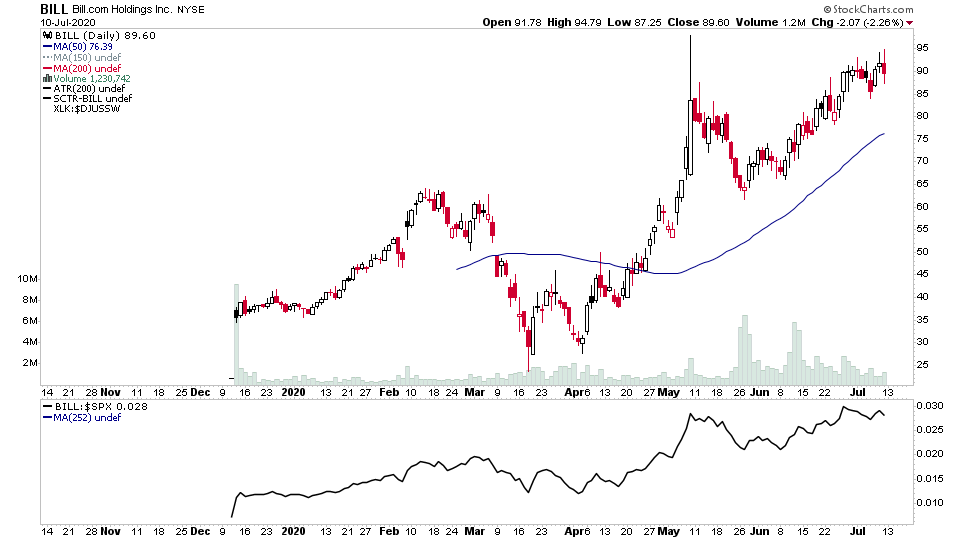
With earnings season picking up steam its notable that there's a number of gap breakouts appearing in my scans today, of which a few have made it into the watchlist due to their volume on the gap, and as Mark Minervini said earlier today in a post – "That's not your Aunt Betty buying"
Read More
Blog
21 July, 2020
US Breakout Stocks Watchlist - 21 July 2020
20 July, 2020
US Breakout Stocks Watchlist - 20 July 2020
Technology and Healthcare back dominating the watchlist again today as the leaders had a strong rebound after lagging over the last week...
Read More
19 July, 2020
US Breakout Stocks Watchlist - 19 July 2020
A varied bunch from the weekend scans with some cup and handle breakout attempts, volatility contraction patterns and some other less defined patterns...
Read More
19 July, 2020
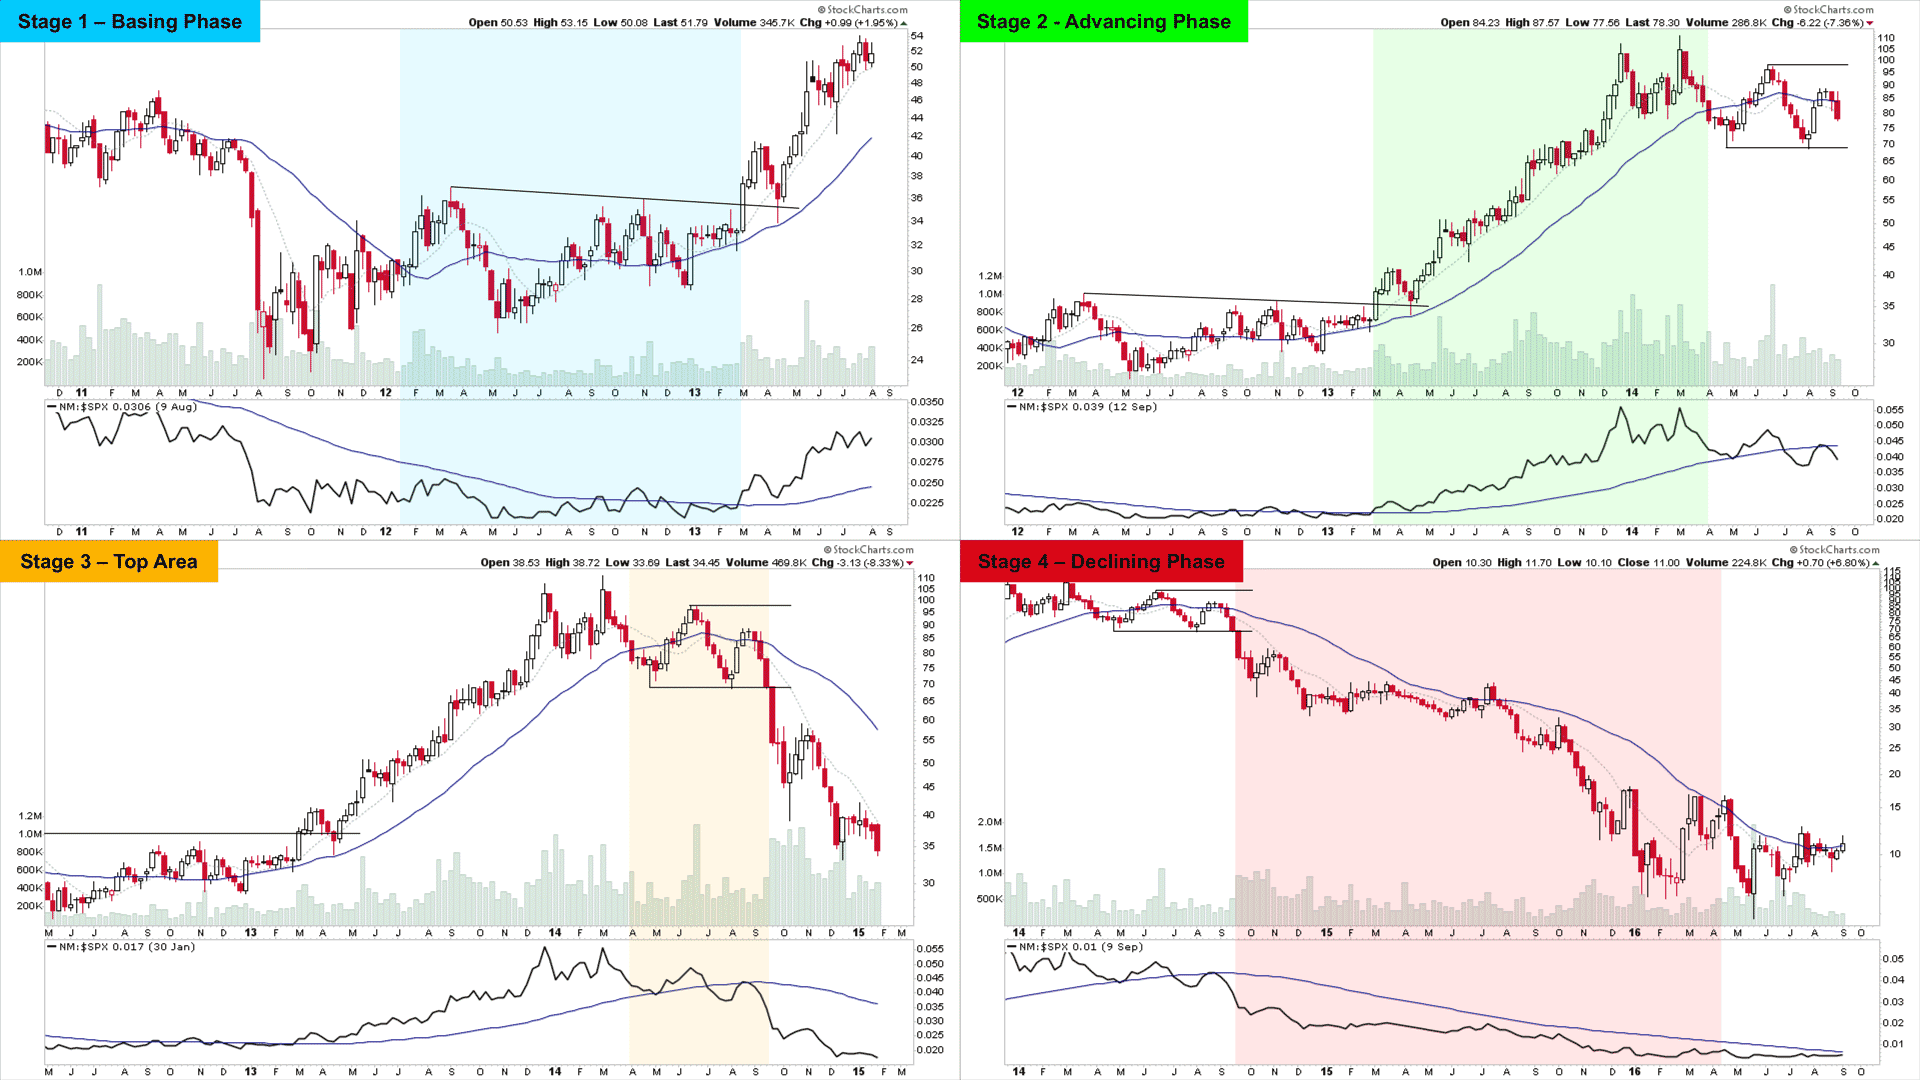
Is the S&P 500 About to Breakout Into the Stage 2 Advancing Phase? Stock Market Breadth Update
Regular update of the major US stock market indexes and indicators. A regular look beneath the surface of the US stock market, featuring the key market breadth charts for timing trading stocks and the stock market indexes, such as the NYSE Bullish Percent Index, the Advance Decline Line, the New Highs - New Lows etc and some custom breadth indicators of my own in order to determine what the "Weight of Evidence" is suggesting in terms of the US stock market direction and how to allocate your money.
Read More
16 July, 2020
US Breakout Stocks Watchlist - 16 July 2020
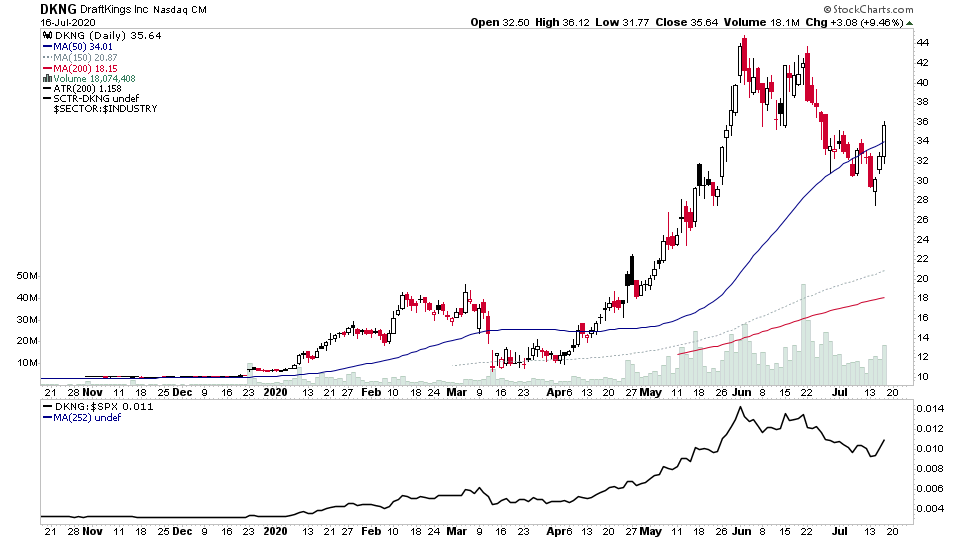
For the watchlist from Thursdays scans - APT, AUDC, BBY, DELL, DKNG, ENV, KHC, ROP, SPCE, WRTC, Z
Read More
15 July, 2020
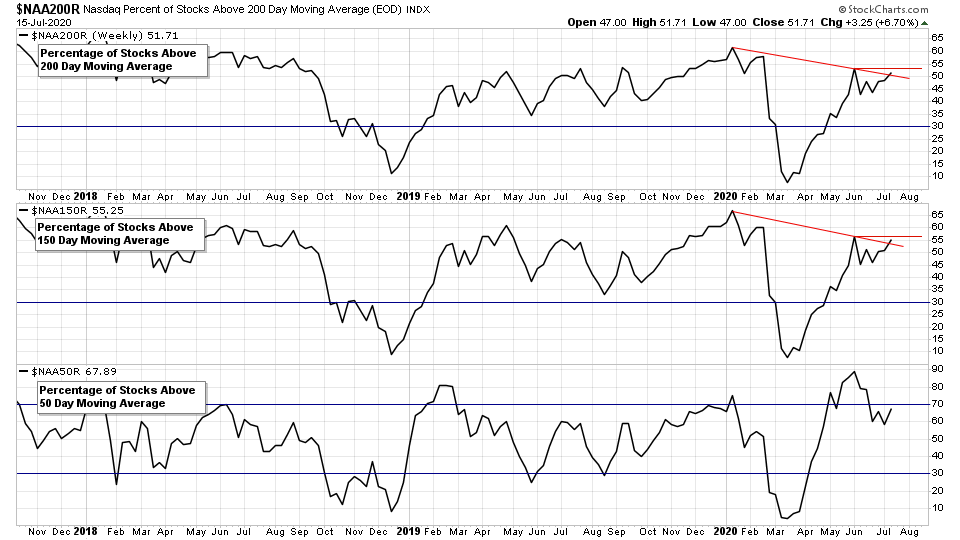
Trendline Breakouts in the Percentage of Stocks Above Their 200 day, 150 day and 50 day Moving Averages
Trendline breakouts today in the #nasdaq and #nyse Percentage of Stocks Above Their long term 200 day MAs, and medium term 150 day MAs. A further close above the horizontal pivot would be a strong signal imo
Read More
15 July, 2020
US Breakout Stocks Watchlist - 15 July 2020
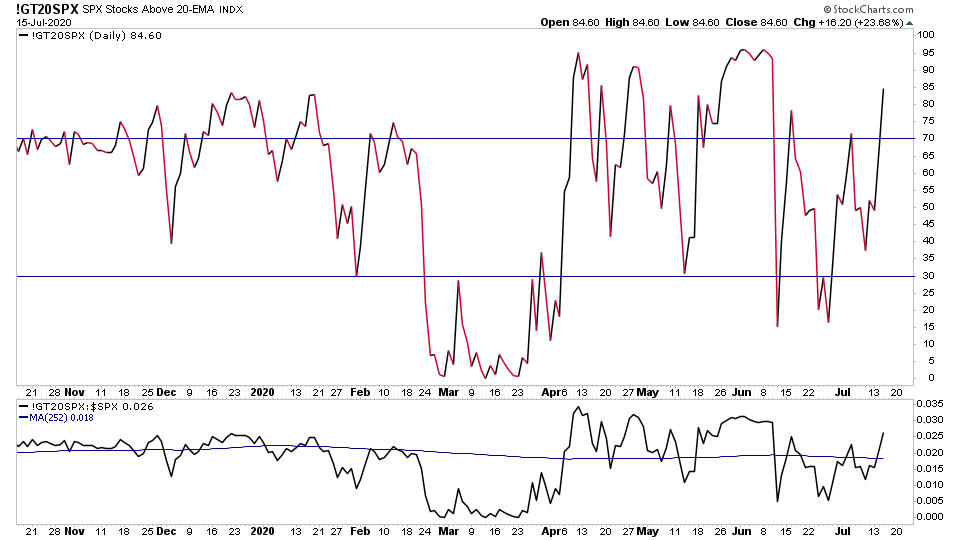
Notable today, was the multiple breakouts on the Percentage of Stocks above their 20 day MA charts, back to the upper zone after pulling back over the last month, which is very healthy. And also the VIX is once more close to its 200 day MA. So could test it tomorrow again...
Read More
14 July, 2020
US Breakout Stocks Watchlist - 14 July 2020
A big reversal today after yesterdays selloff with a lot of rotation, as the weaker areas of the market showed the best relative strength. A particular area I noted in my scans tonight was numerous consumer staples stocks breaking out from bases.
Read More
13 July, 2020
US Breakout Stocks Watchlist - 13 July 2020
A big negative distribution day today, with stocks pushing higher early and then reversing and closing down strongly. My portfolio had an 8% range on the day. So was a big swing with many leaders reversing hard like TSLA. But one day does not make a trend and earnings season kicks off tomorrow...
Read More
12 July, 2020
US Breakout Stocks Watchlist - 12 July 2020
With the VIX knocking on the door of the 200 day MA once more and the S&P 500 consolidating near the top of its recent range in a cup and handle pattern. This week could see some rotation once more if the S&P 500 can breakout...
Read More

