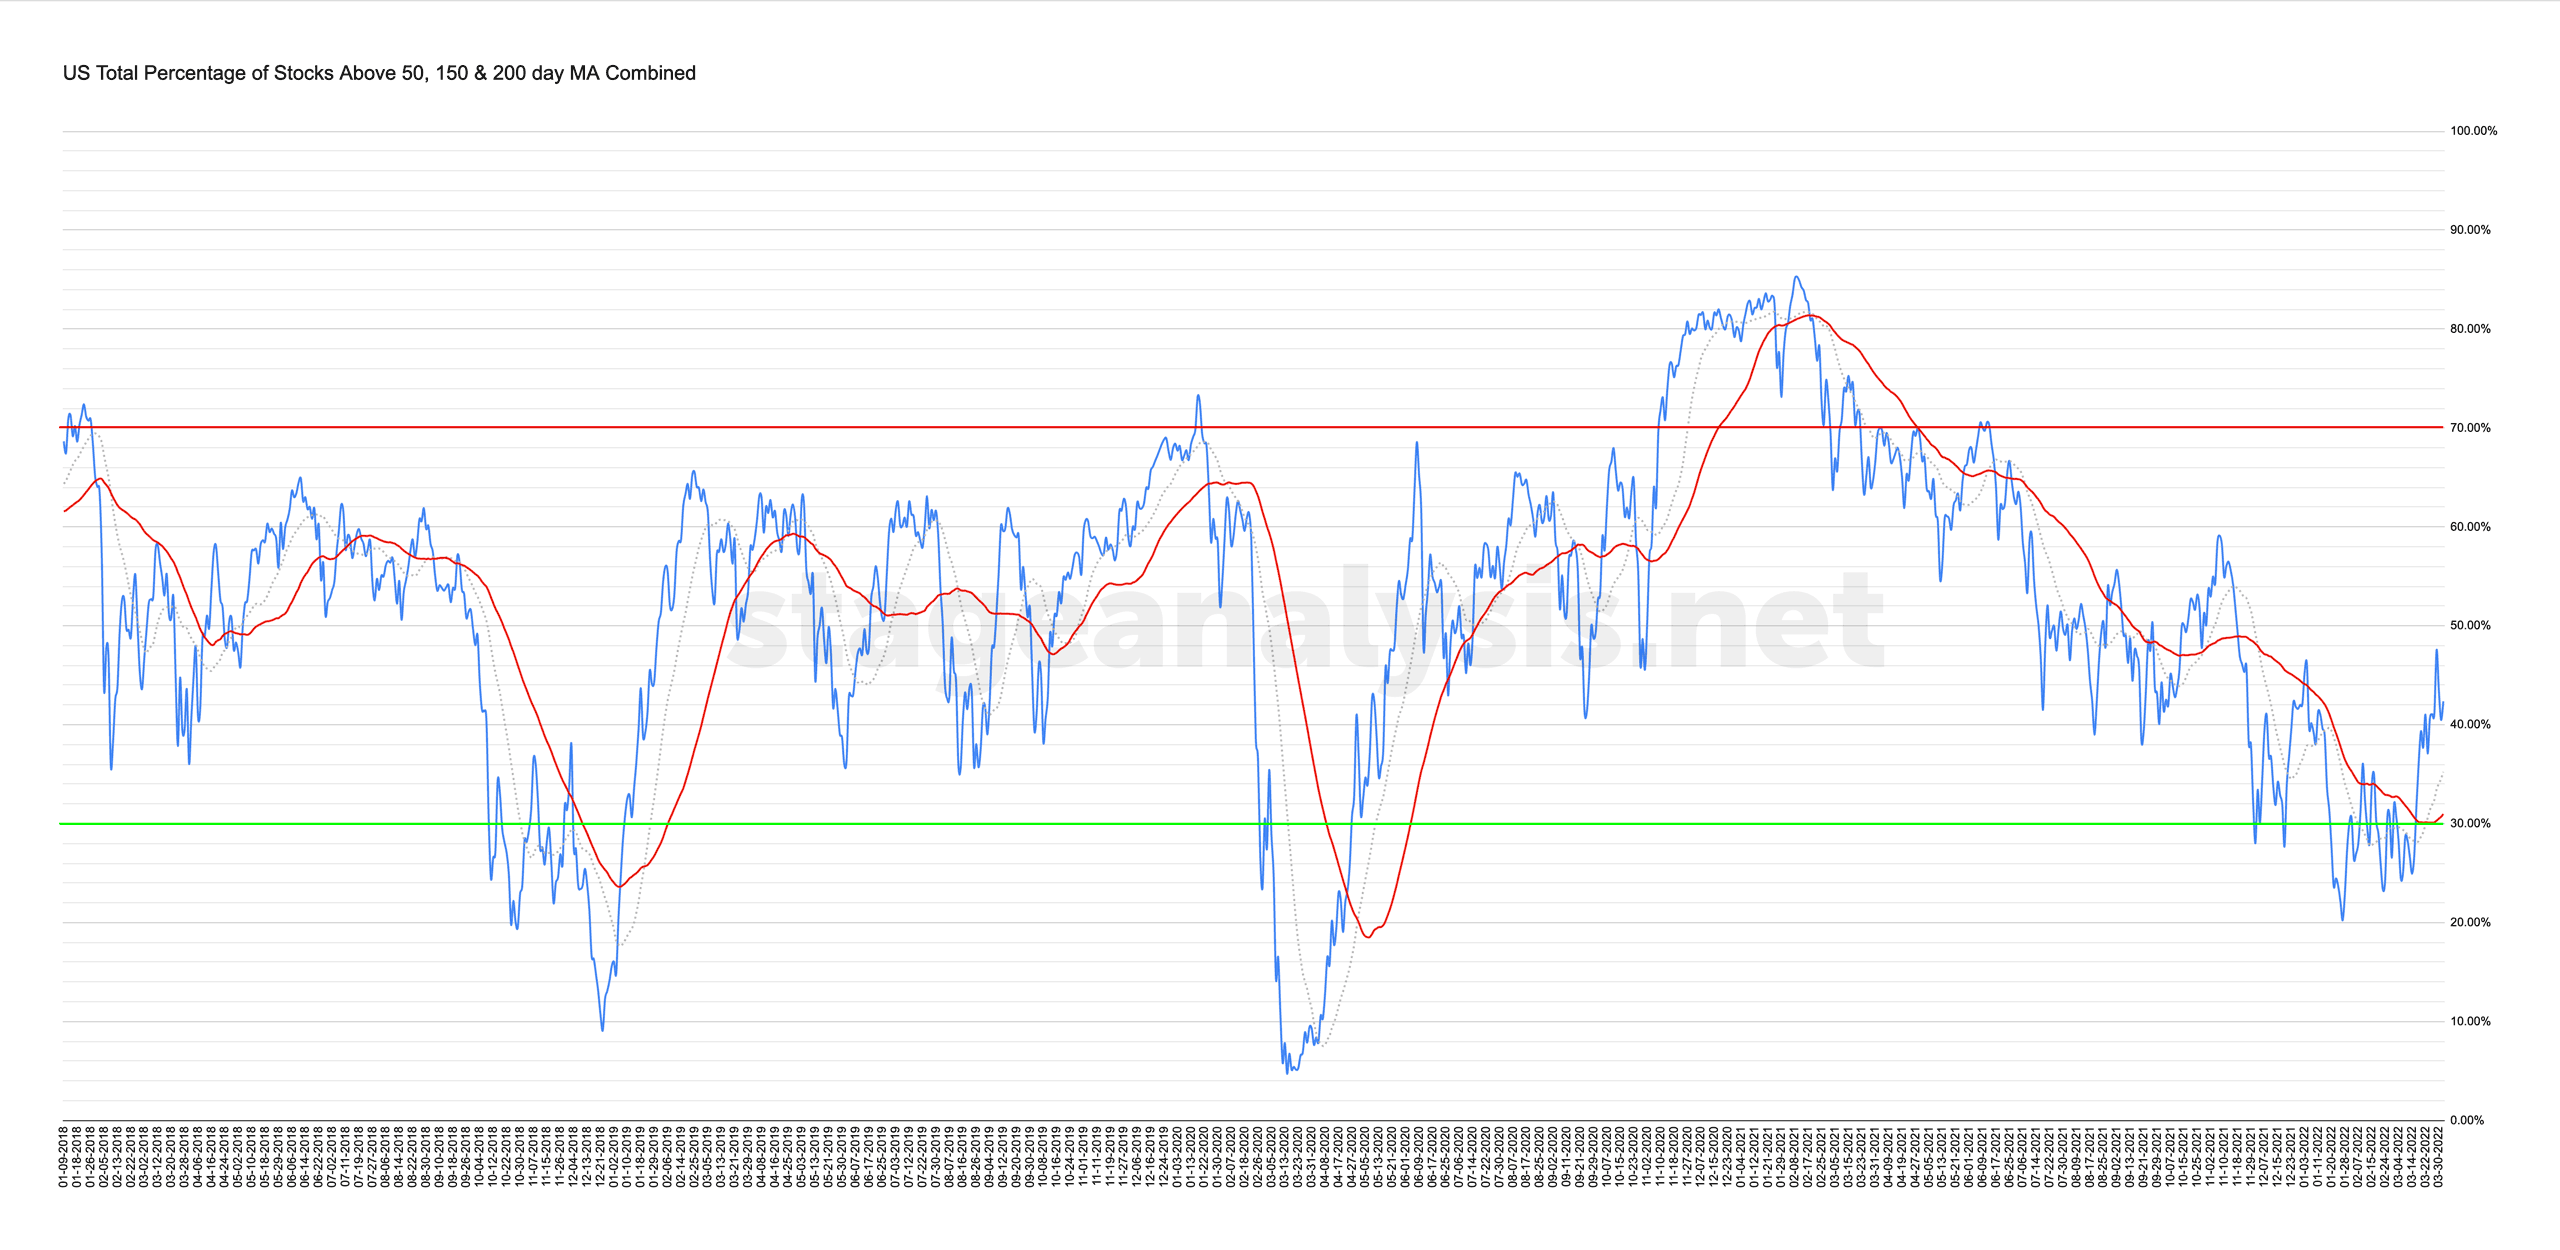
Custom Percentage of Stocks Above Their 50 Day, 150 Day & 200 Day Moving Averages Combined Market Breadth Charts for the Overall US Market, NYSE and Nasdaq for Market Timing and Strategy.
Read More
Blog
01 April, 2022
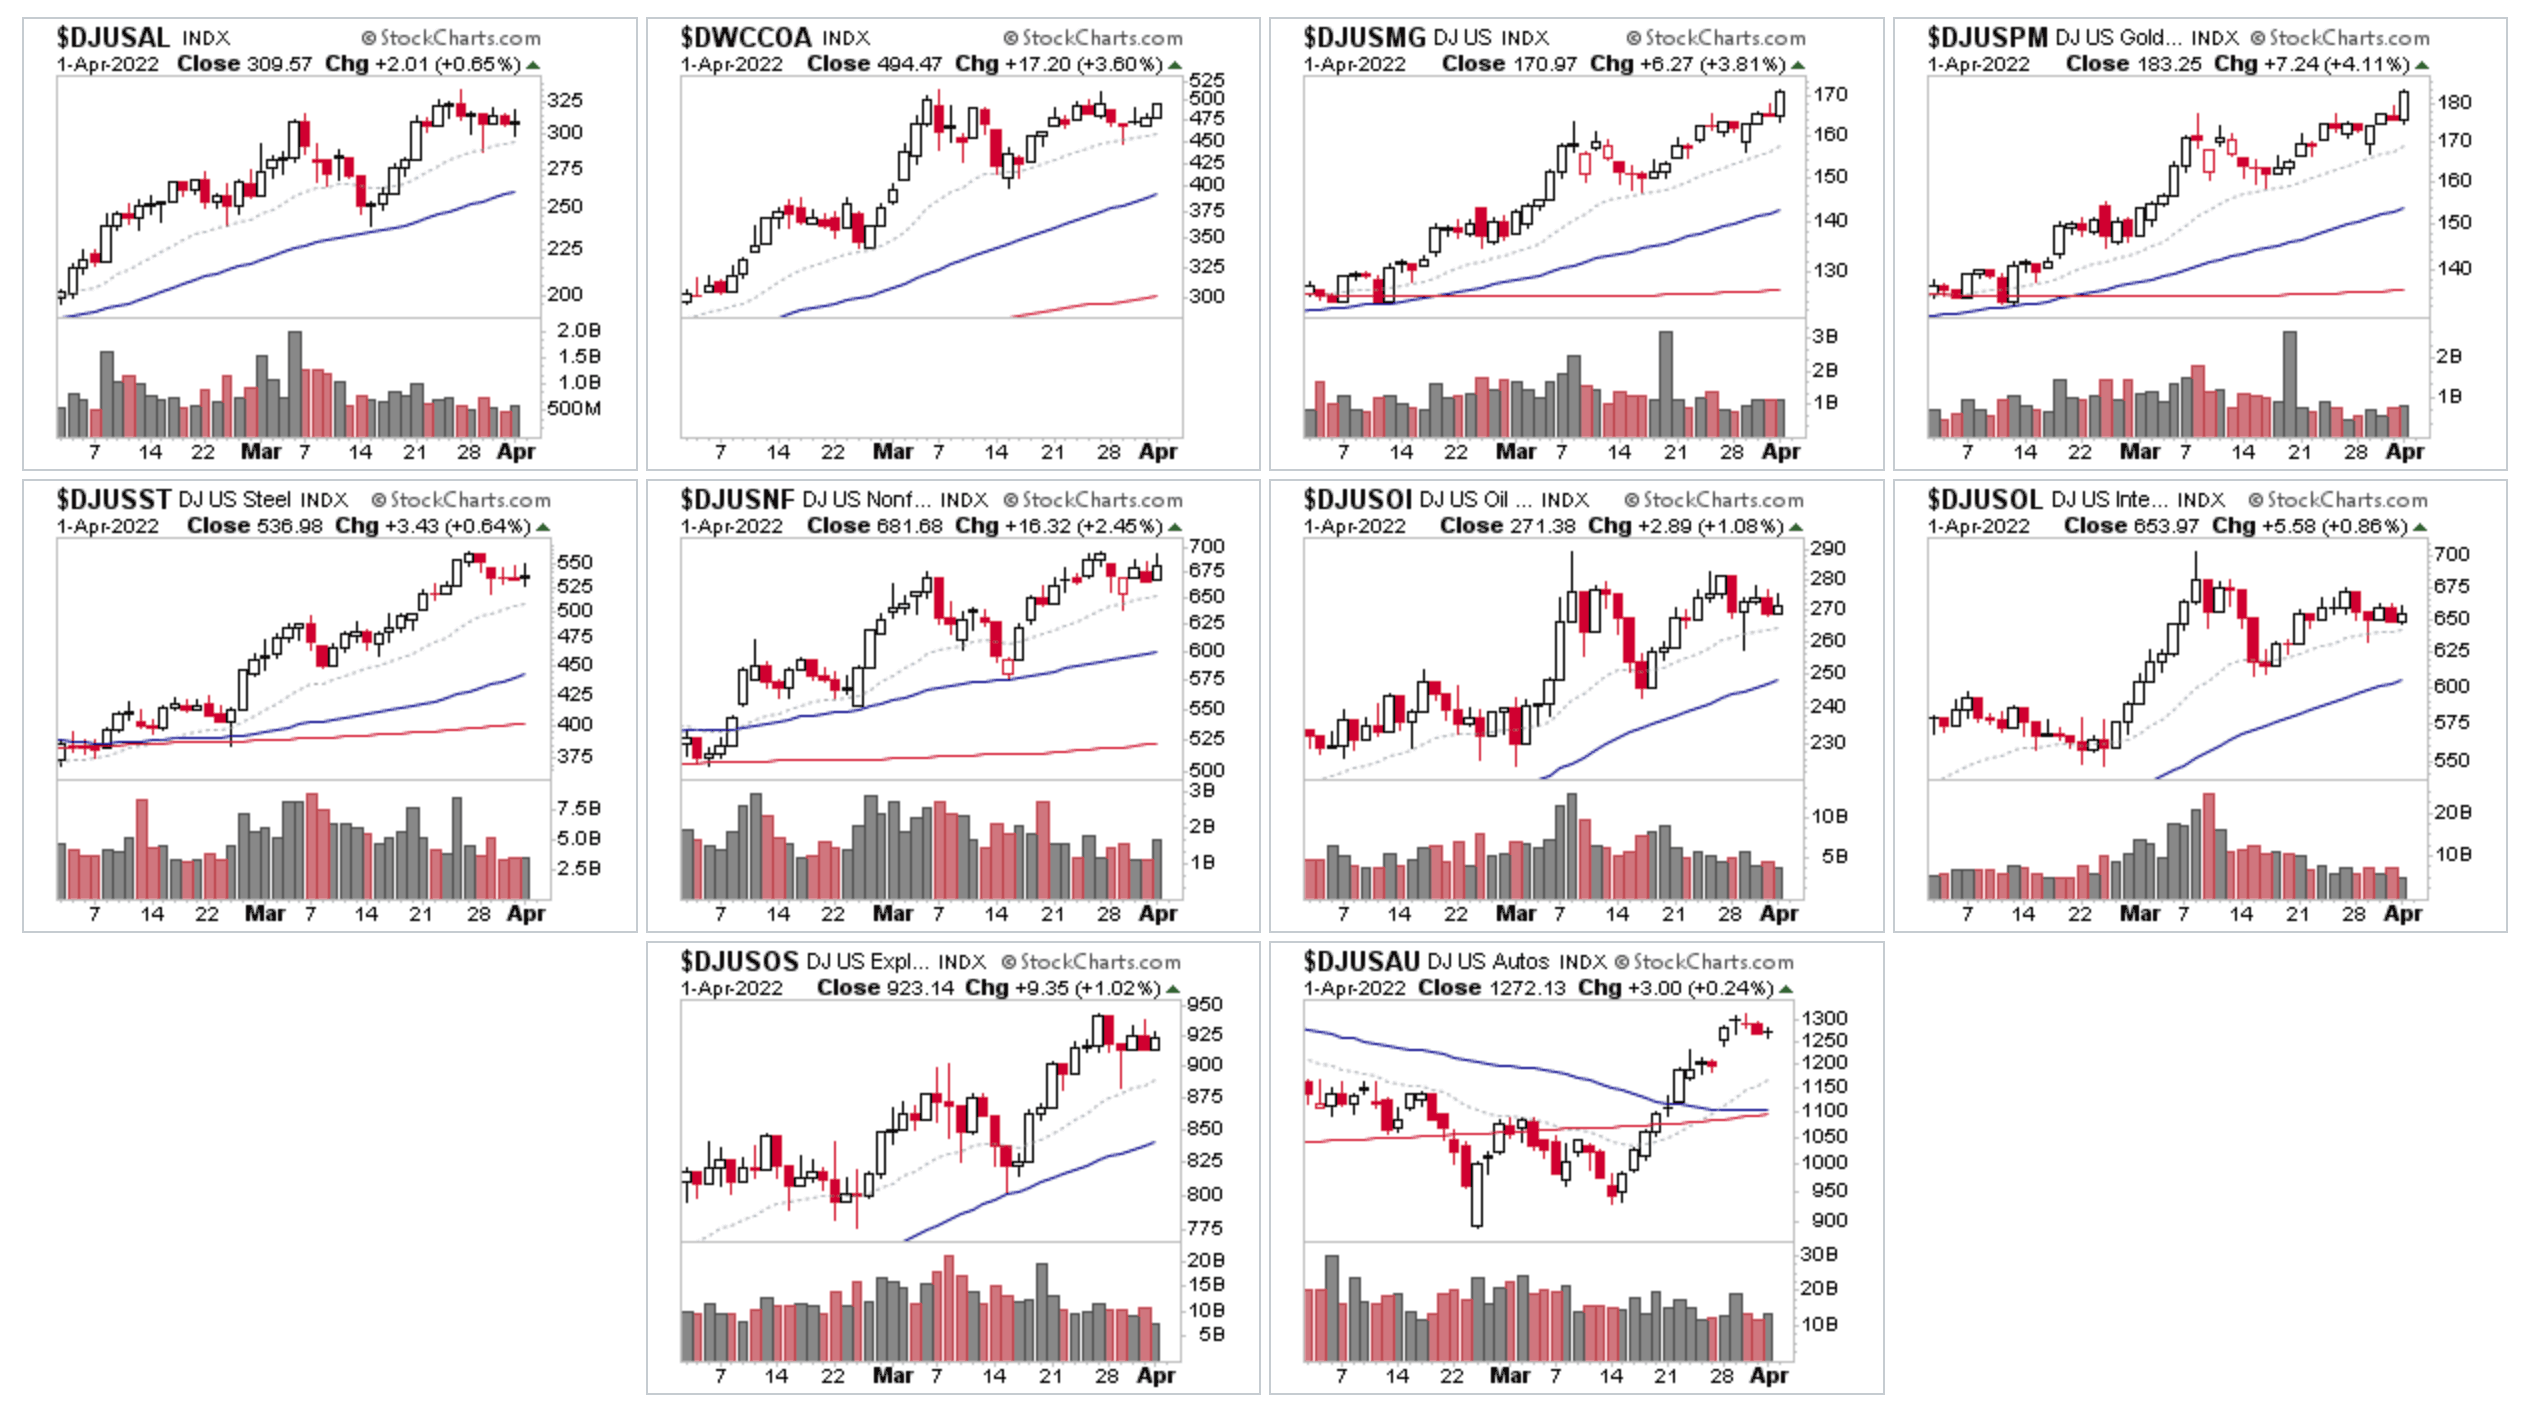
US Stocks Industry Groups Relative Strength Rankings
The purpose of the RS tables is to track the short, medium and long term RS changes of the individual groups to find the new leadership earlier than the crowd...
Read More
31 March, 2022
US Stocks Indexes Pullback into the End of the First Quarter - 31 March 2022
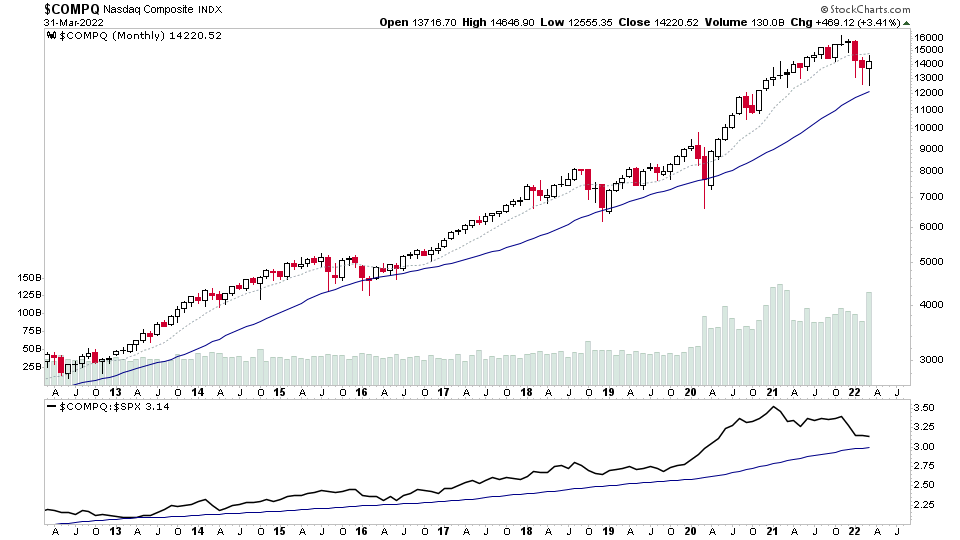
A strong pullback at the end of the day in the US stock market, which dropped the indexes back into the recent ranges. The Nasdaq Composite for example (see above) has formed an Upthrust (UT) at the top of the range, and todays sharp drop saw it close around an area that has acted as support and resistance on multiple occasions in the last year. So it is a potential level of interest to see how it reacts against in the coming days.
Read More
31 March, 2022
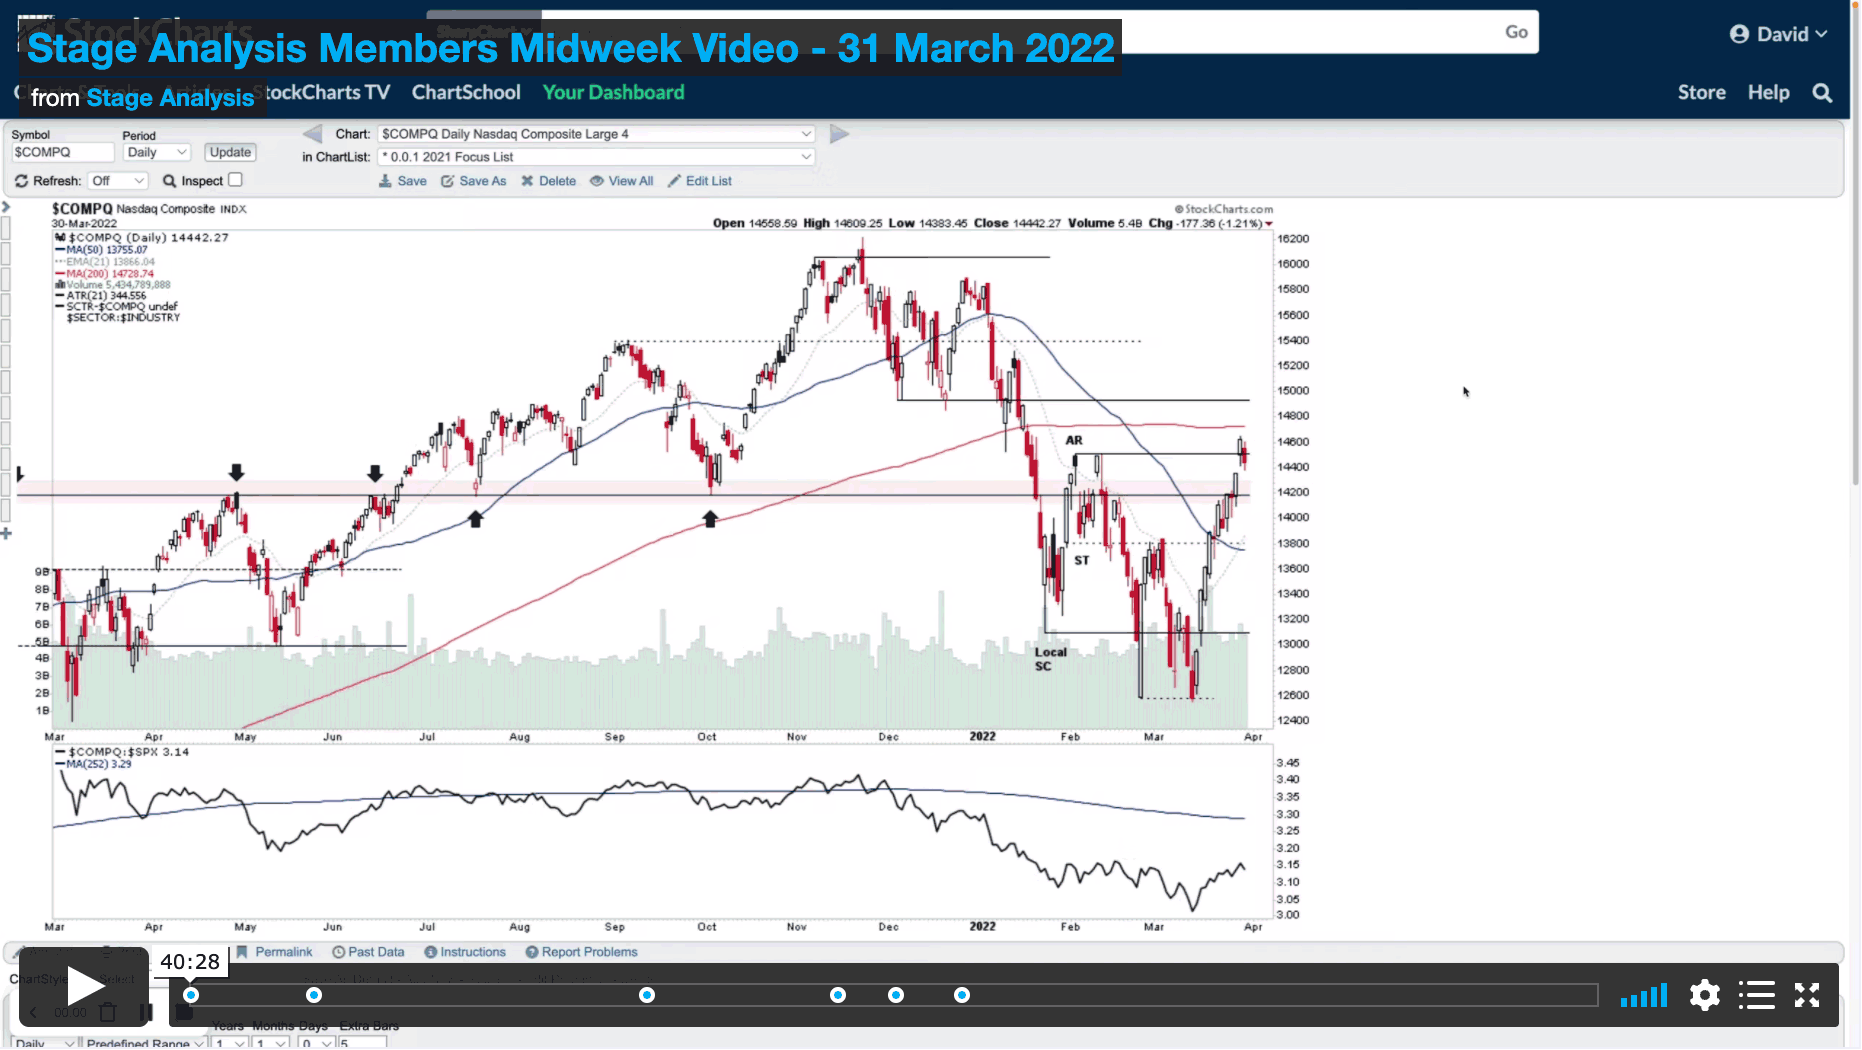
Stage Analysis Members Midweek Video - 31 March 2022 (40mins)
Todays video covers the Major Indexes, Short term market breadth, Bitcoin and Ethereum's Stage 2 attempt on the daily timeframe and the US Stocks Watchlist. I also spend the first 13 mins talking through how to use the watchlist based on the methods entry points and important cookie updates that break videos if they are not selected. So make sure that you accept them to be able to view the videos, as Vimeo videos only play once they are accepted.
Read More
30 March, 2022
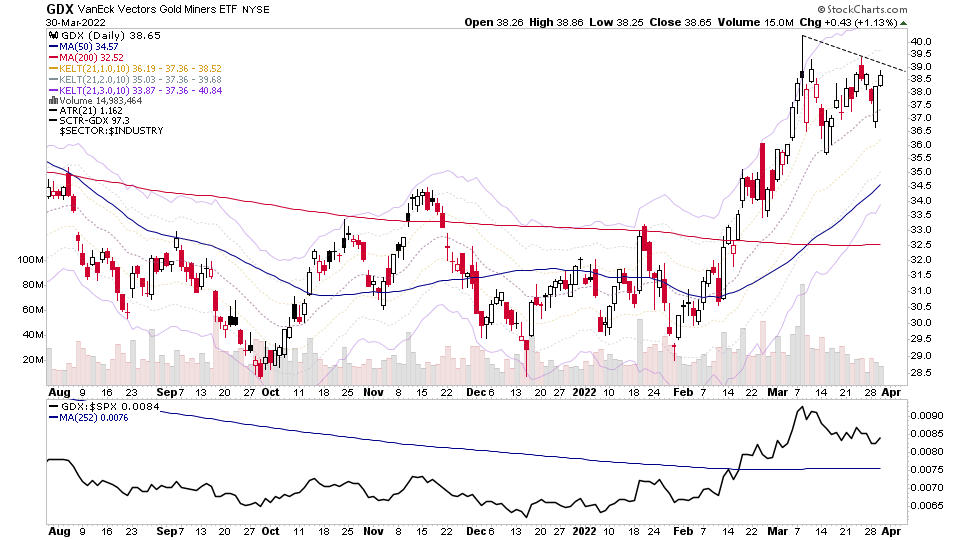
US Stocks Watchlist - 30 March 2022
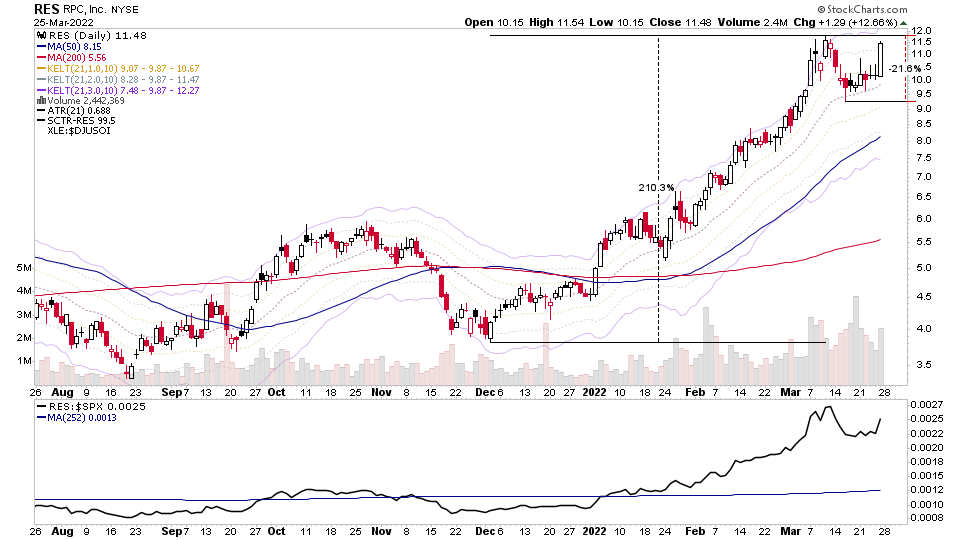
There were 30 stocks for the US stocks watchlist today. Here's a small sample from the list: GDX, TECK, LAC, GD, + 26 more...
Read More
29 March, 2022
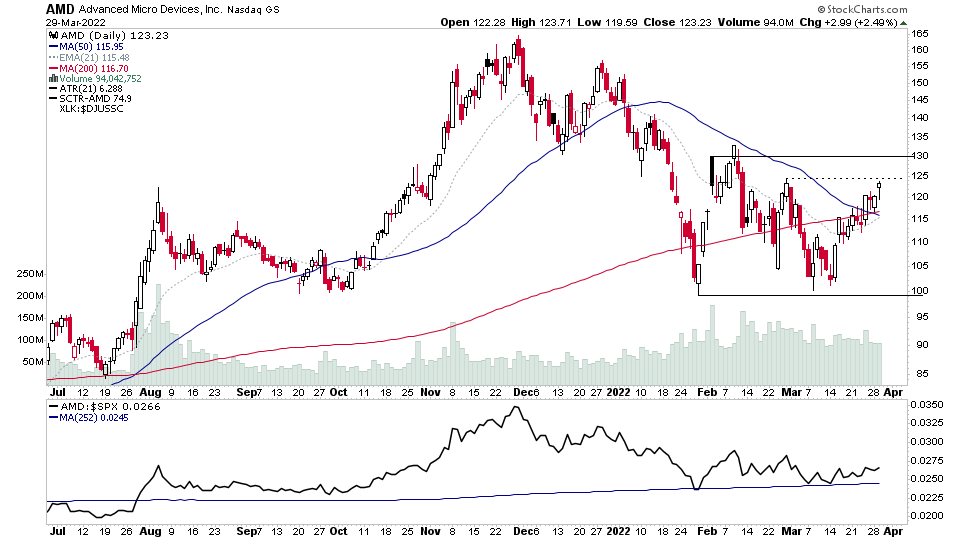
Breakout or Upthrust in the US Markets and the US Stocks Watchlist - 29 March 2022
There were 36 stocks for the US stocks watchlist today with a rotation back to the strong RS groups featuring heavily today. AMD, OBE, SBLK, ZETA, + 32 more...
Read More
28 March, 2022
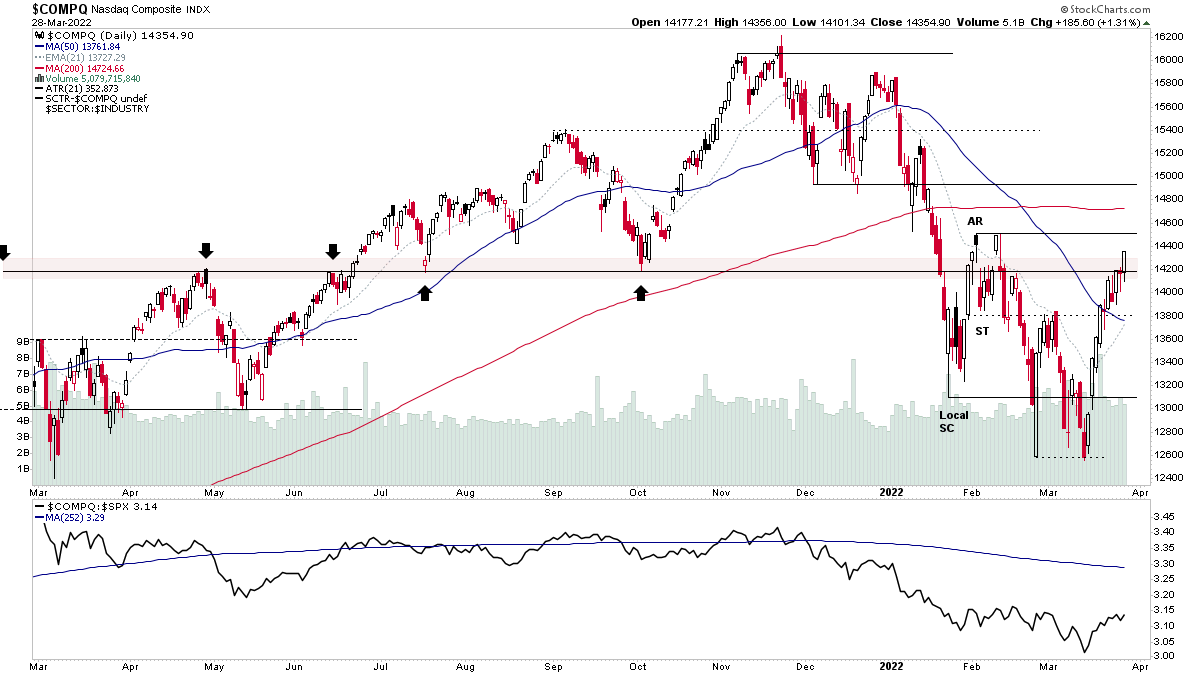
Nasdaq Composite Moves Above Significant Resistance level and the US Stocks Watchlist - 28 March 2022
The Nasdaq Composite moved through the significant resistance level, that has acted as support / resistance around six times in the last year. With a strong close that is now approaching the top of the recent range. So that level and the 200 day MA above it are the next levels of interest.
Read More
27 March, 2022
US Stocks Watchlist - 27 March 2022
For the watchlist from the weekend scans...
Read More
27 March, 2022
Stage Analysis Members Weekend Video – Part 2 – 27 March 2022 (1hr 3mins) – Gold and Silver Miners Feature
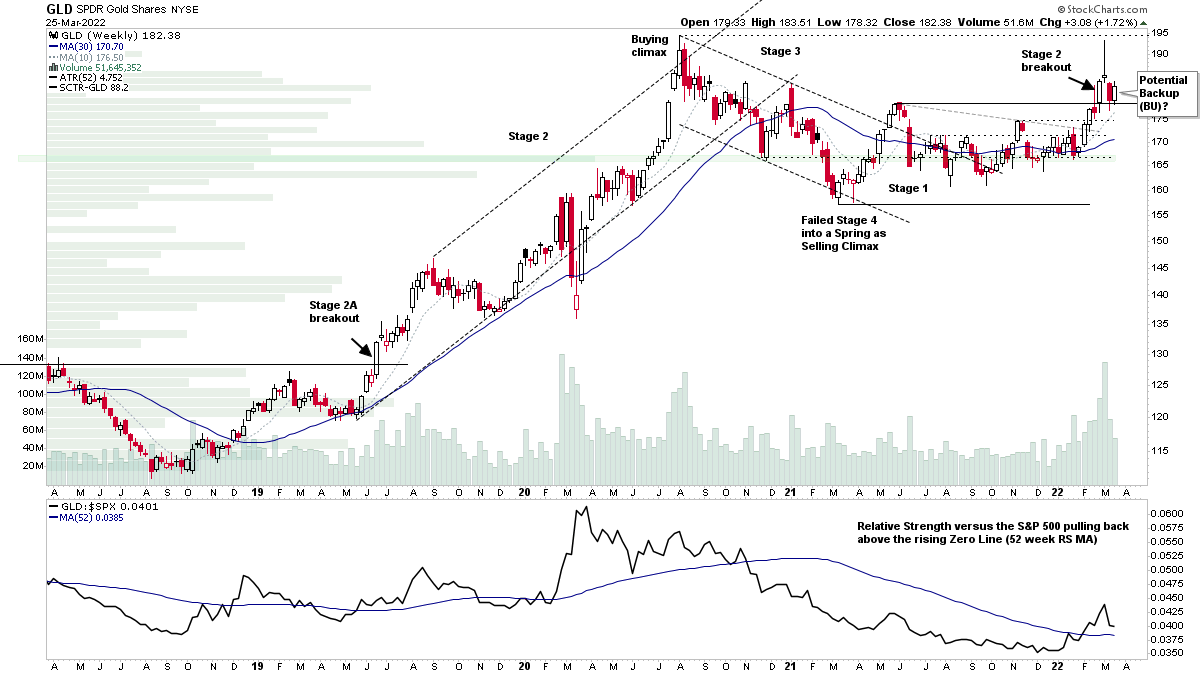
Part 2 of this weekends Stage Analysis Members Weekend video is free to view for the public and has a feature on the Gold and Silver miners that have been appearing in the watchlist over the last few months as they've developed from Stage 1 in Stage 2 in some cases. So I run through the strongest of the Gold and Silver miners and then in the second half of the video I cover this weeks Stage 2 Breakouts and Stage 2 Continuations and finish off with a look at the weekends US watchlist stocks in a but more detail.
Read More
26 March, 2022
Stage Analysis Members Weekend Video – Part 1 – 26 March 2022 (57 mins)
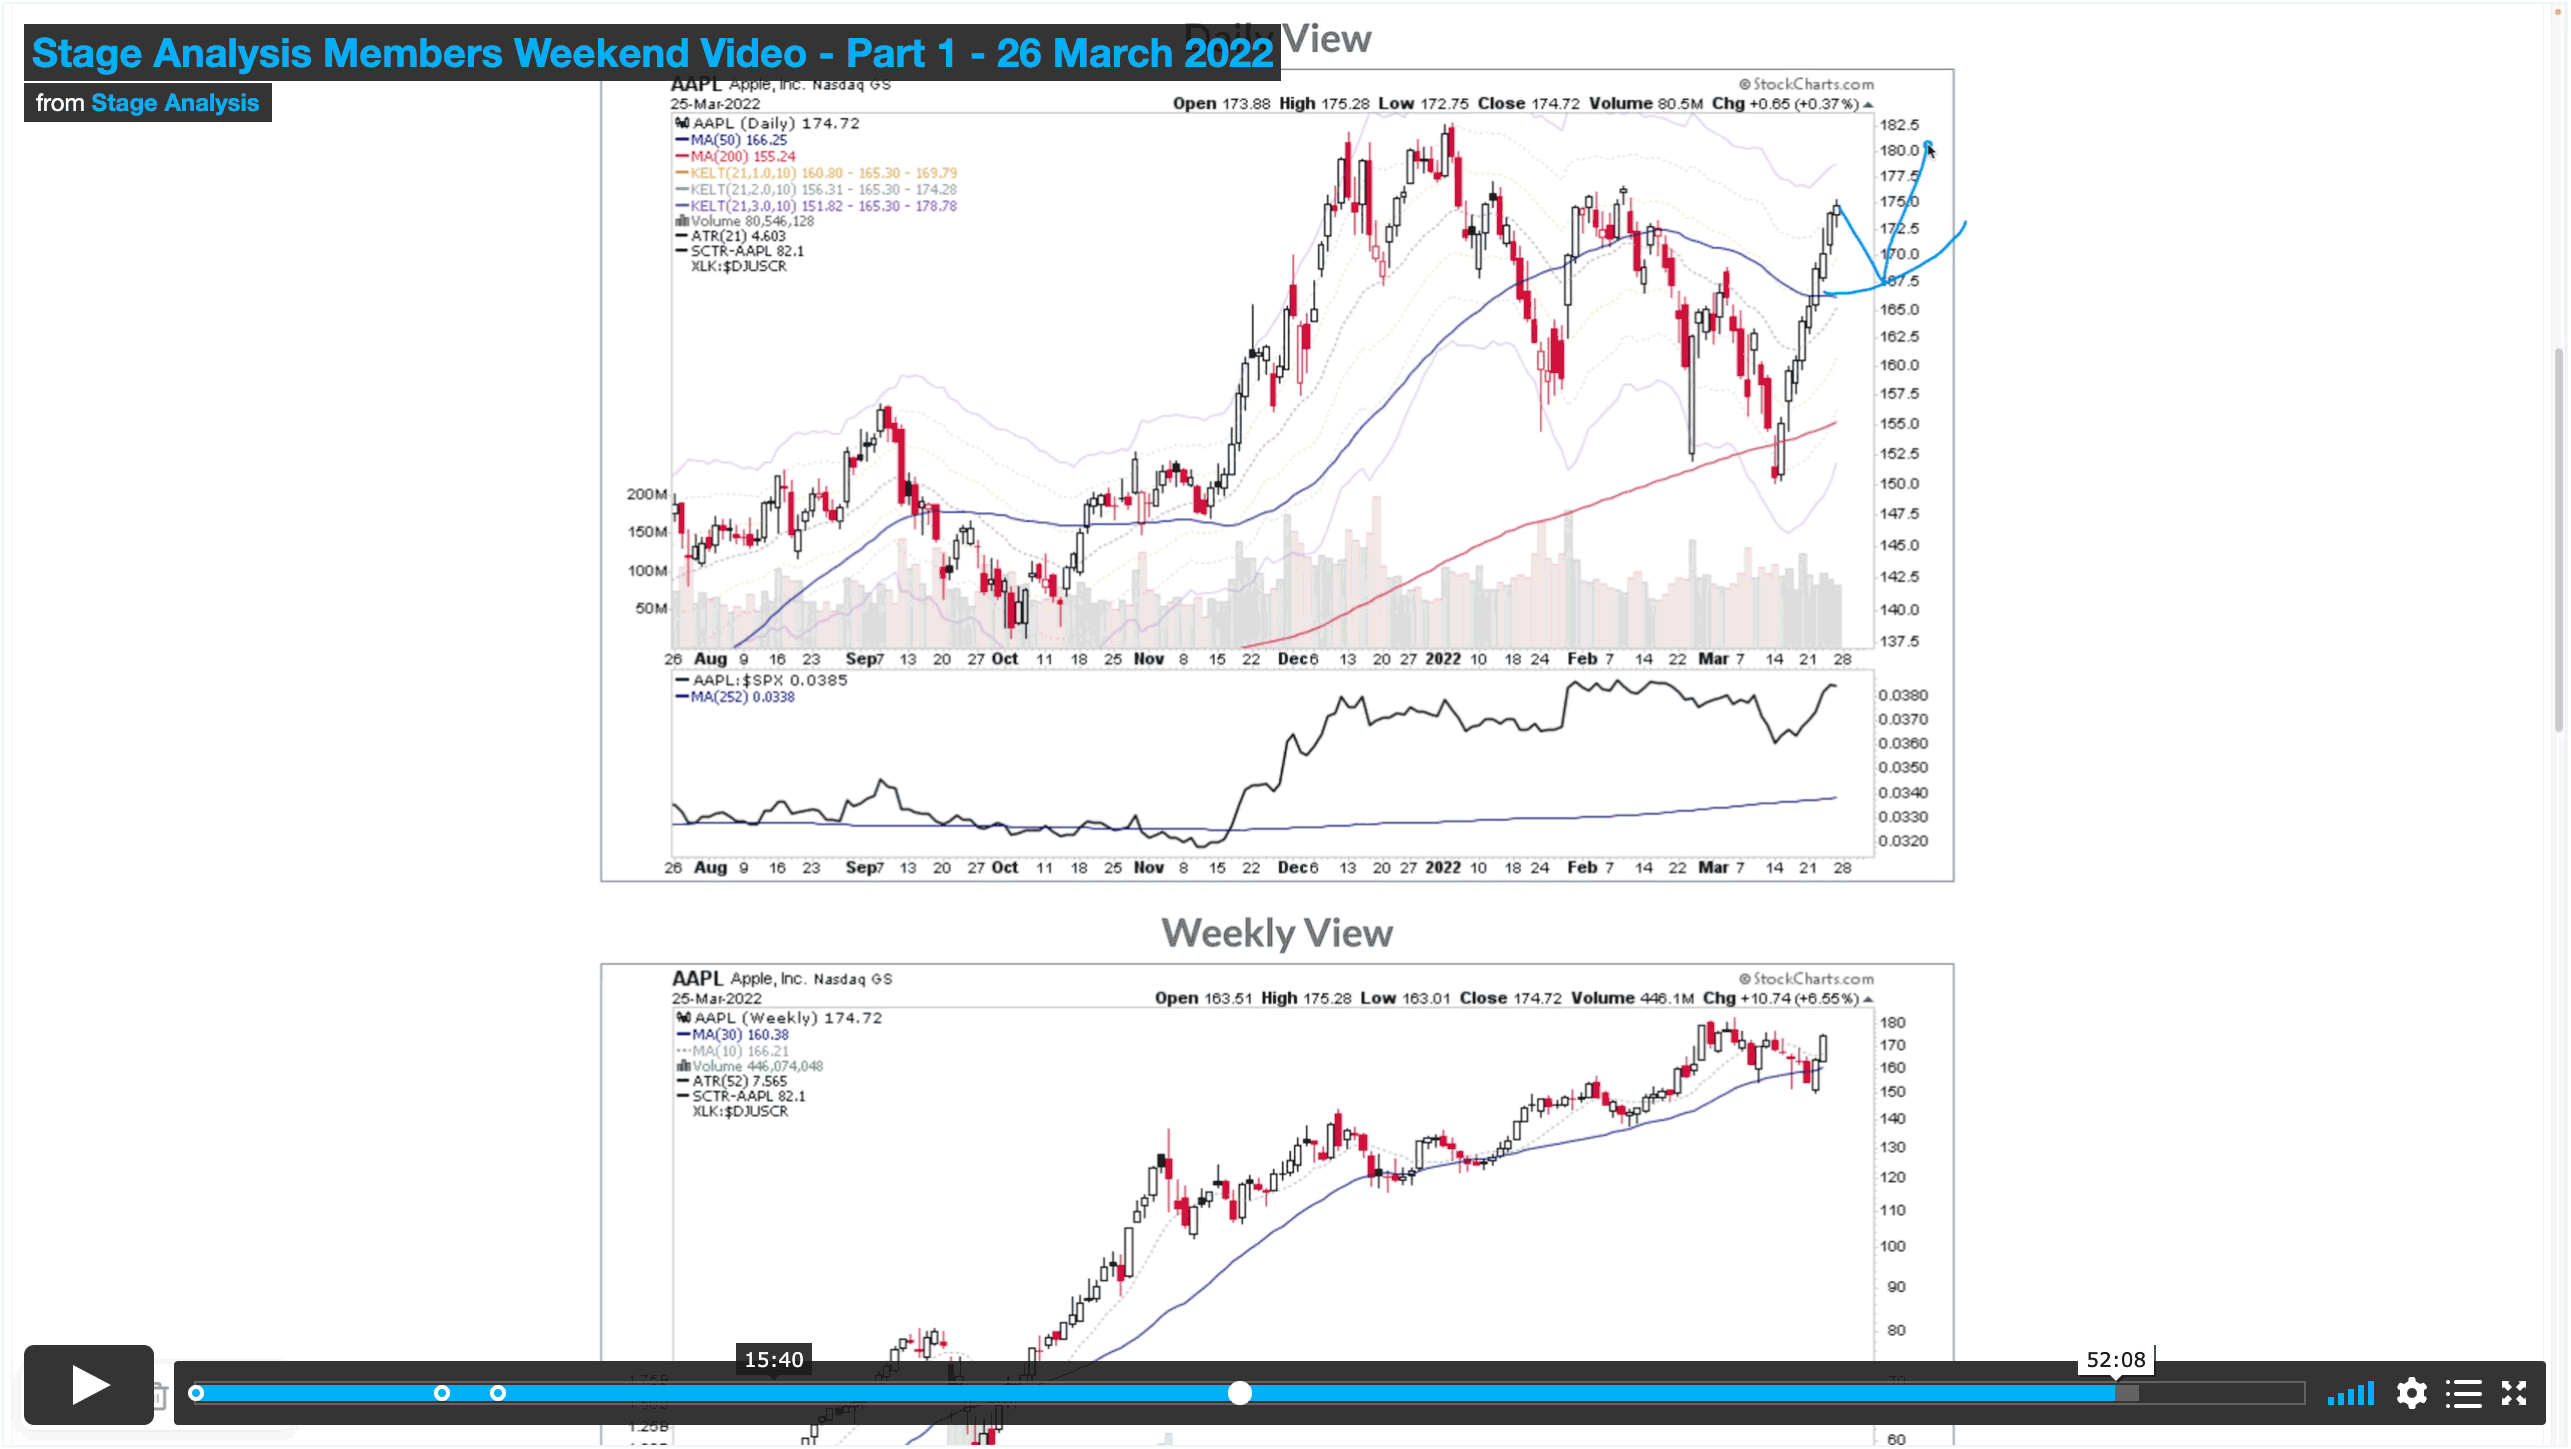
In Part 1 of the Stage Analysis Members Video I cover the Major Indexes (i.e. S&P 500, Nasdaq Composite, Russell 2000 and the VIX etc), US Sectors Relative Strength Rankings and charts, Market Breadth charts to determine the Weight of Evidence, and the US Stocks Industry Group Relative Strength Tables and the Groups in focus this week.
Read More

