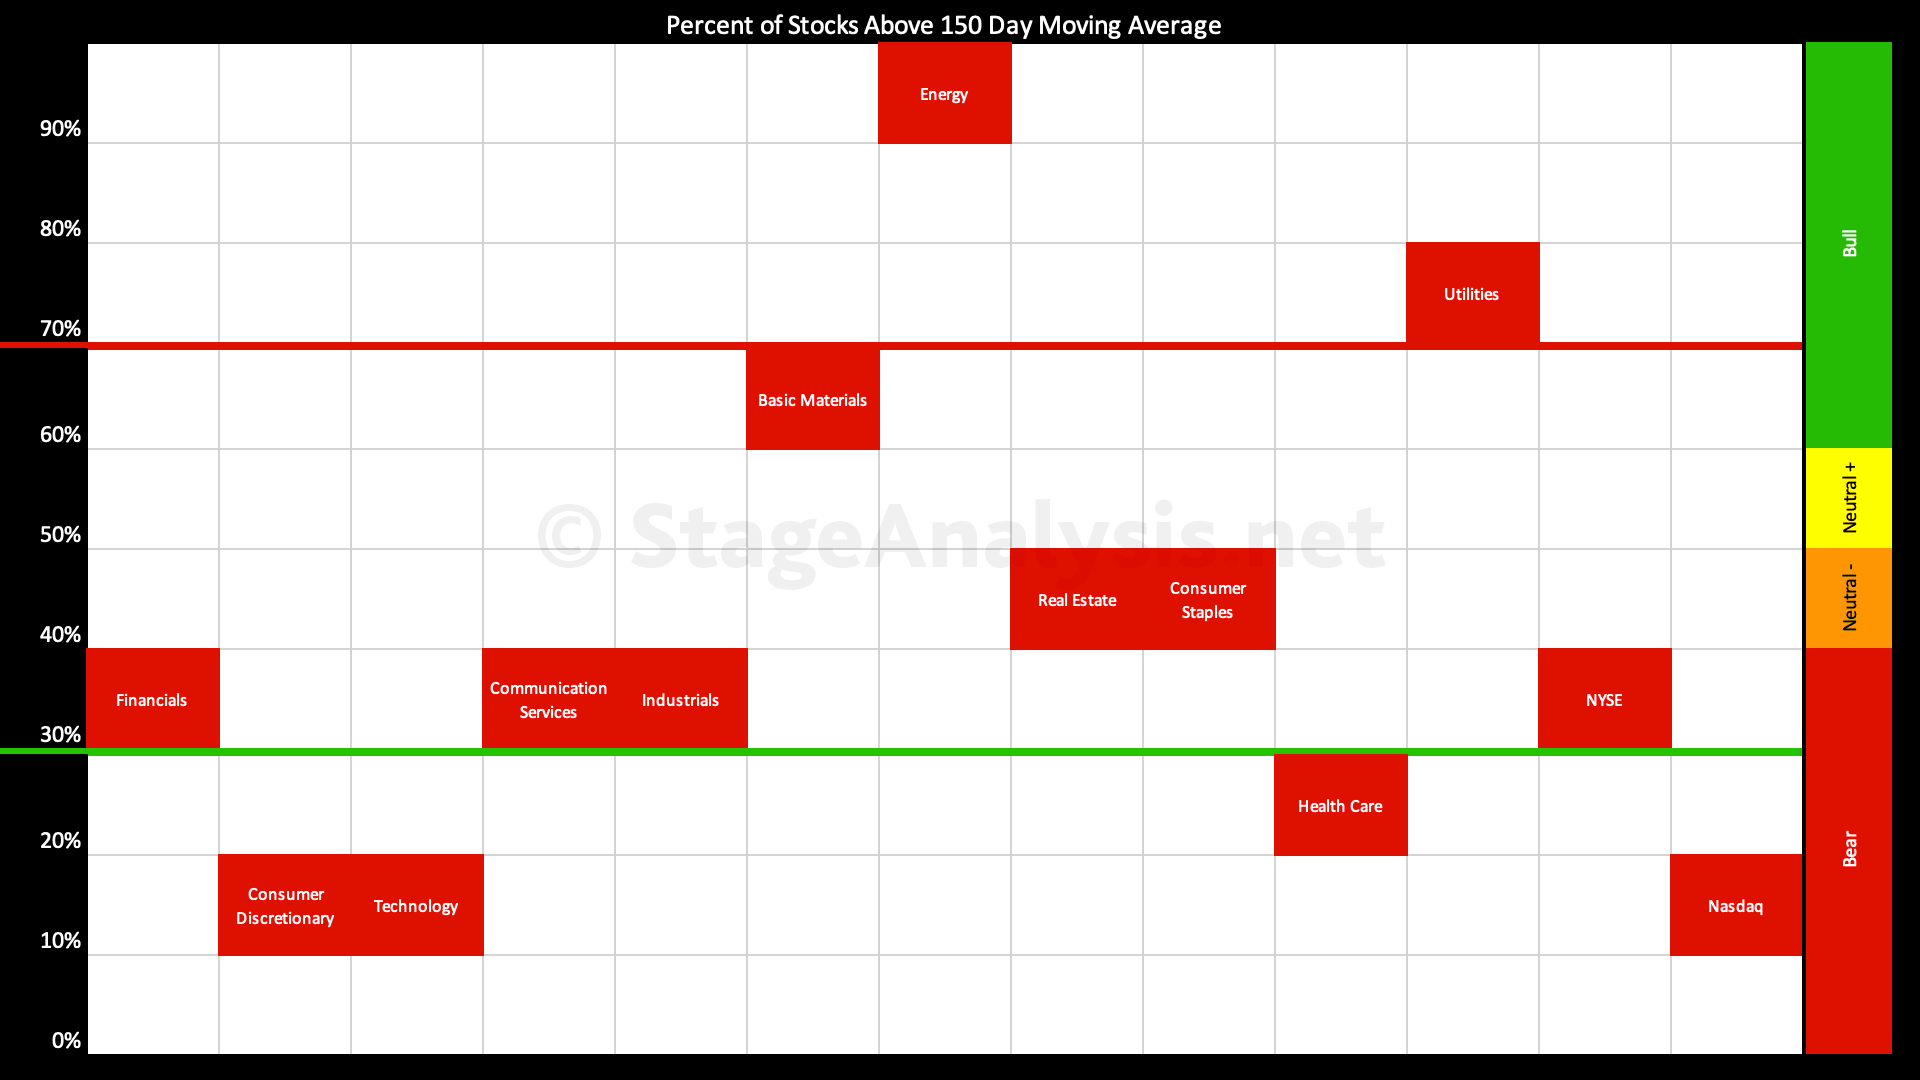
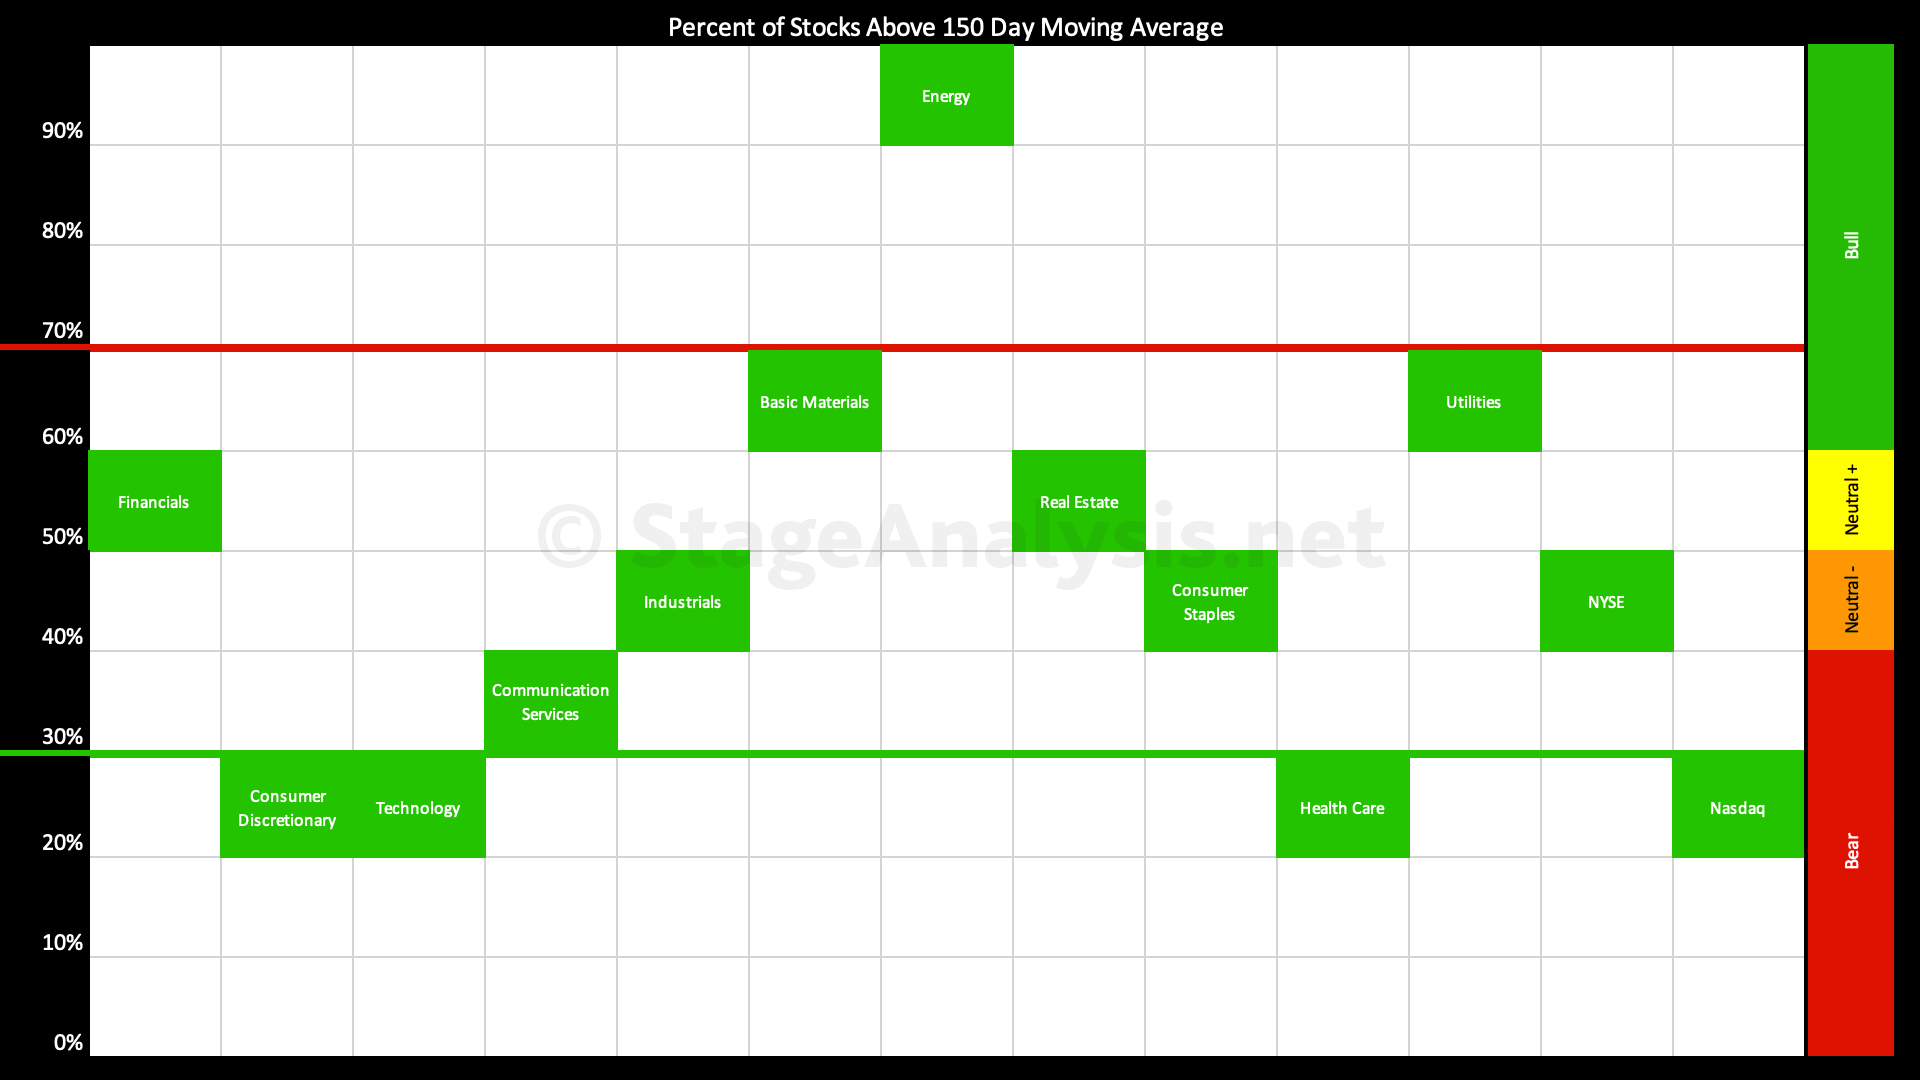
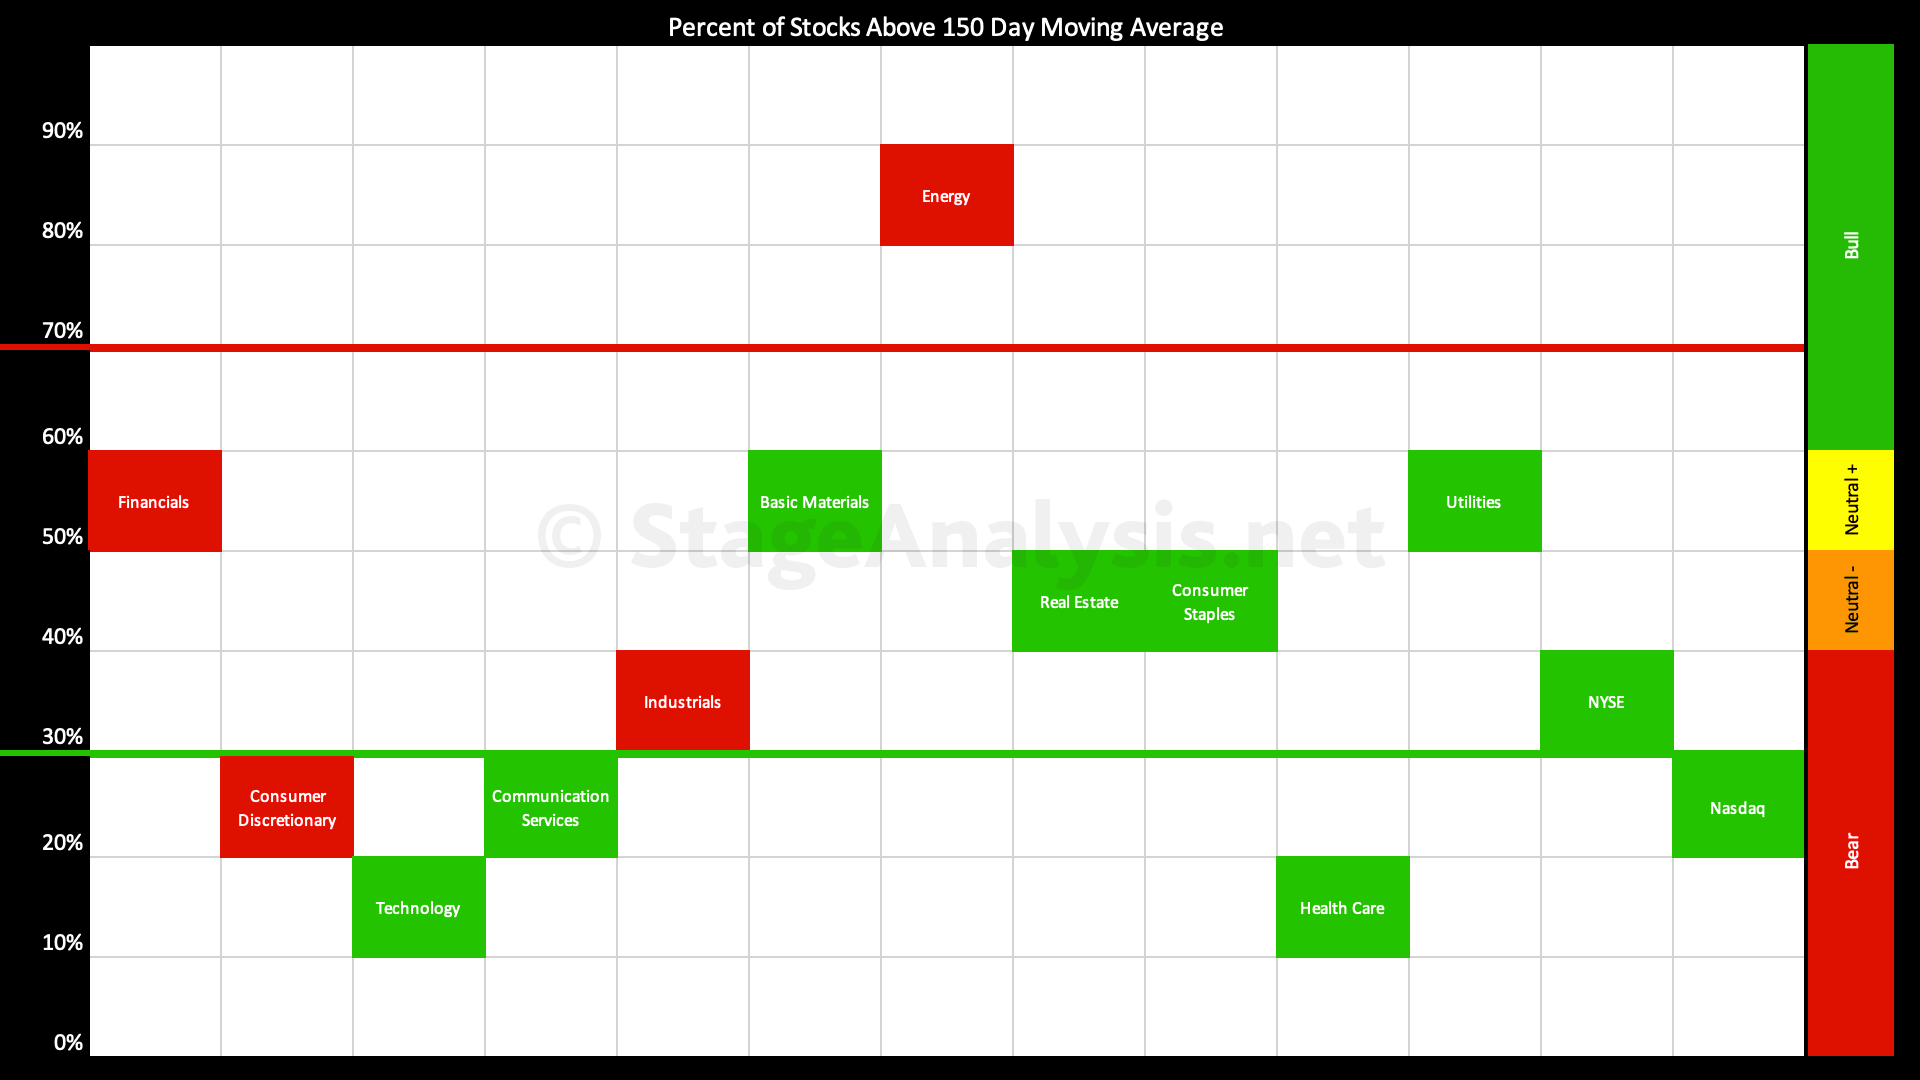
Declines across the entire US stock market this week with the overall average dropping back to 43.93%, which as you can see from the sector data is being propped up by the lingering strength in Energy, Utilities, and Basic Materials. While the rest of the market is lagging, especially the Consumer Discretionary and Technology sectors – which have less than 20% of stocks in each above their medium term 150 day (30 week) moving averages...
Read More

Blog
07 April, 2022
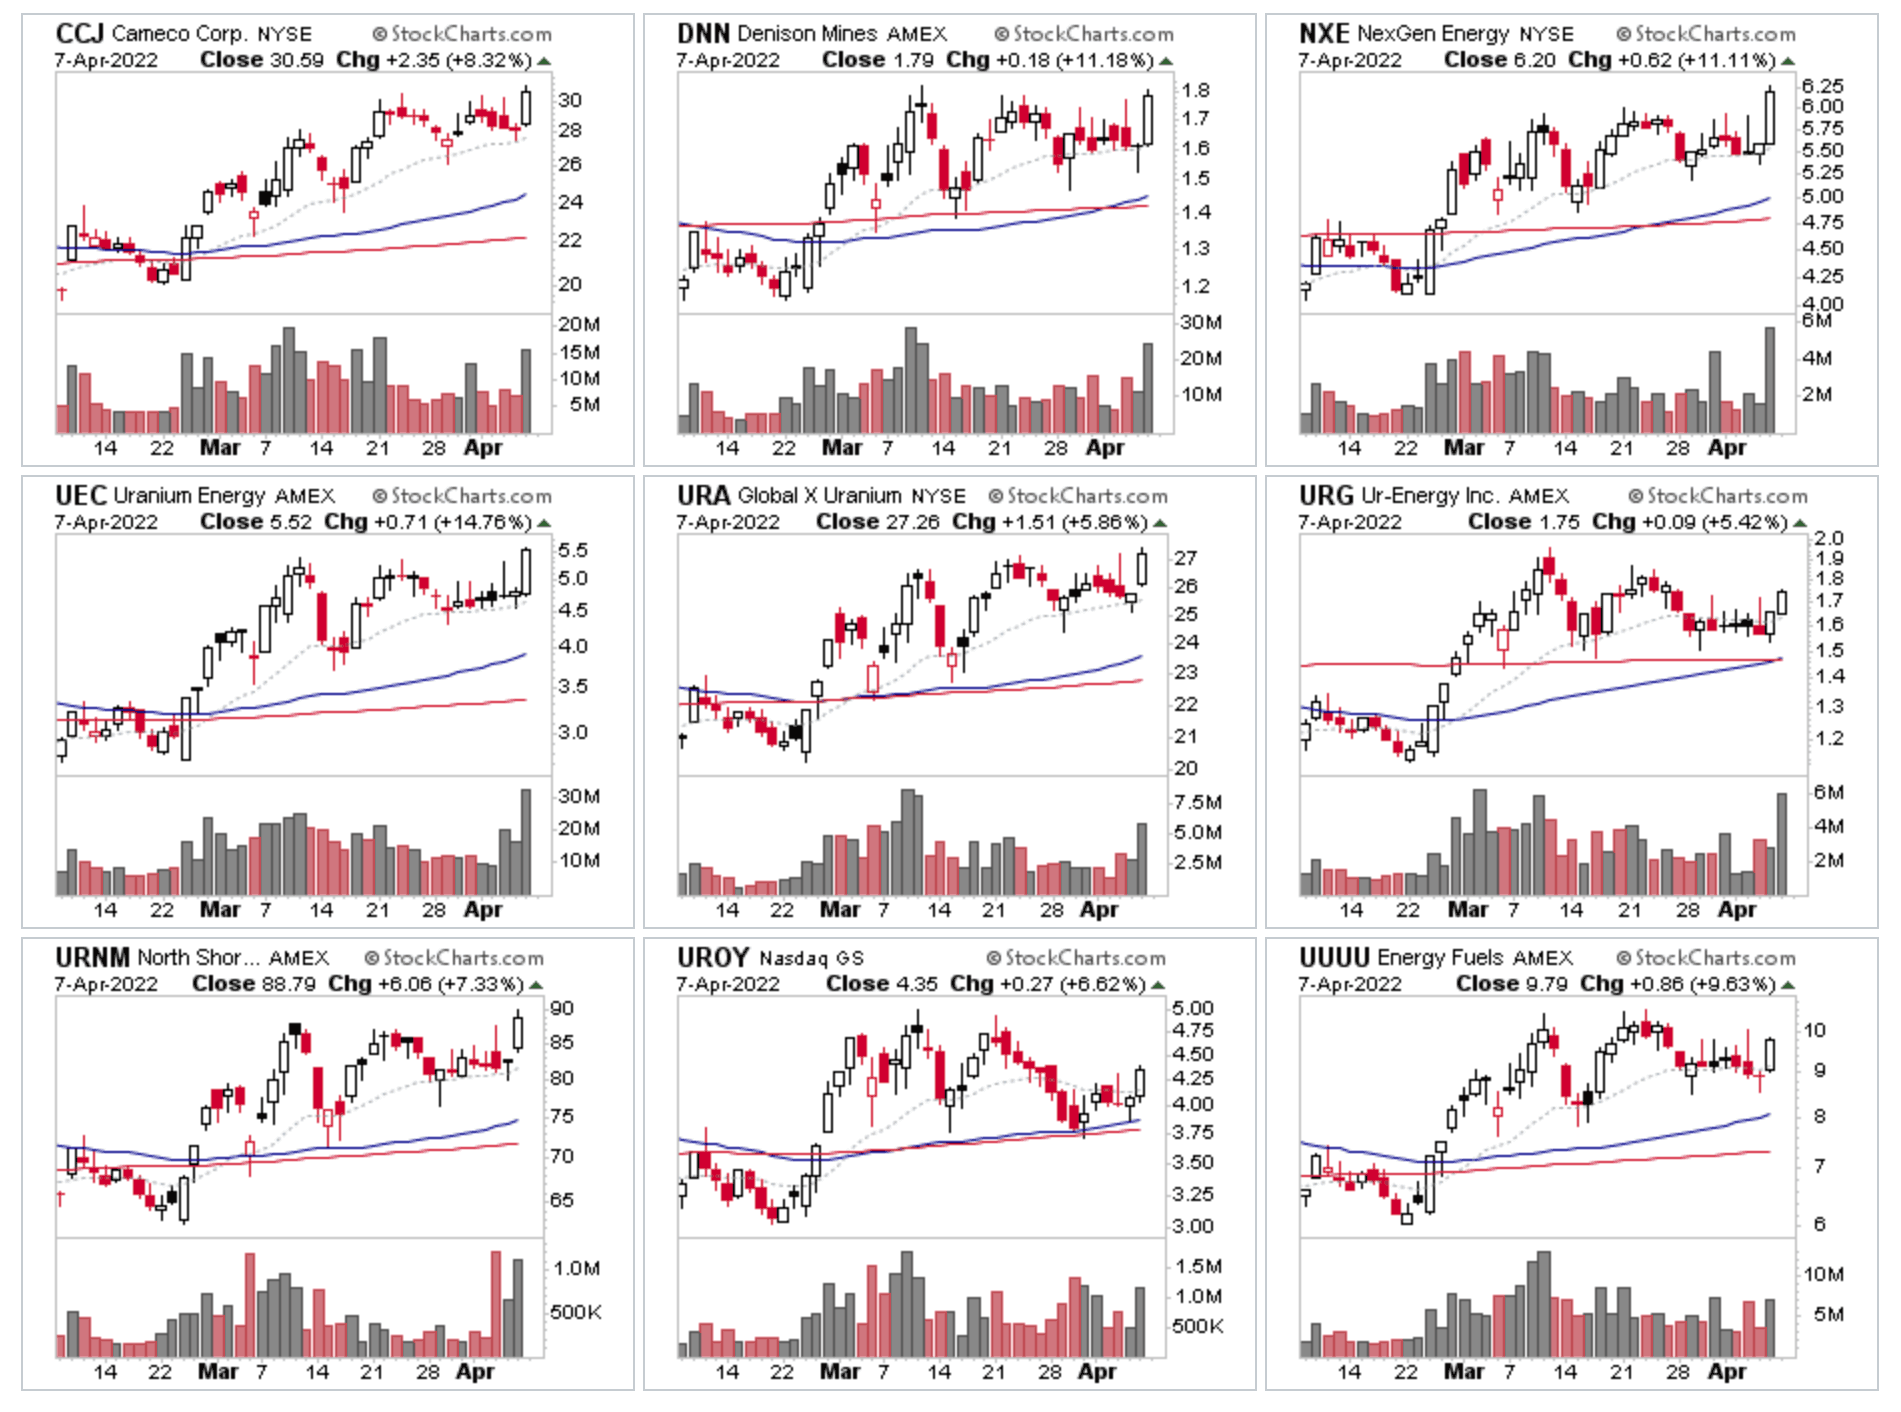
Uranium Stocks & ETFs Attempting to Breakout and the US Stocks Watchlist – 7 April 2022
Strong relative volume came into the Uranium stocks & ETFs today, with multiple stocks from the group testing the highs of their recent ranges, with closes near the highs of the day and the majority moving greater than 5% including the group ETFs. So there's potential for a new Stage 2 breakout "attempt". But as always – and especially in the current market environment – be on alert for signs of failure on any breakout attempt, as failed breakouts can quickly turn into an Upthrust...
Read More
07 April, 2022
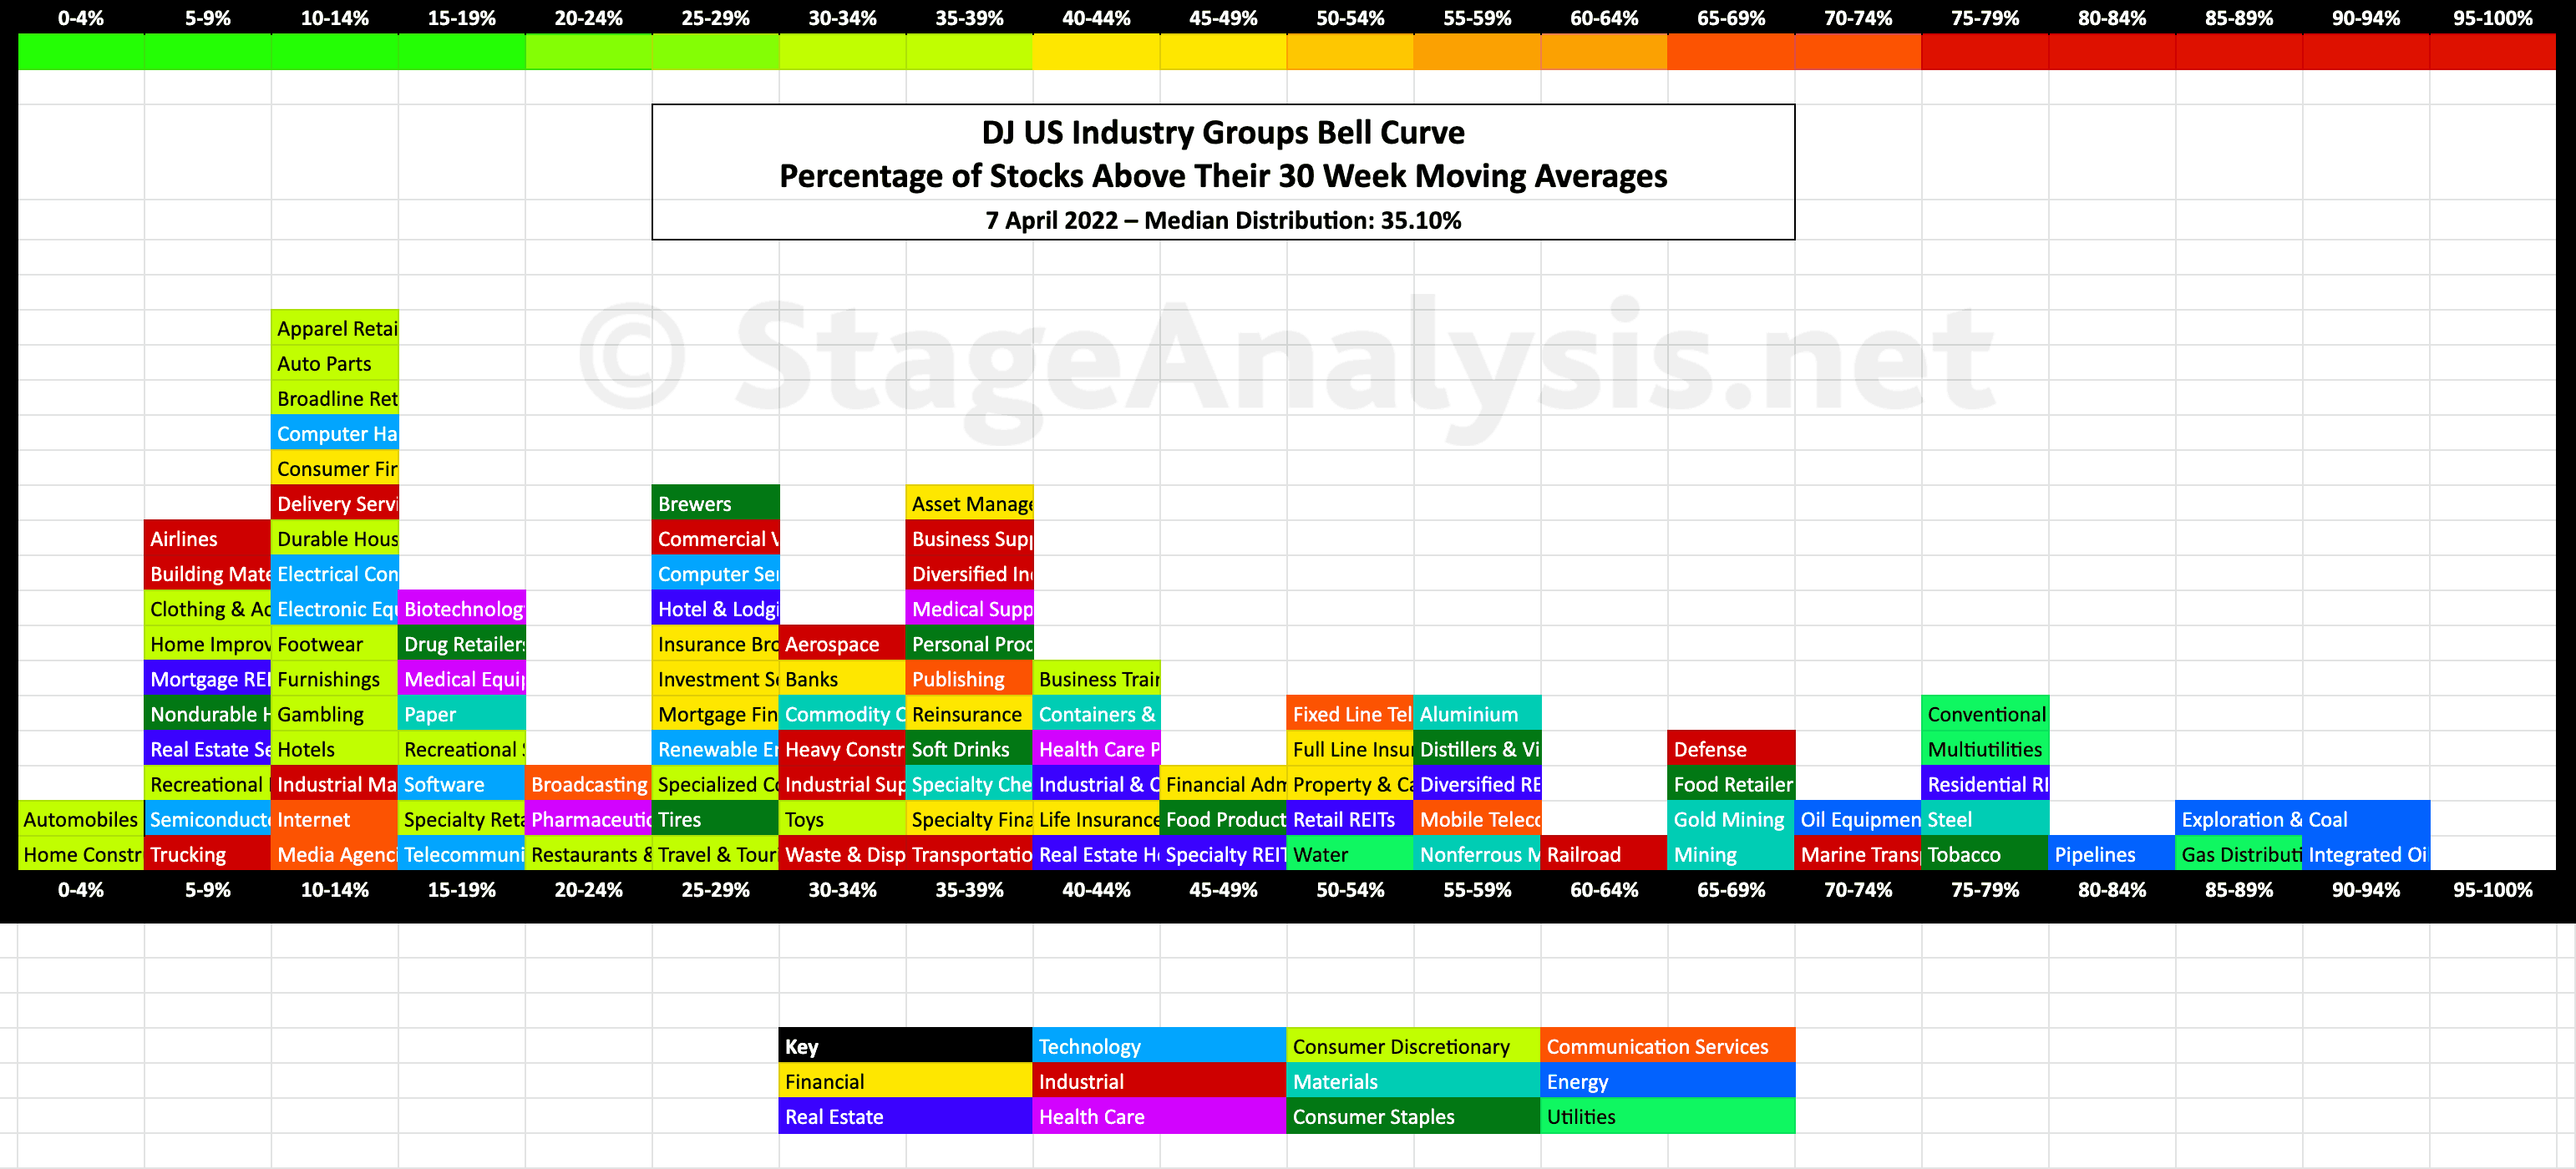
US Industry Groups Bell Curve – Exclusive to Stage Analysis
Updated exclusive graphic of the 104 Dow Jones Industry Groups showing the Percentage of Stocks Above 30 week MA in each group visualised as a Bell Curve chart – inspired by the Sector Bell Curve work by Tom Dorsey in his Point & Figure book....
Read More
03 April, 2022
Stage Analysis Members Weekend Video - 3 April 2022 (1hr 24mins)
In this weekends members video I discuss the Stan Weinstein Interview on Twitter Spaces, as well as the regular content of the Major Indexes, Sectors Relative Strength Tables & Charts, Industry Group RS Tables and Themes, Market Breadth: Weight of Evidence, 2x Weekly Volume Stocks and the US Watchlist Stocks in detail.
Read More
22 March, 2022
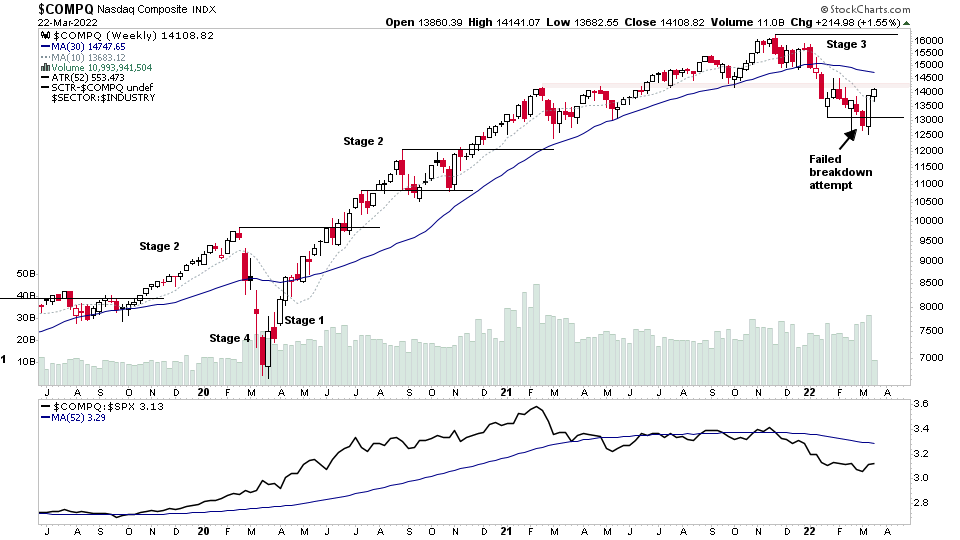
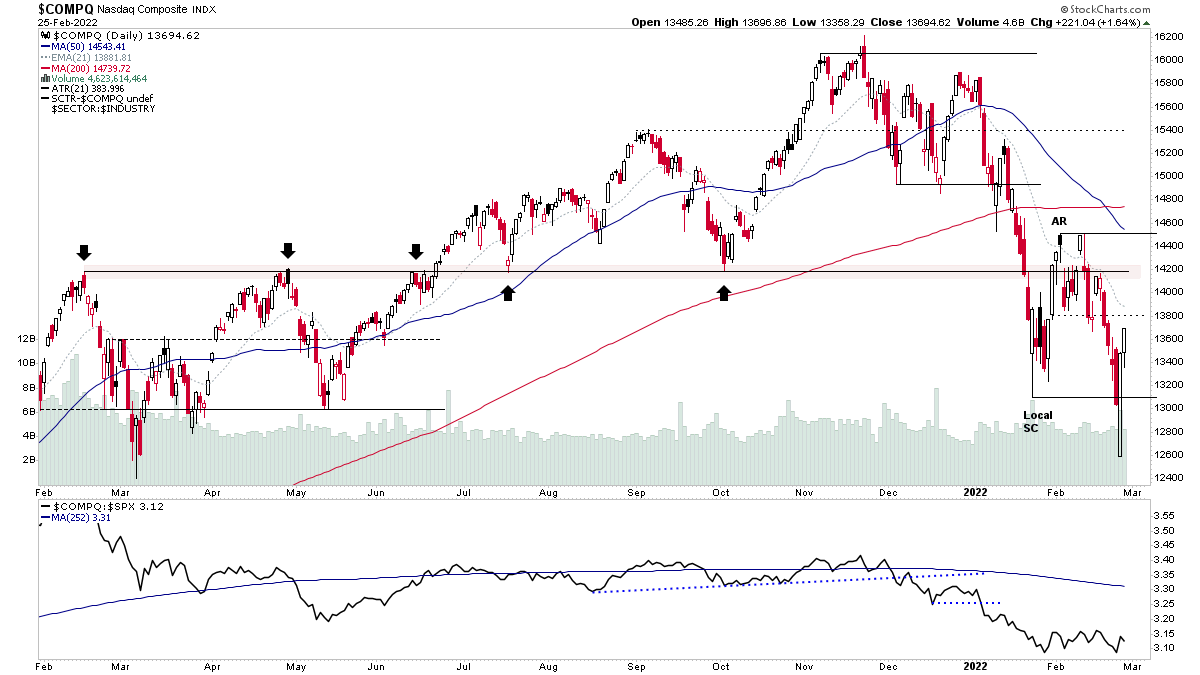
Nasdaq and S&P 500 Approaching Potential Resistance Zone and Further Market Breadth Improvements
The Nasdaq Composite is approaching a significant level of interest that has acted as both support and resistance five times or so in the past year. Hence, it is a key level to overcome in order for the short term Change of Behaviour that we've seen to turn into a more significant Change of Character – which would be more bullish. As although the initial Stage 4 breakdown attempt failed and the rebound has been strong, relative strength in the Nasdaq remains weak versus the S&P 500 and it's moving into a logical area for shorts to initiate a test of the recent price action...
Read More
22 March, 2022
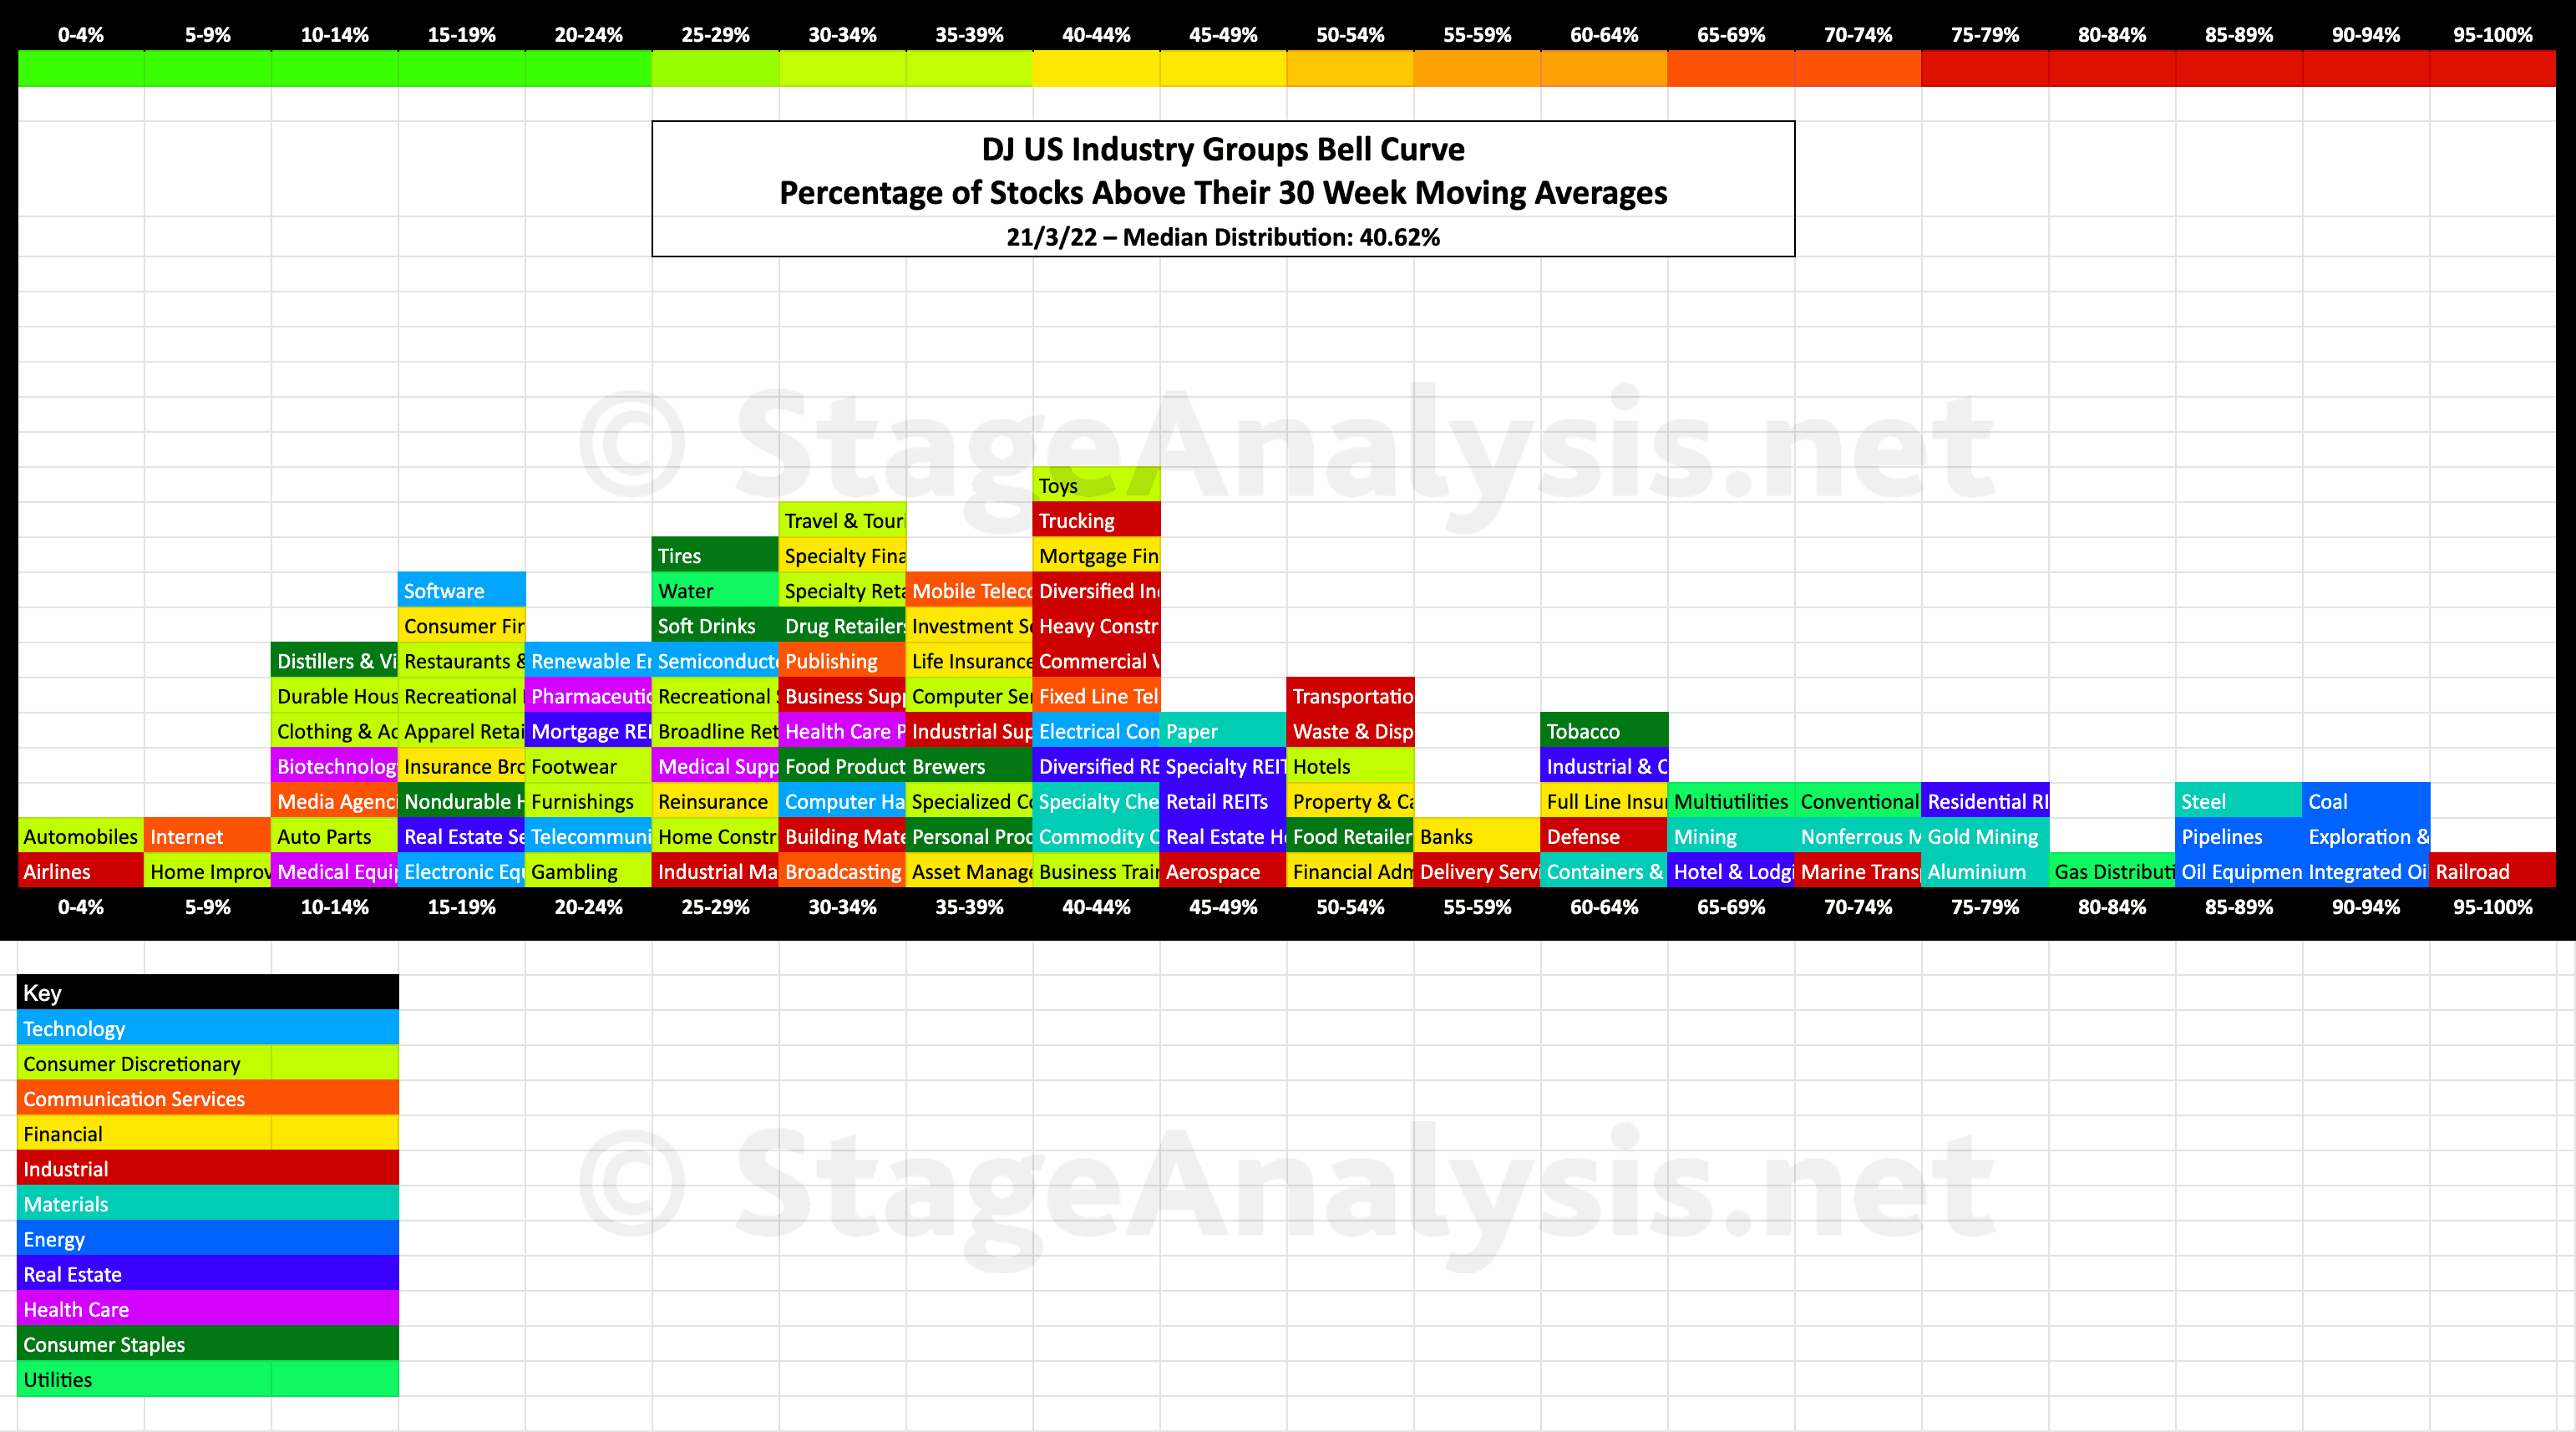
Industry Groups Bell Curve – Exclusive to Stage Analysis
Exclusive graphic of the 104 Dow Jones Industry Groups showing the Percentage of Stocks Above 30 week MA in each group visualised as a Bell Curve chart – inspired by the Sector Bell Curve work by Tom Dorsey in his Point & Figure book....
Read More
20 March, 2022
Market Breadth Update
US Sectors - Percentage of Stocks Above their 150 Day (30 Week) Moving Average, Cumulative Point & Figure Breakouts - Breakdowns, Stocks Above +1x ATR Level and Below the -1x ATR Level Comparison and Effective Volume Update
Read More
20 March, 2022
Stage Analysis Members Weekend Video – 20 March 2022 (1hr 17 mins)
Stage Analysis Members Video covering the Major Indexes (i.e. S&P 500, Nasdaq Composite, Russell 2000 and the VIX etc), Market Breadth charts to determine the Weight of Evidence, Industry Group Relative Strength Tables and the Groups in focus this week. Plus the US Stocks Watchlist.
Read More
27 February, 2022
Stage Analysis Members Weekend Video - 27 February 2022 (1hr 16mins)
Weekend update covering the major indexes, market breadth, industry group relative strength tables and the weekend US stocks watchlist...
Read More
27 February, 2022
Market Breadth Update - 27 February 2022
Overview the key market breadth charts that we follow in order to determine the Weight of Evidence, which guides our strategy and risk management.
Read More