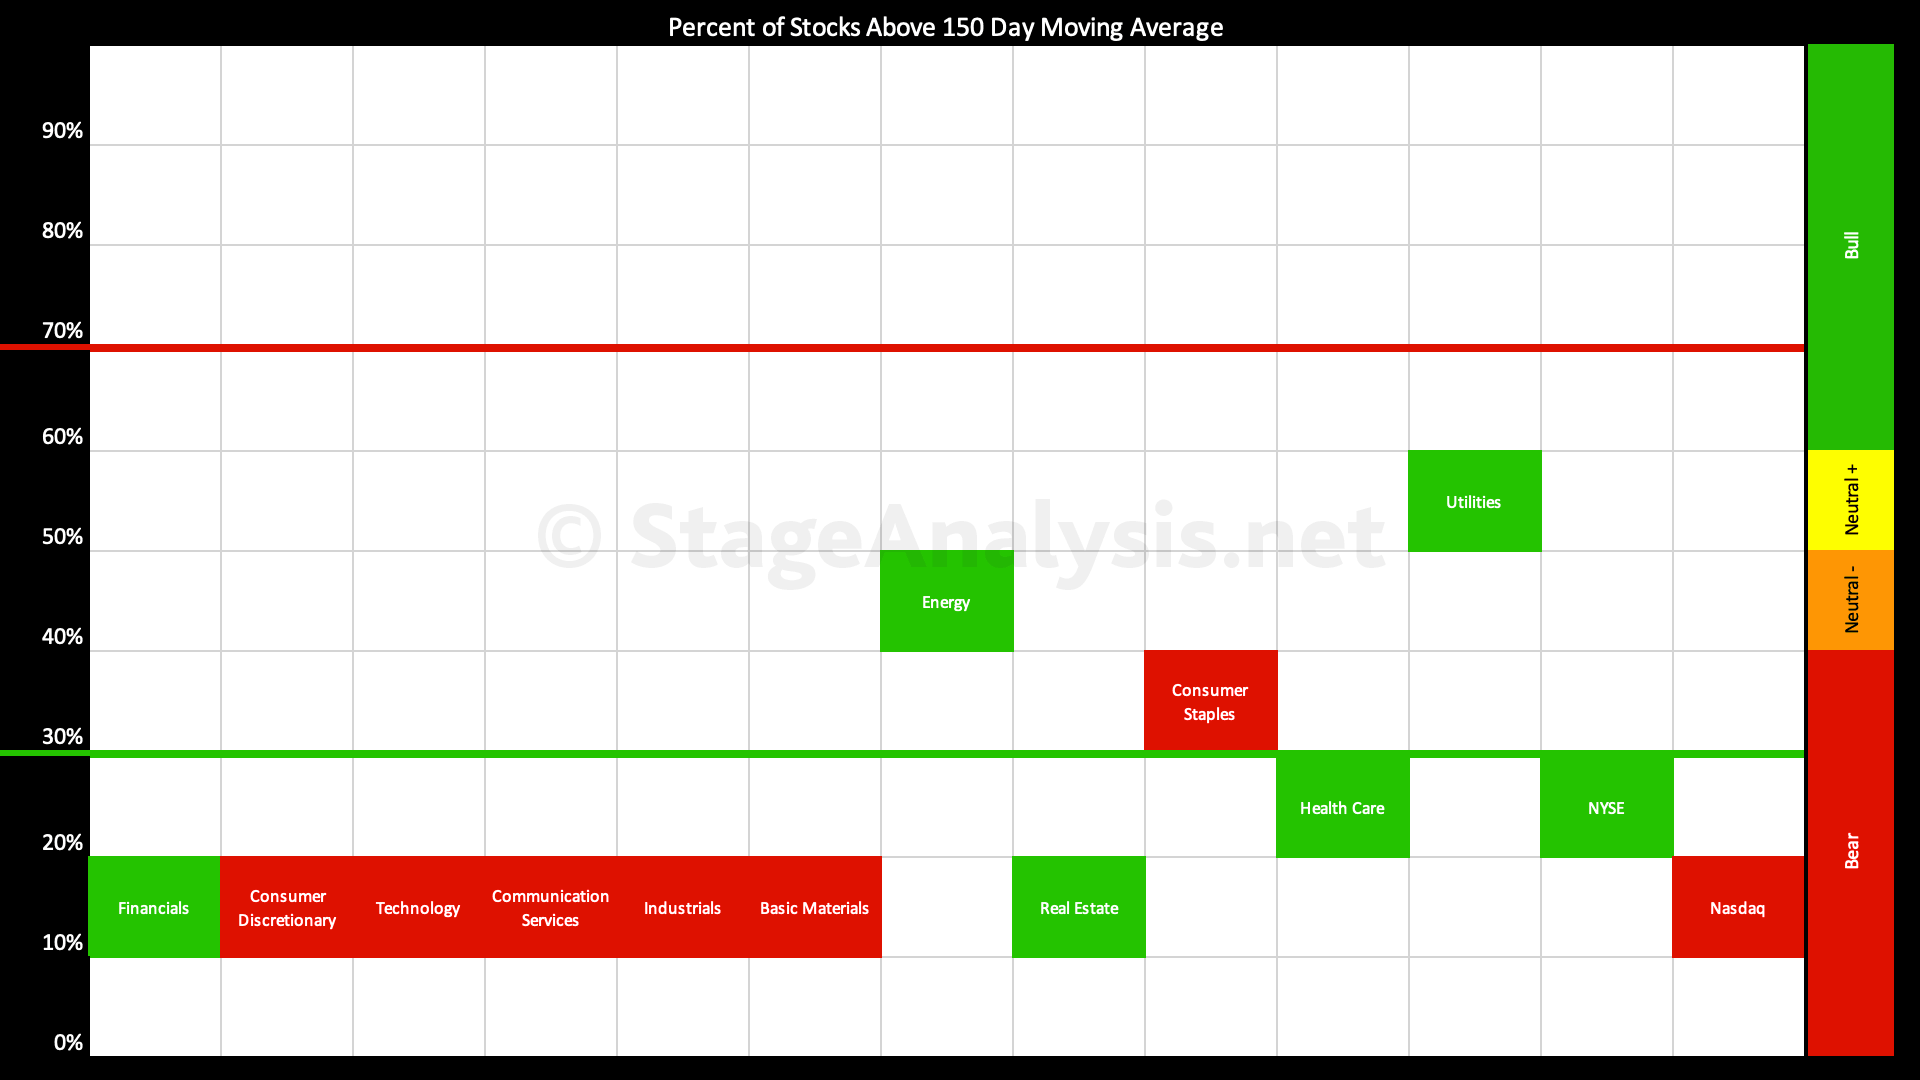
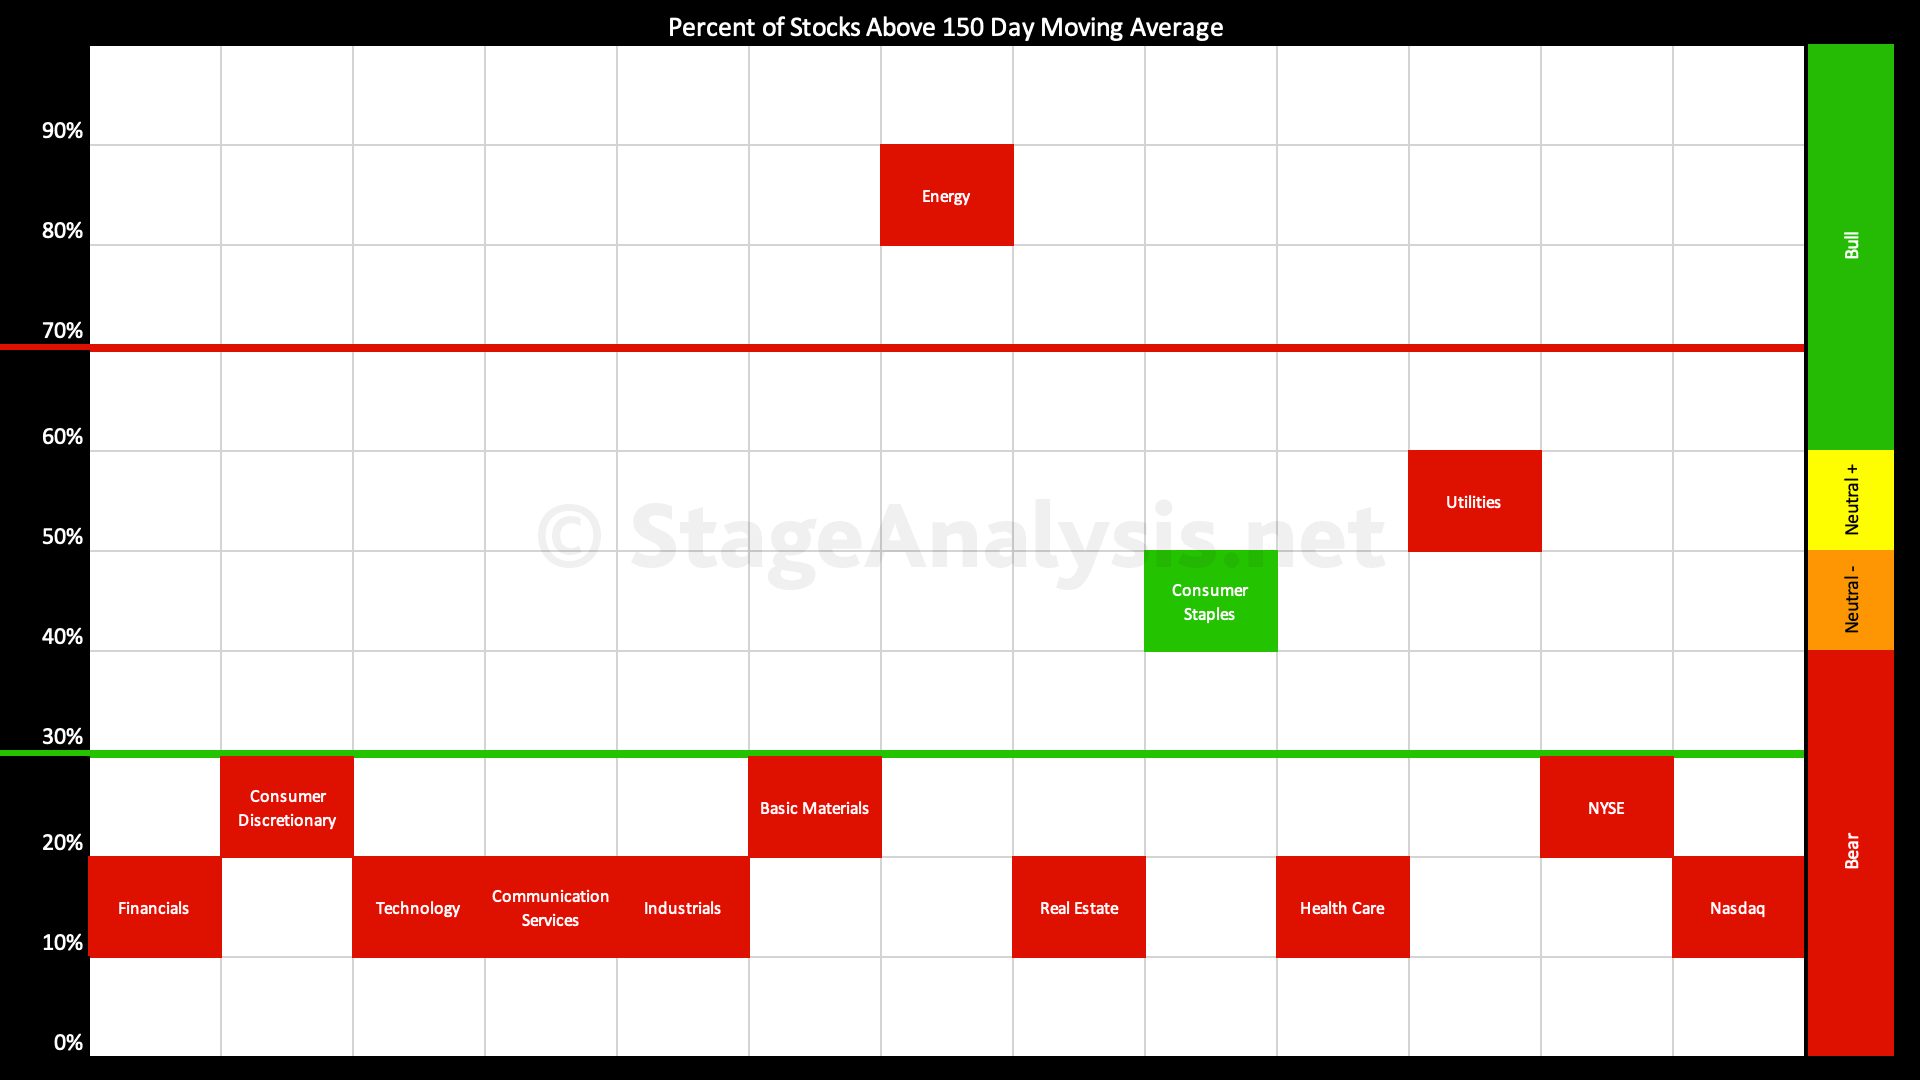
The Sector breadth table has deteriorated further through June as it currently sits at 22.95%, but it did get down to a new 2022 low of 15.78% on the 17th June. So it has improved by +7.17% over the last two weeks...
Read More
Blog
05 June, 2022
Stage Analysis Members Weekend Video – 5 June 2022 (1hr 36mins)
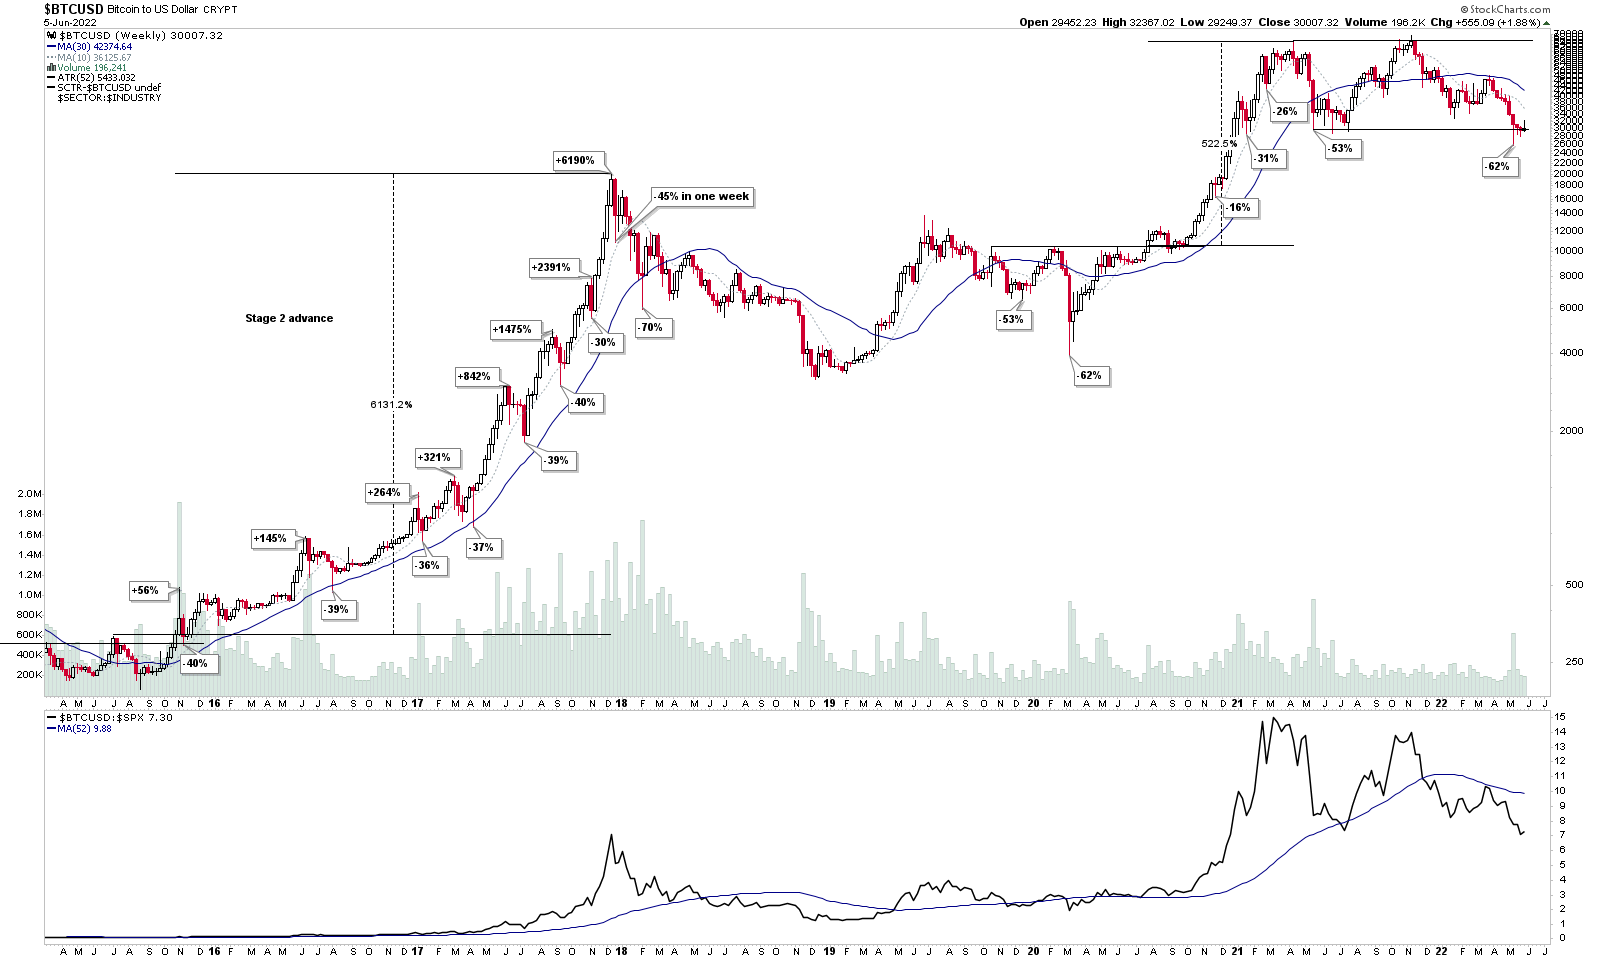
This weekends Stage Analysis Members Video features Stage Analysis of the major crypto coins – Bitcoin and Ethereum on multiple timeframes. And then in the members only portion of the video the usual Forest to the Trees approach...
Read More
05 June, 2022
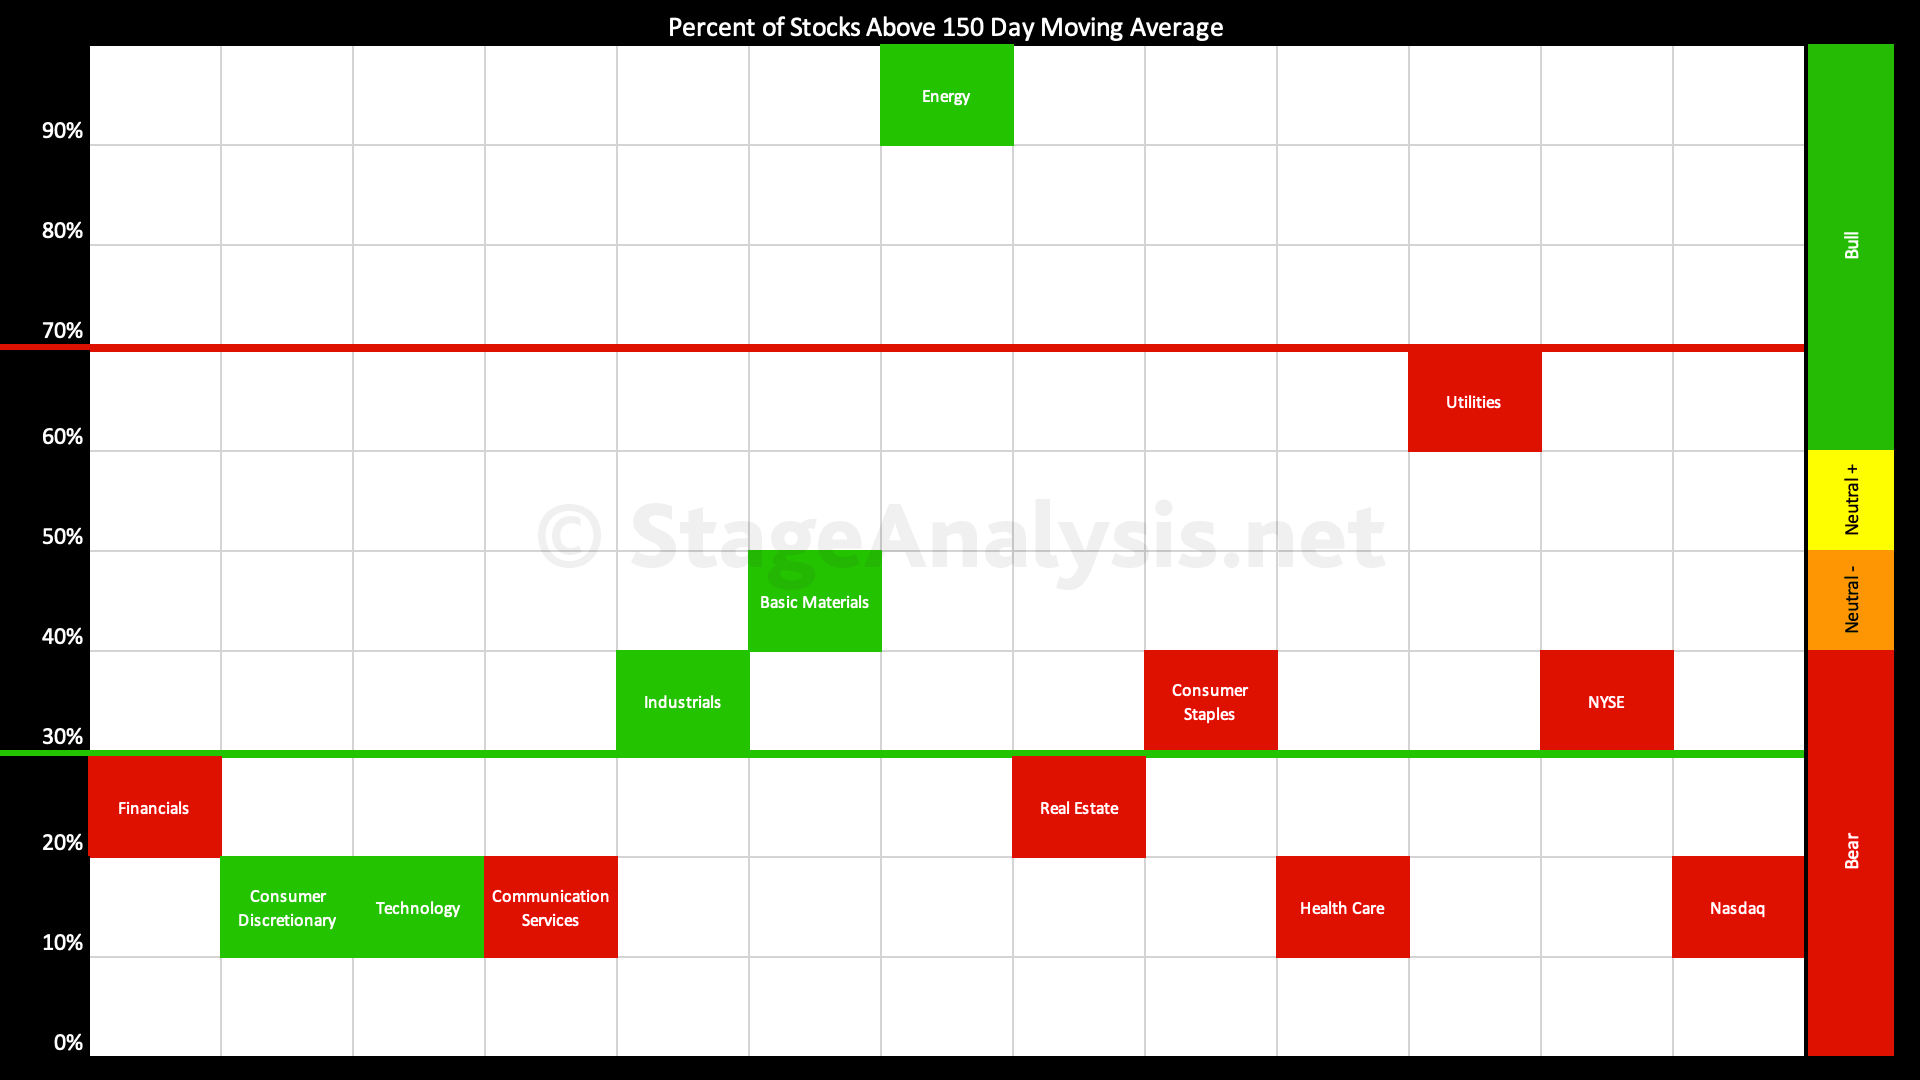
Sector Breadth: Percentage of US Stocks Above Their 150 day (30 Week) Moving Averages
Energy remains the leading group in the Stage 2 zone, and has pushed back above the 90% level once more. I talked in the previous post about looking for new leadership in sectors that reverse strongly back out of the lower zone, of which Basic Materials and Industrials have been the first movers in the last few weeks.
Read More
19 May, 2022
Stage Analysis Members Midweek Video – 18 May 2022 (1hr 17mins)
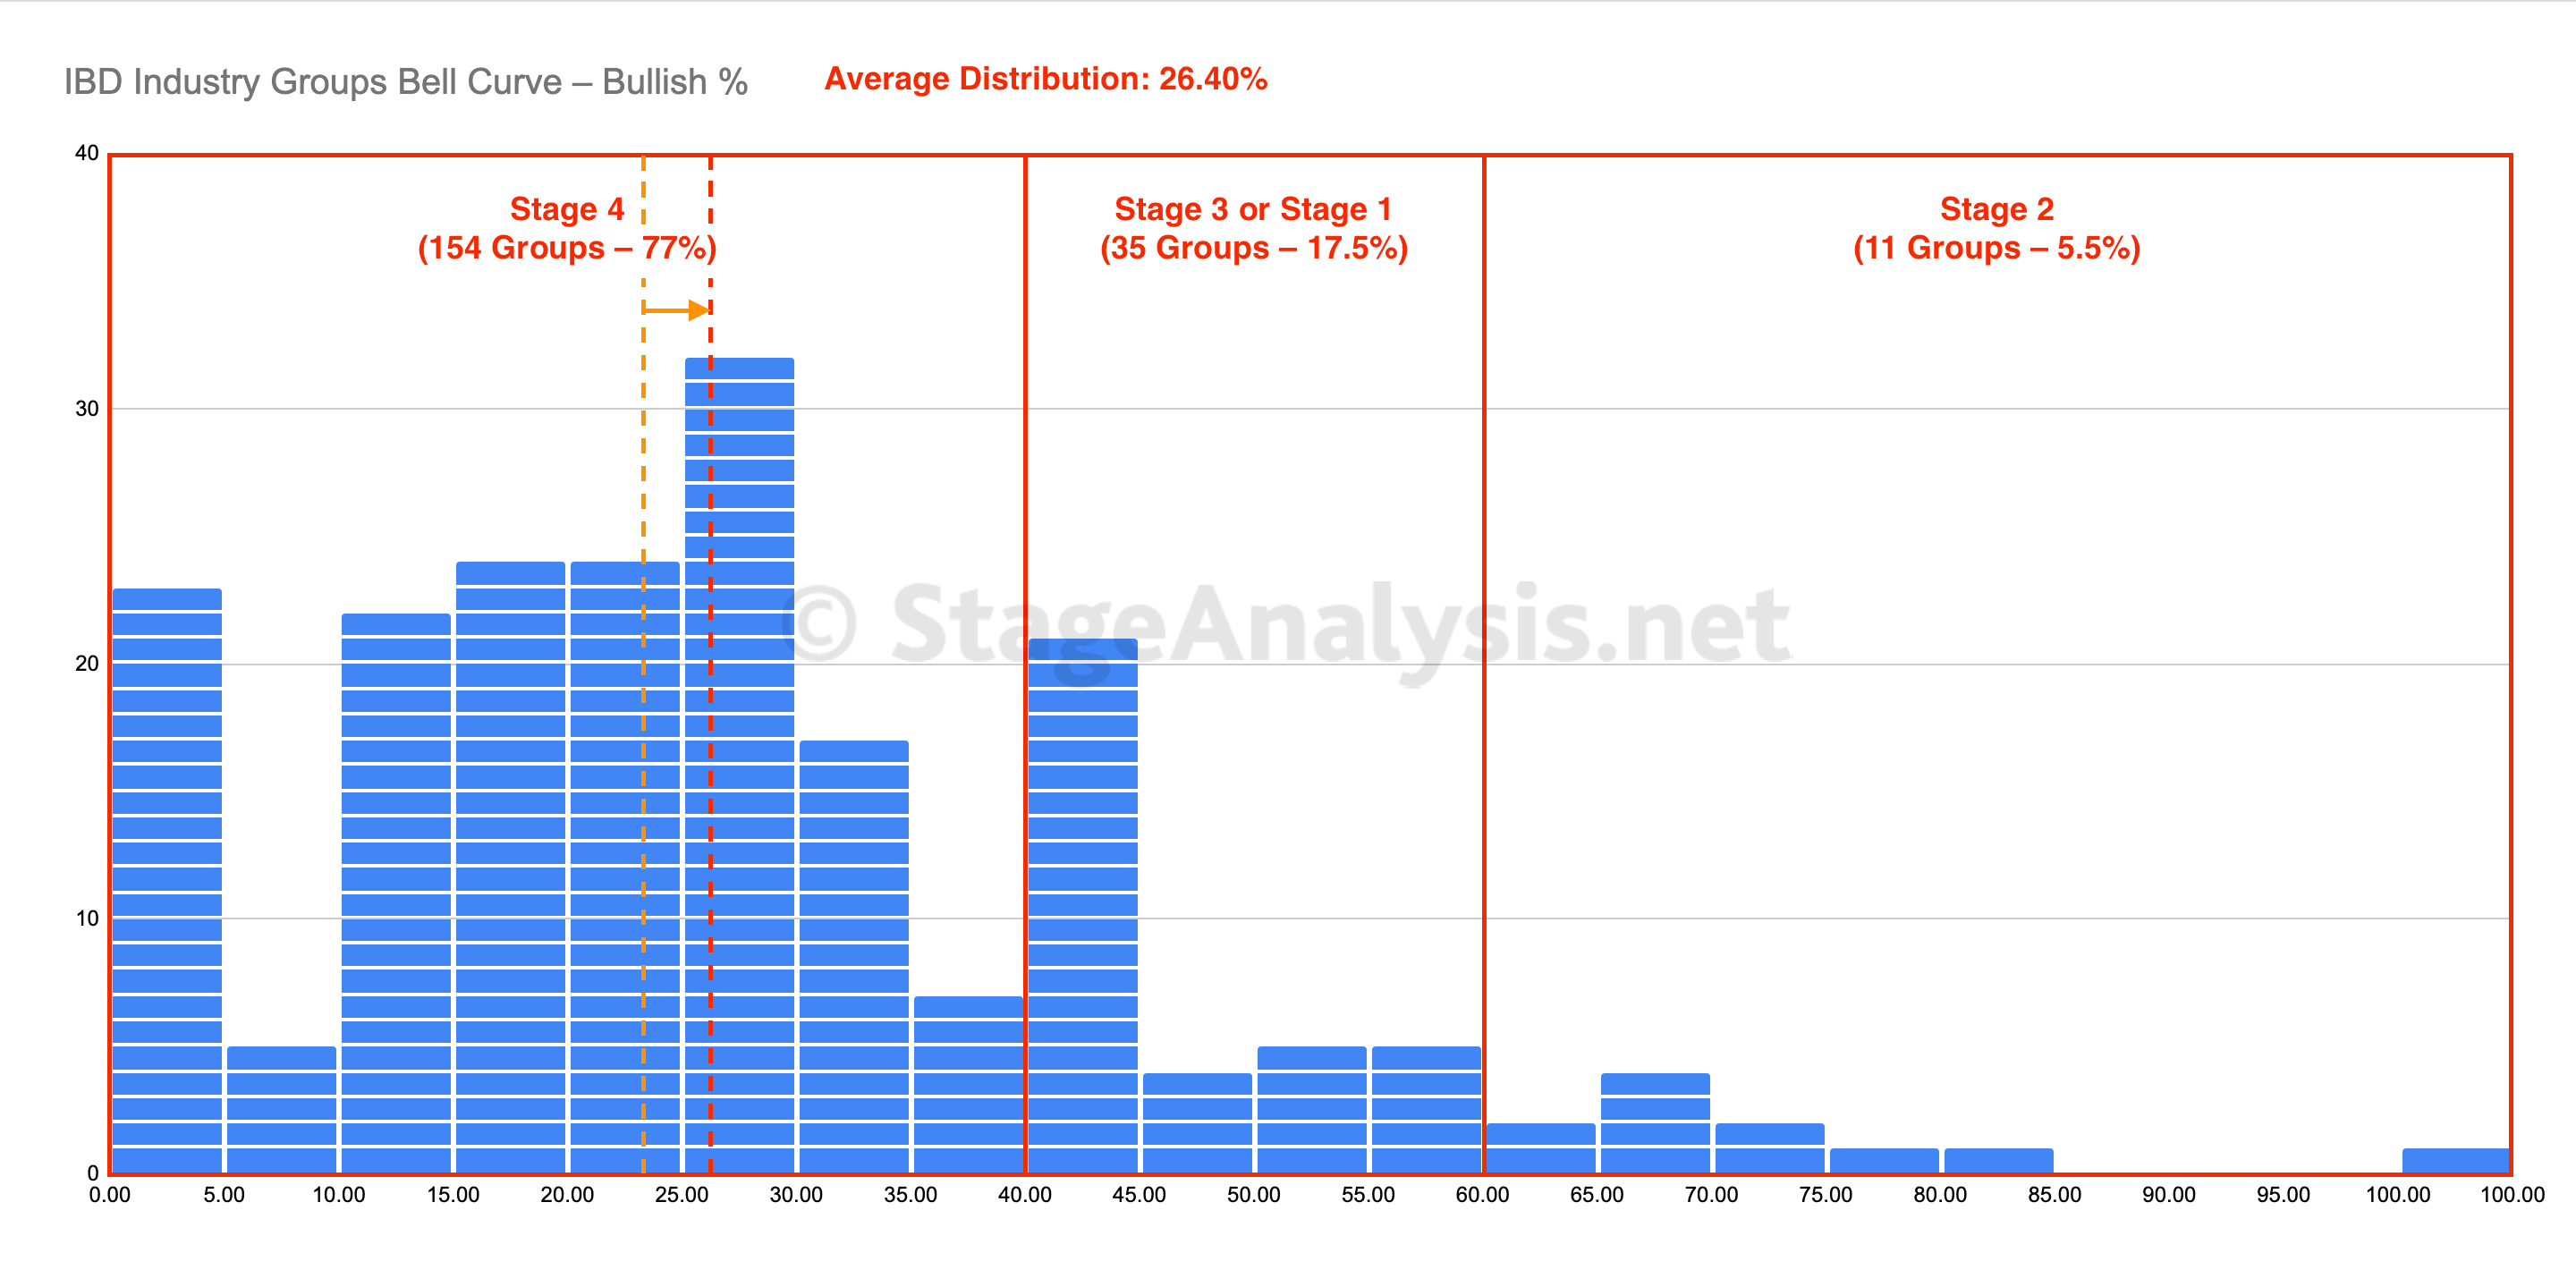
The Stage Analysis Members Midweek Video features Analysis of the Stages of the major US sectors, as well as a look at the sector breadth visual the custom IBD Industry Groups Bell Curve – Bullish % chart that I do for the members that shows the distribution of the 200 IBD Industry Groups as a bell curve chart...
Read More
14 May, 2022
Sector Breadth: Percentage of US Stocks Above Their 150 day (30 Week) Moving Averages
The majority of sectors have now fallen into the lower zone – which we haven't seen on the sector breadth visual since March 2020. So it's reached an extreme. But unlike the March 2020 visual, the current market still has a few sectors in the mid and upper zones, as Energy remains at very high level of 80.24%...
Read More
28 April, 2022
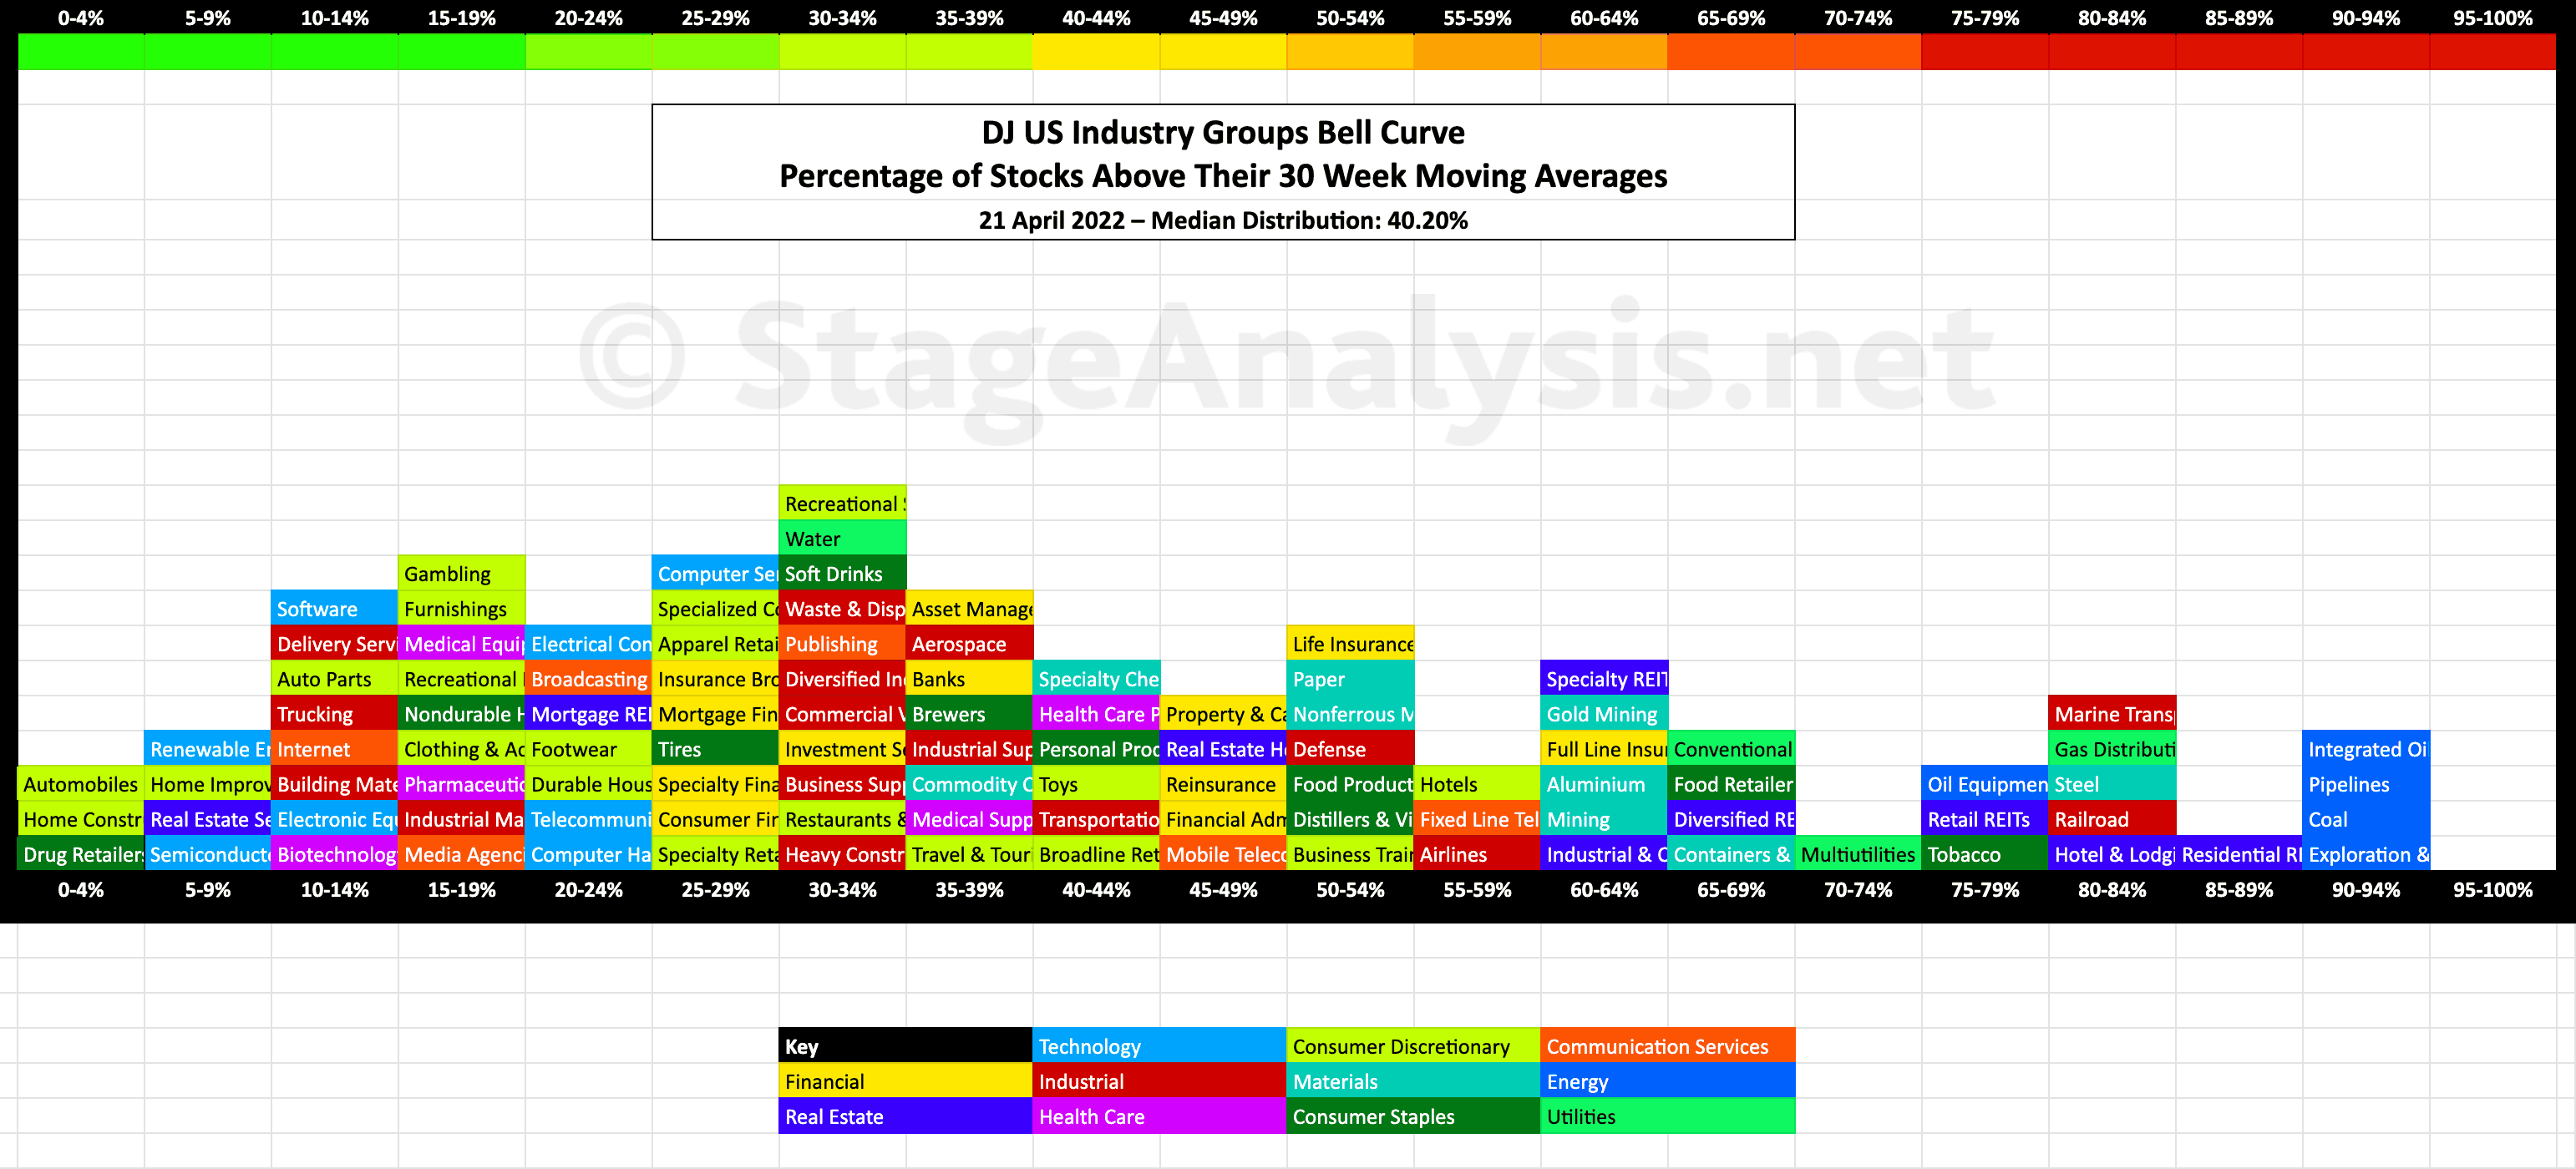
US Industry Groups Bell Curve – Exclusive to Stage Analysis
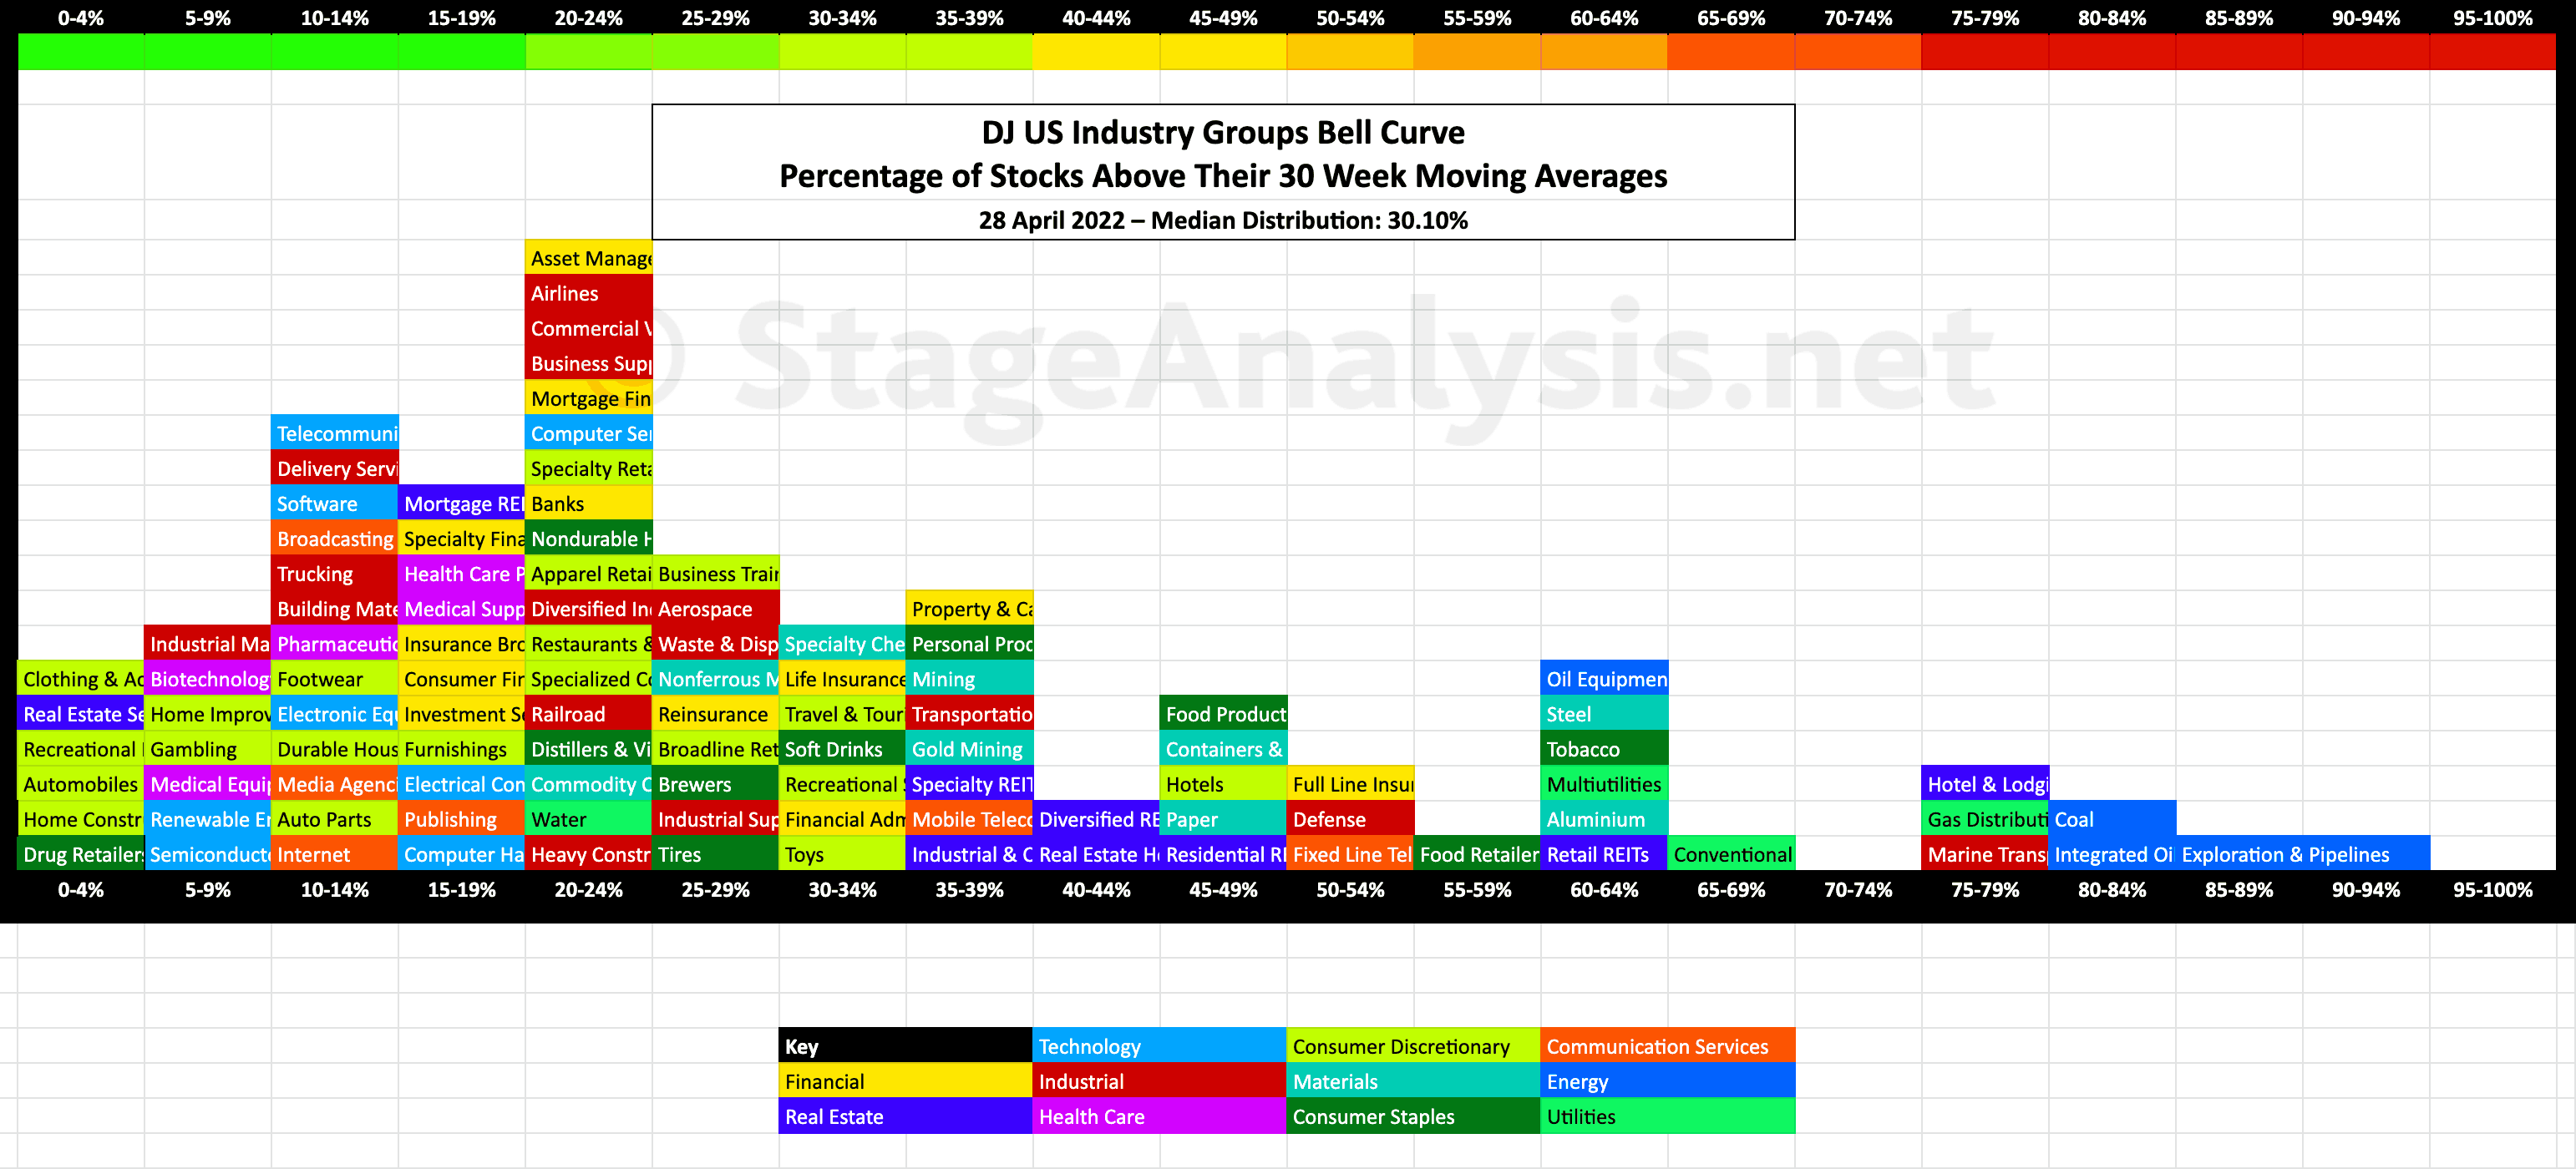
Exclusive graphic of the 104 Dow Jones Industry Groups showing the Percentage of Stocks Above 30 week MA in each group visualised as a Bell Curve chart – inspired by the Sector Bell Curve work by Tom Dorsey in his Point & Figure book....
Read More
24 April, 2022
Stage Analysis Members Weekend Video - 24 April 2022 (1hr 30mins)
This weekends Stage Analysis Members Video features analysis of the Major US Stock Market Indexes – S&P 500, Nasdaq Composite, Russell 2000 and the individual US Market Sectors Stages. Plus the a detailed look at the US Industry Groups Relative Strength focusing on the Change of Behaviour in the strongest RS groups...
Read More
23 April, 2022
Sector Breadth: Percentage of US Stocks Above Their 150 day (30 Week) Moving Averages
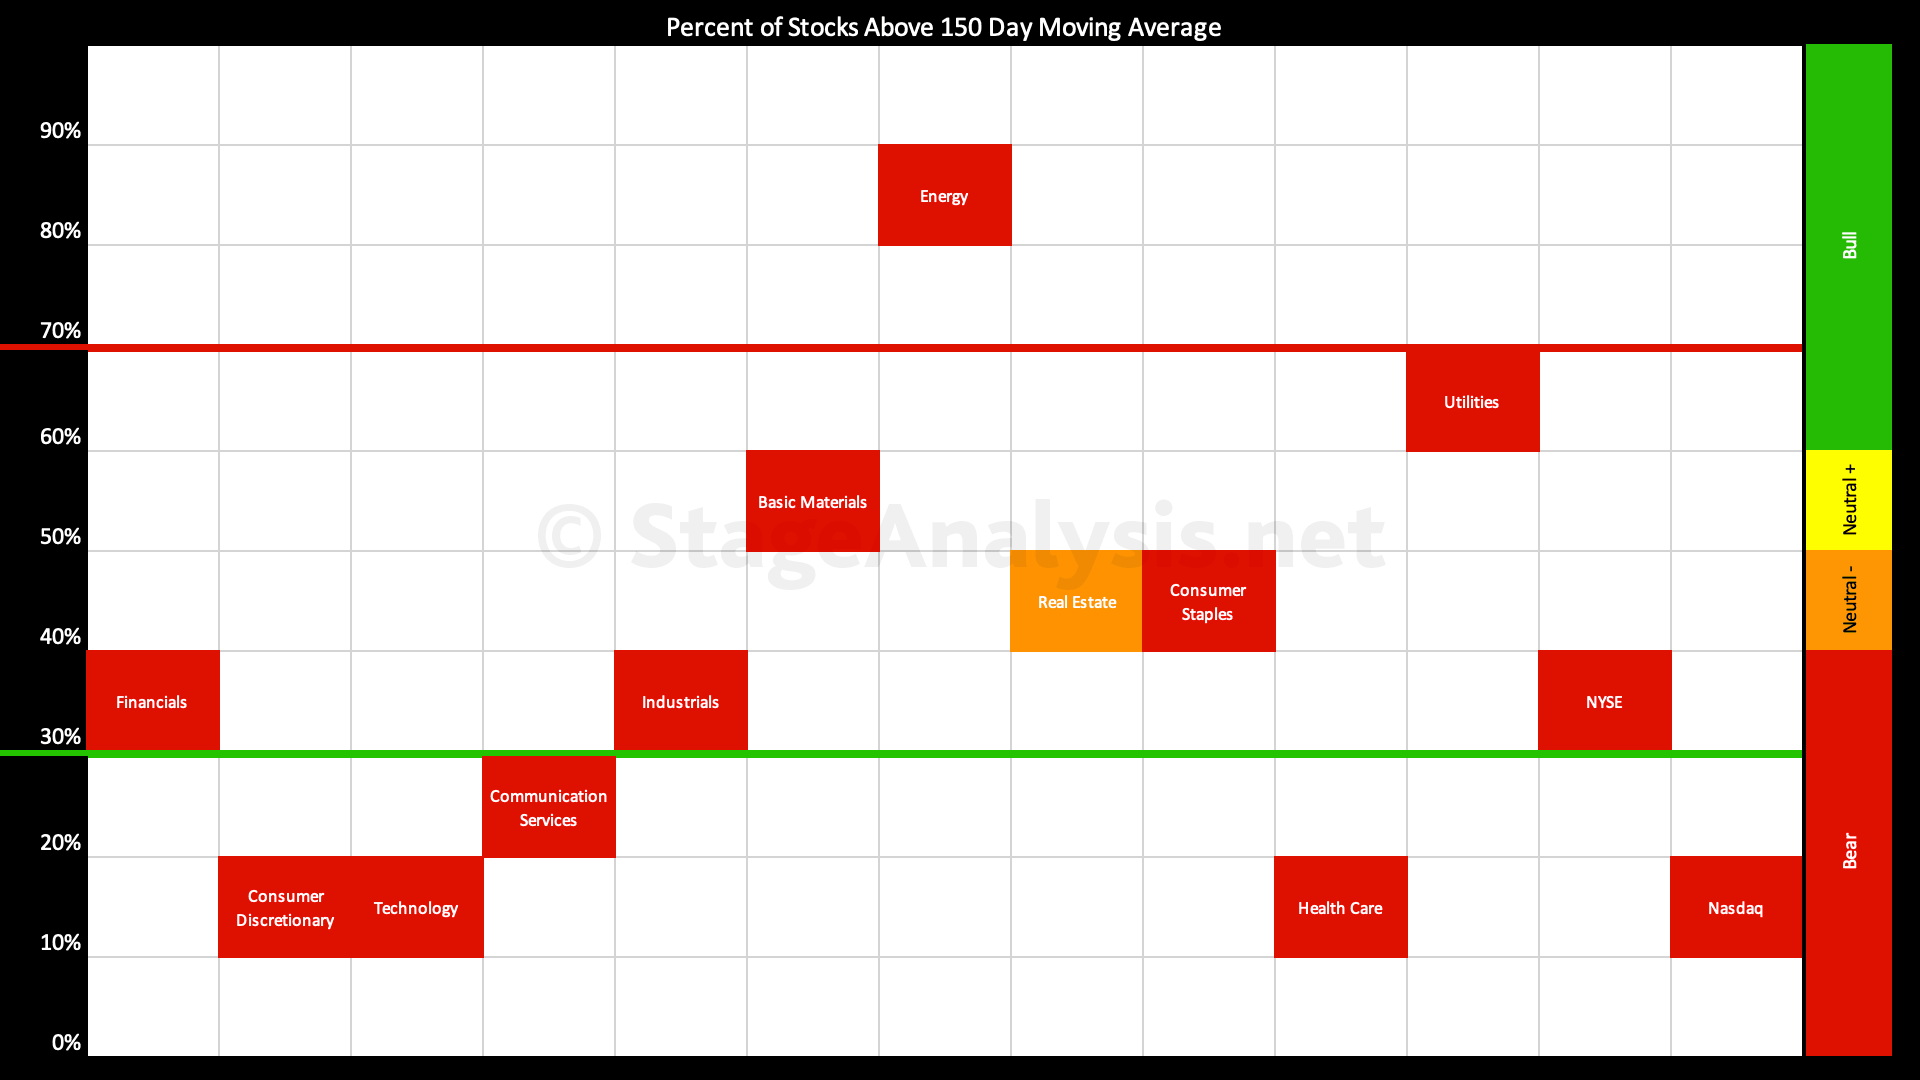
There were negative grid changes in 5 of the 11 sectors since the last update two weeks ago, with the overall average down to 40.53%. The biggest declines this week were in the Basic Materials and Utilities sectors – dropping the Basic Materials below the 60% level out of the Stage 2 zone and into the more neutral Stage 3 / Stage 1 zone...
Read More
21 April, 2022
US Industry Groups Bell Curve – Exclusive to Stage Analysis
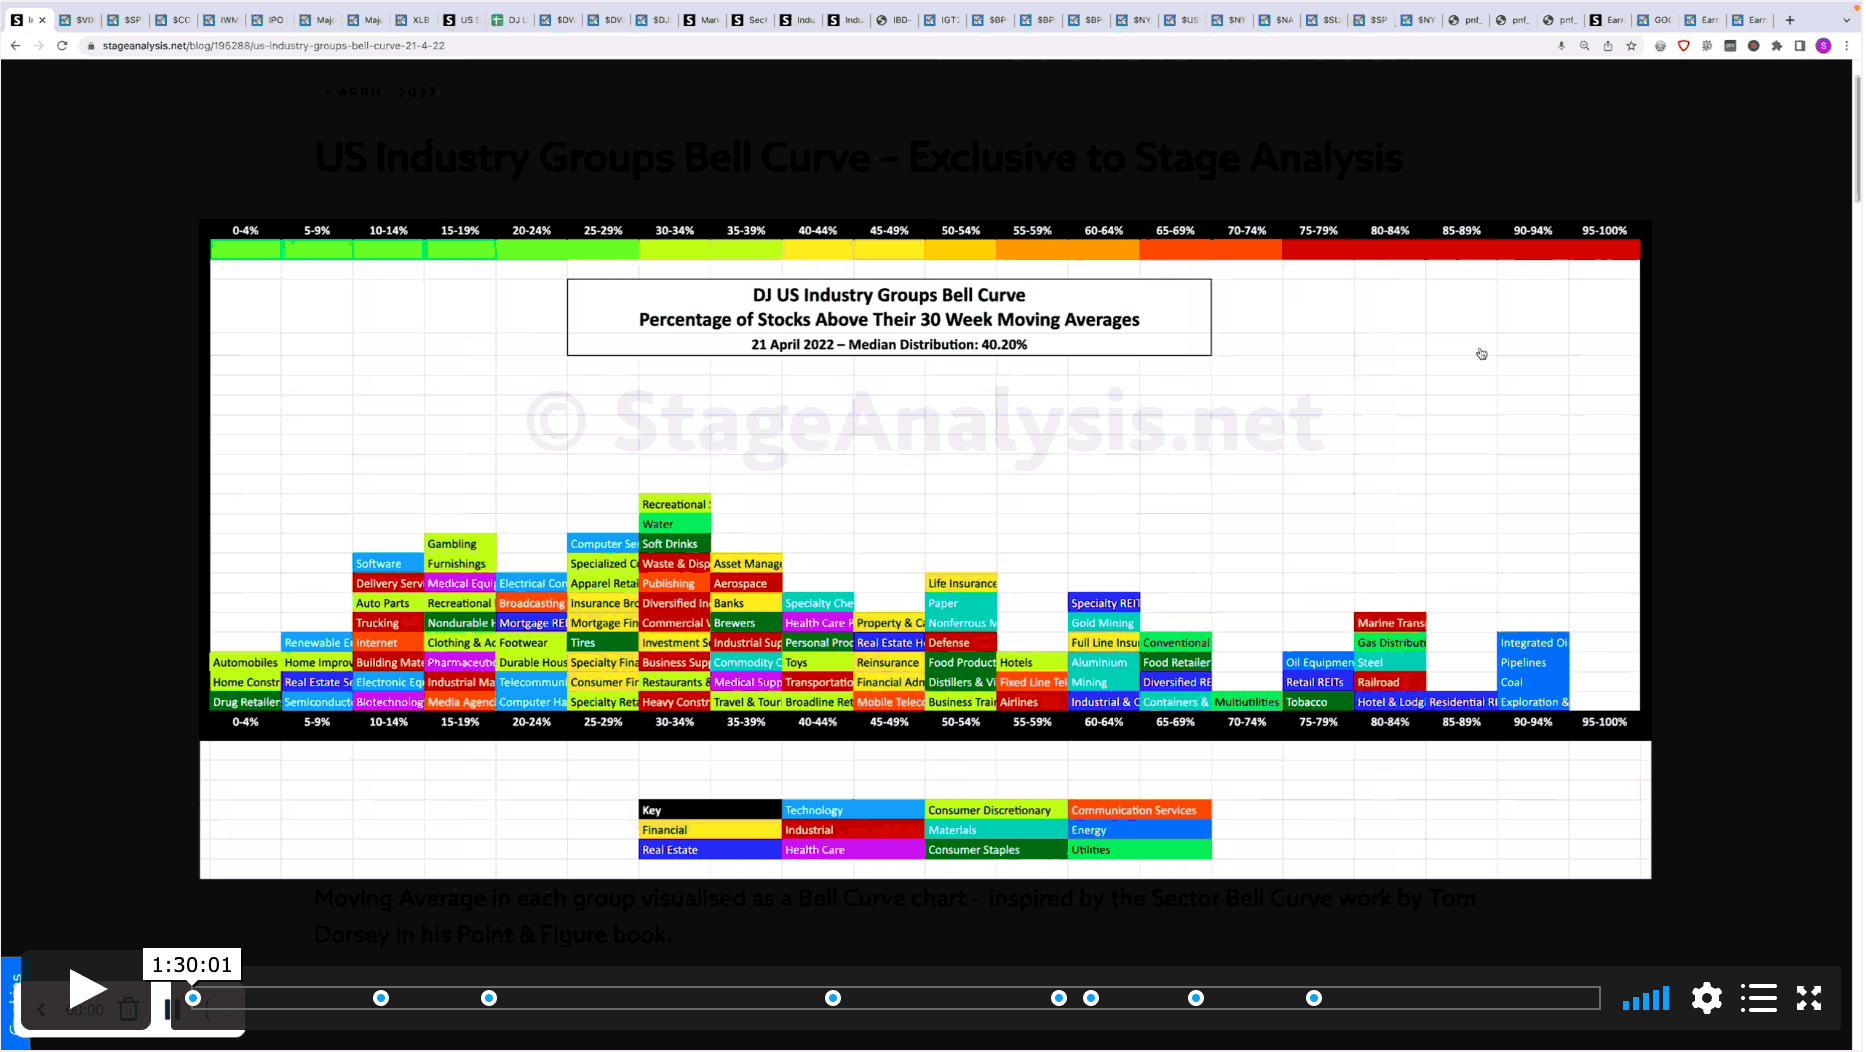
Exclusive graphic of the 104 Dow Jones Industry Groups showing the Percentage of Stocks Above 30 week MA in each group visualised as a Bell Curve chart – inspired by the Sector Bell Curve work by Tom Dorsey in his Point & Figure book....
Read More
10 April, 2022
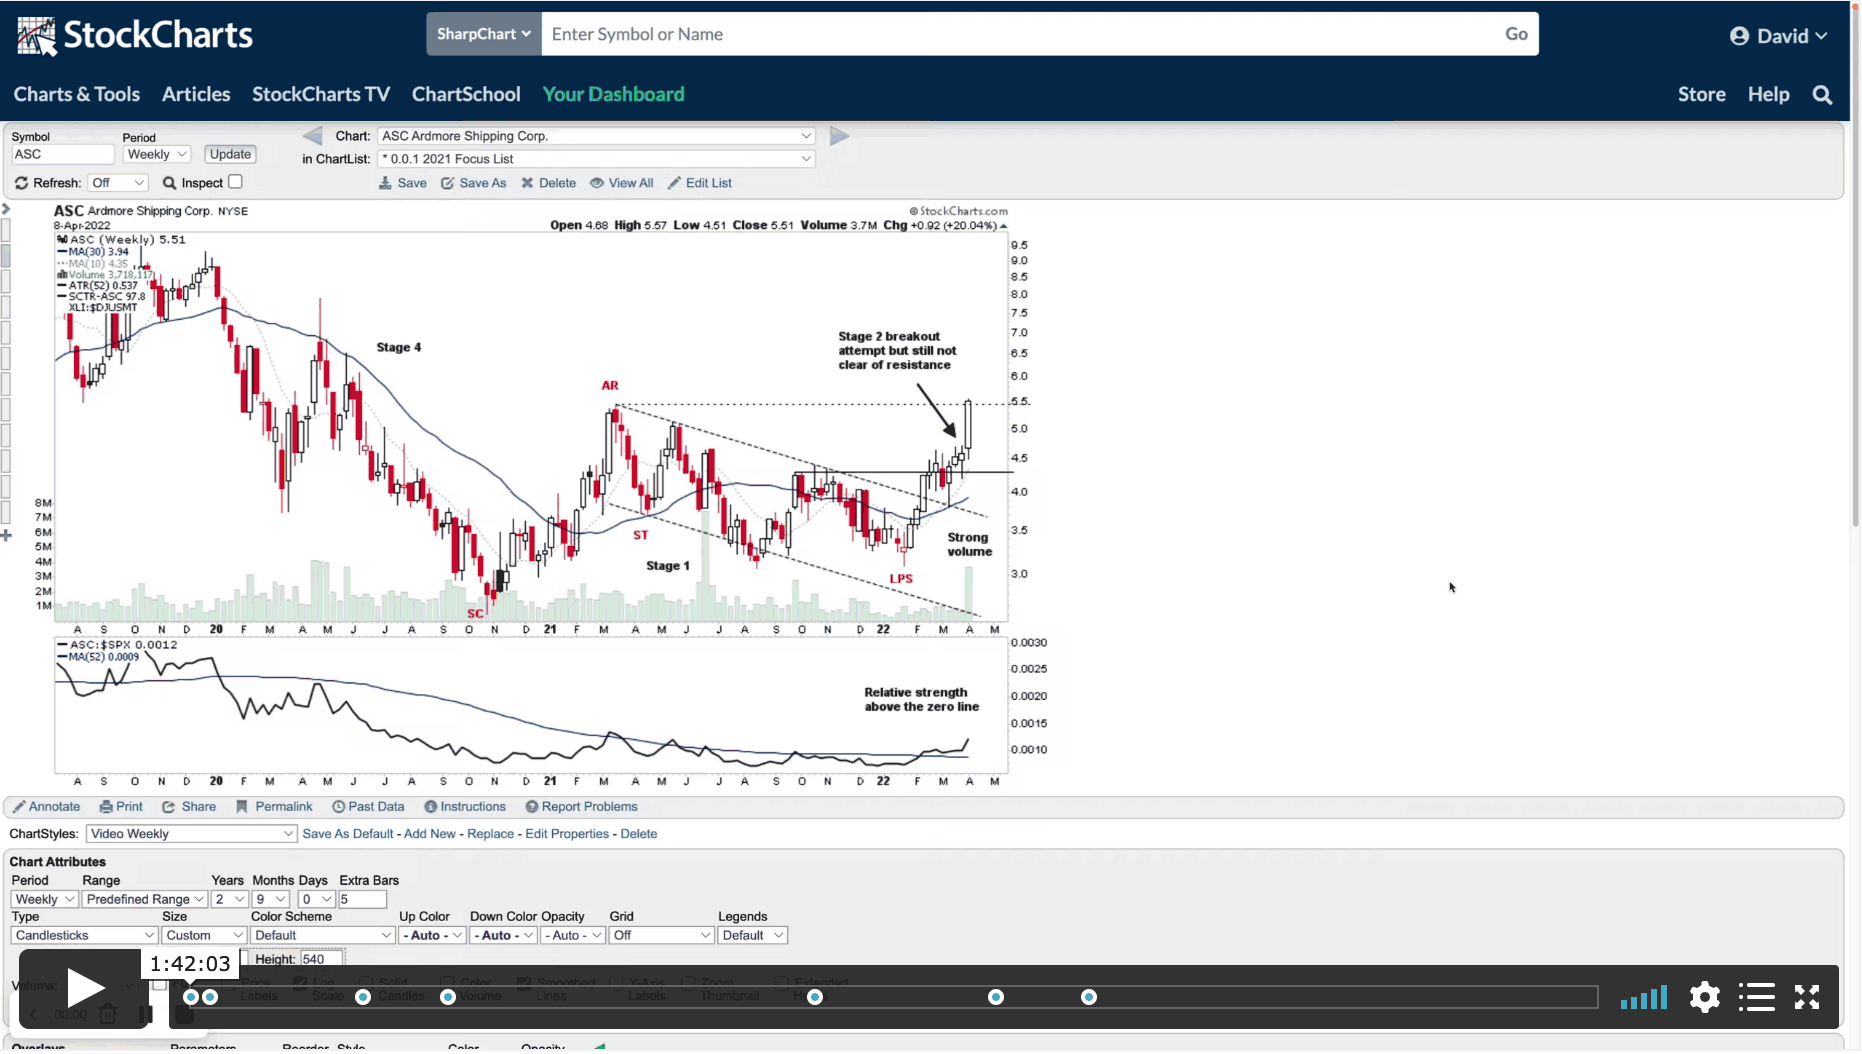
Stage Analysis Members Weekend Video – 10 April 2022 (1hr 42mins)
This weekends Stage Analysis Members Video features the Major Indexes – Nasdaq, S&P 500, Russell 2000, Sector Relative Strength, Market Breadth charts to determine the Weight of Evidence, Industry Group Relative Strength. A Group Focus on the Uranium Stocks and the US Stocks Watchlist in detail with marked up charts and explanations of the group themes and what I'm looking for in various stocks.
Read More

