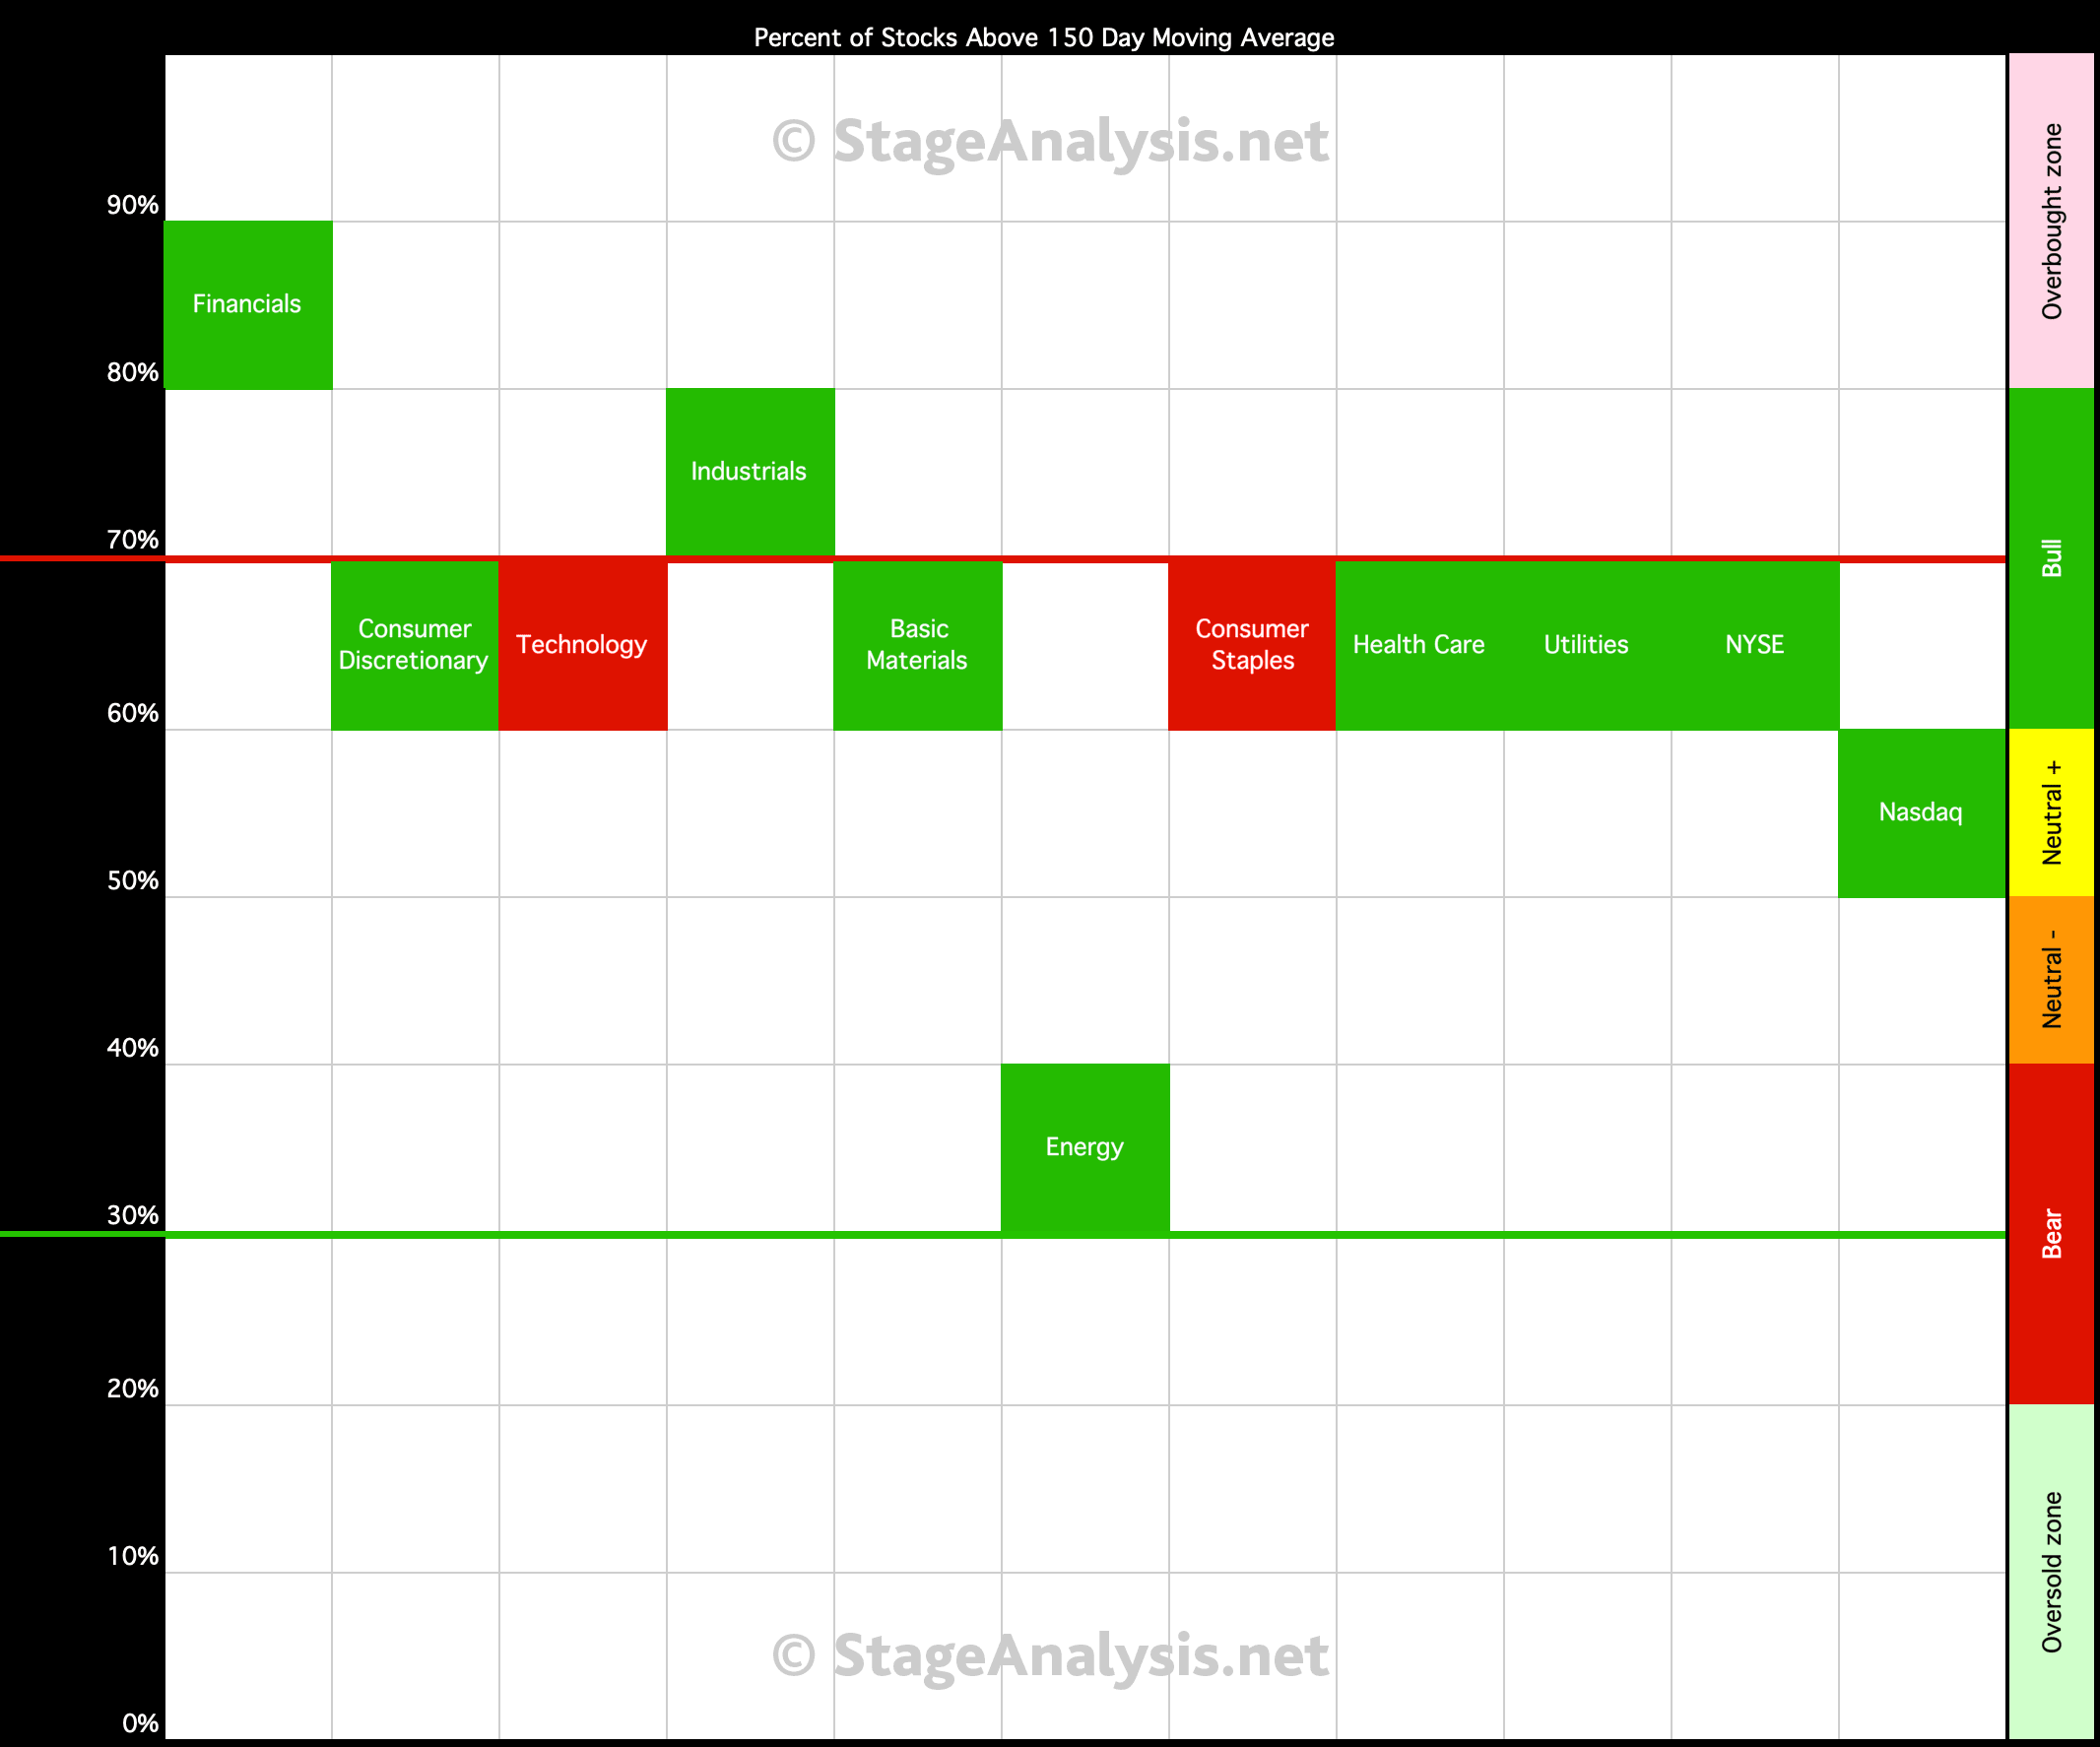
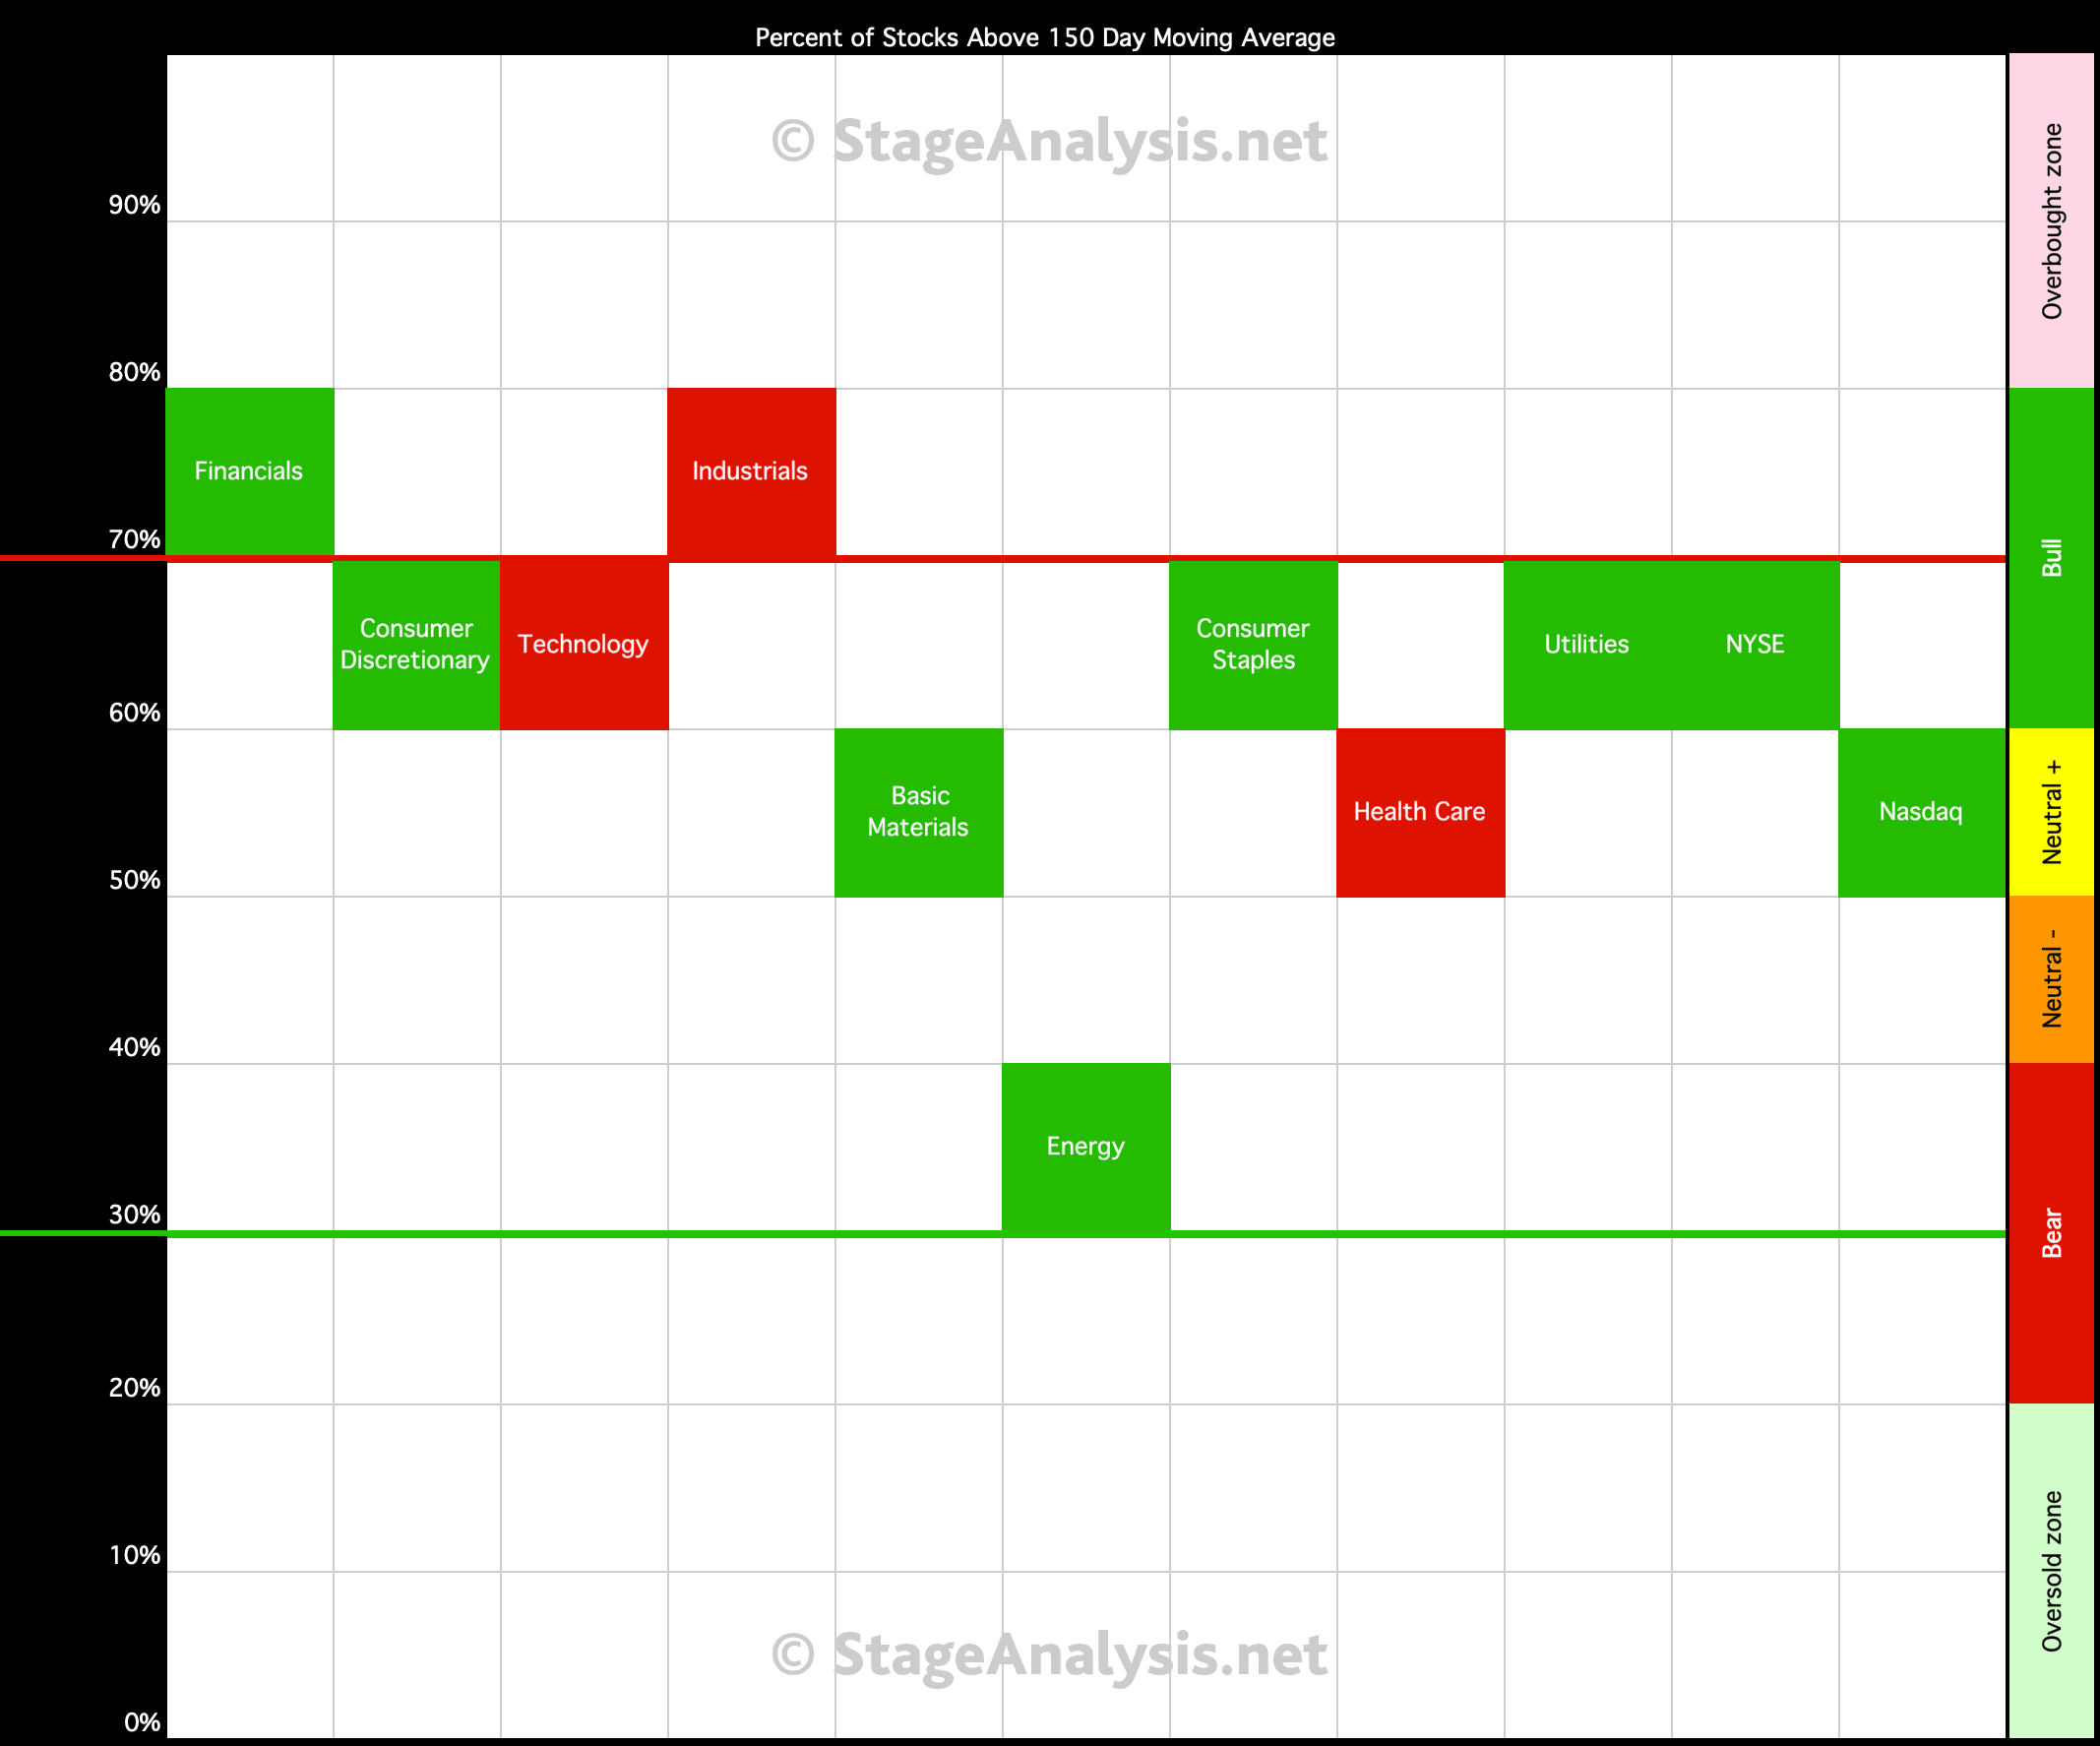
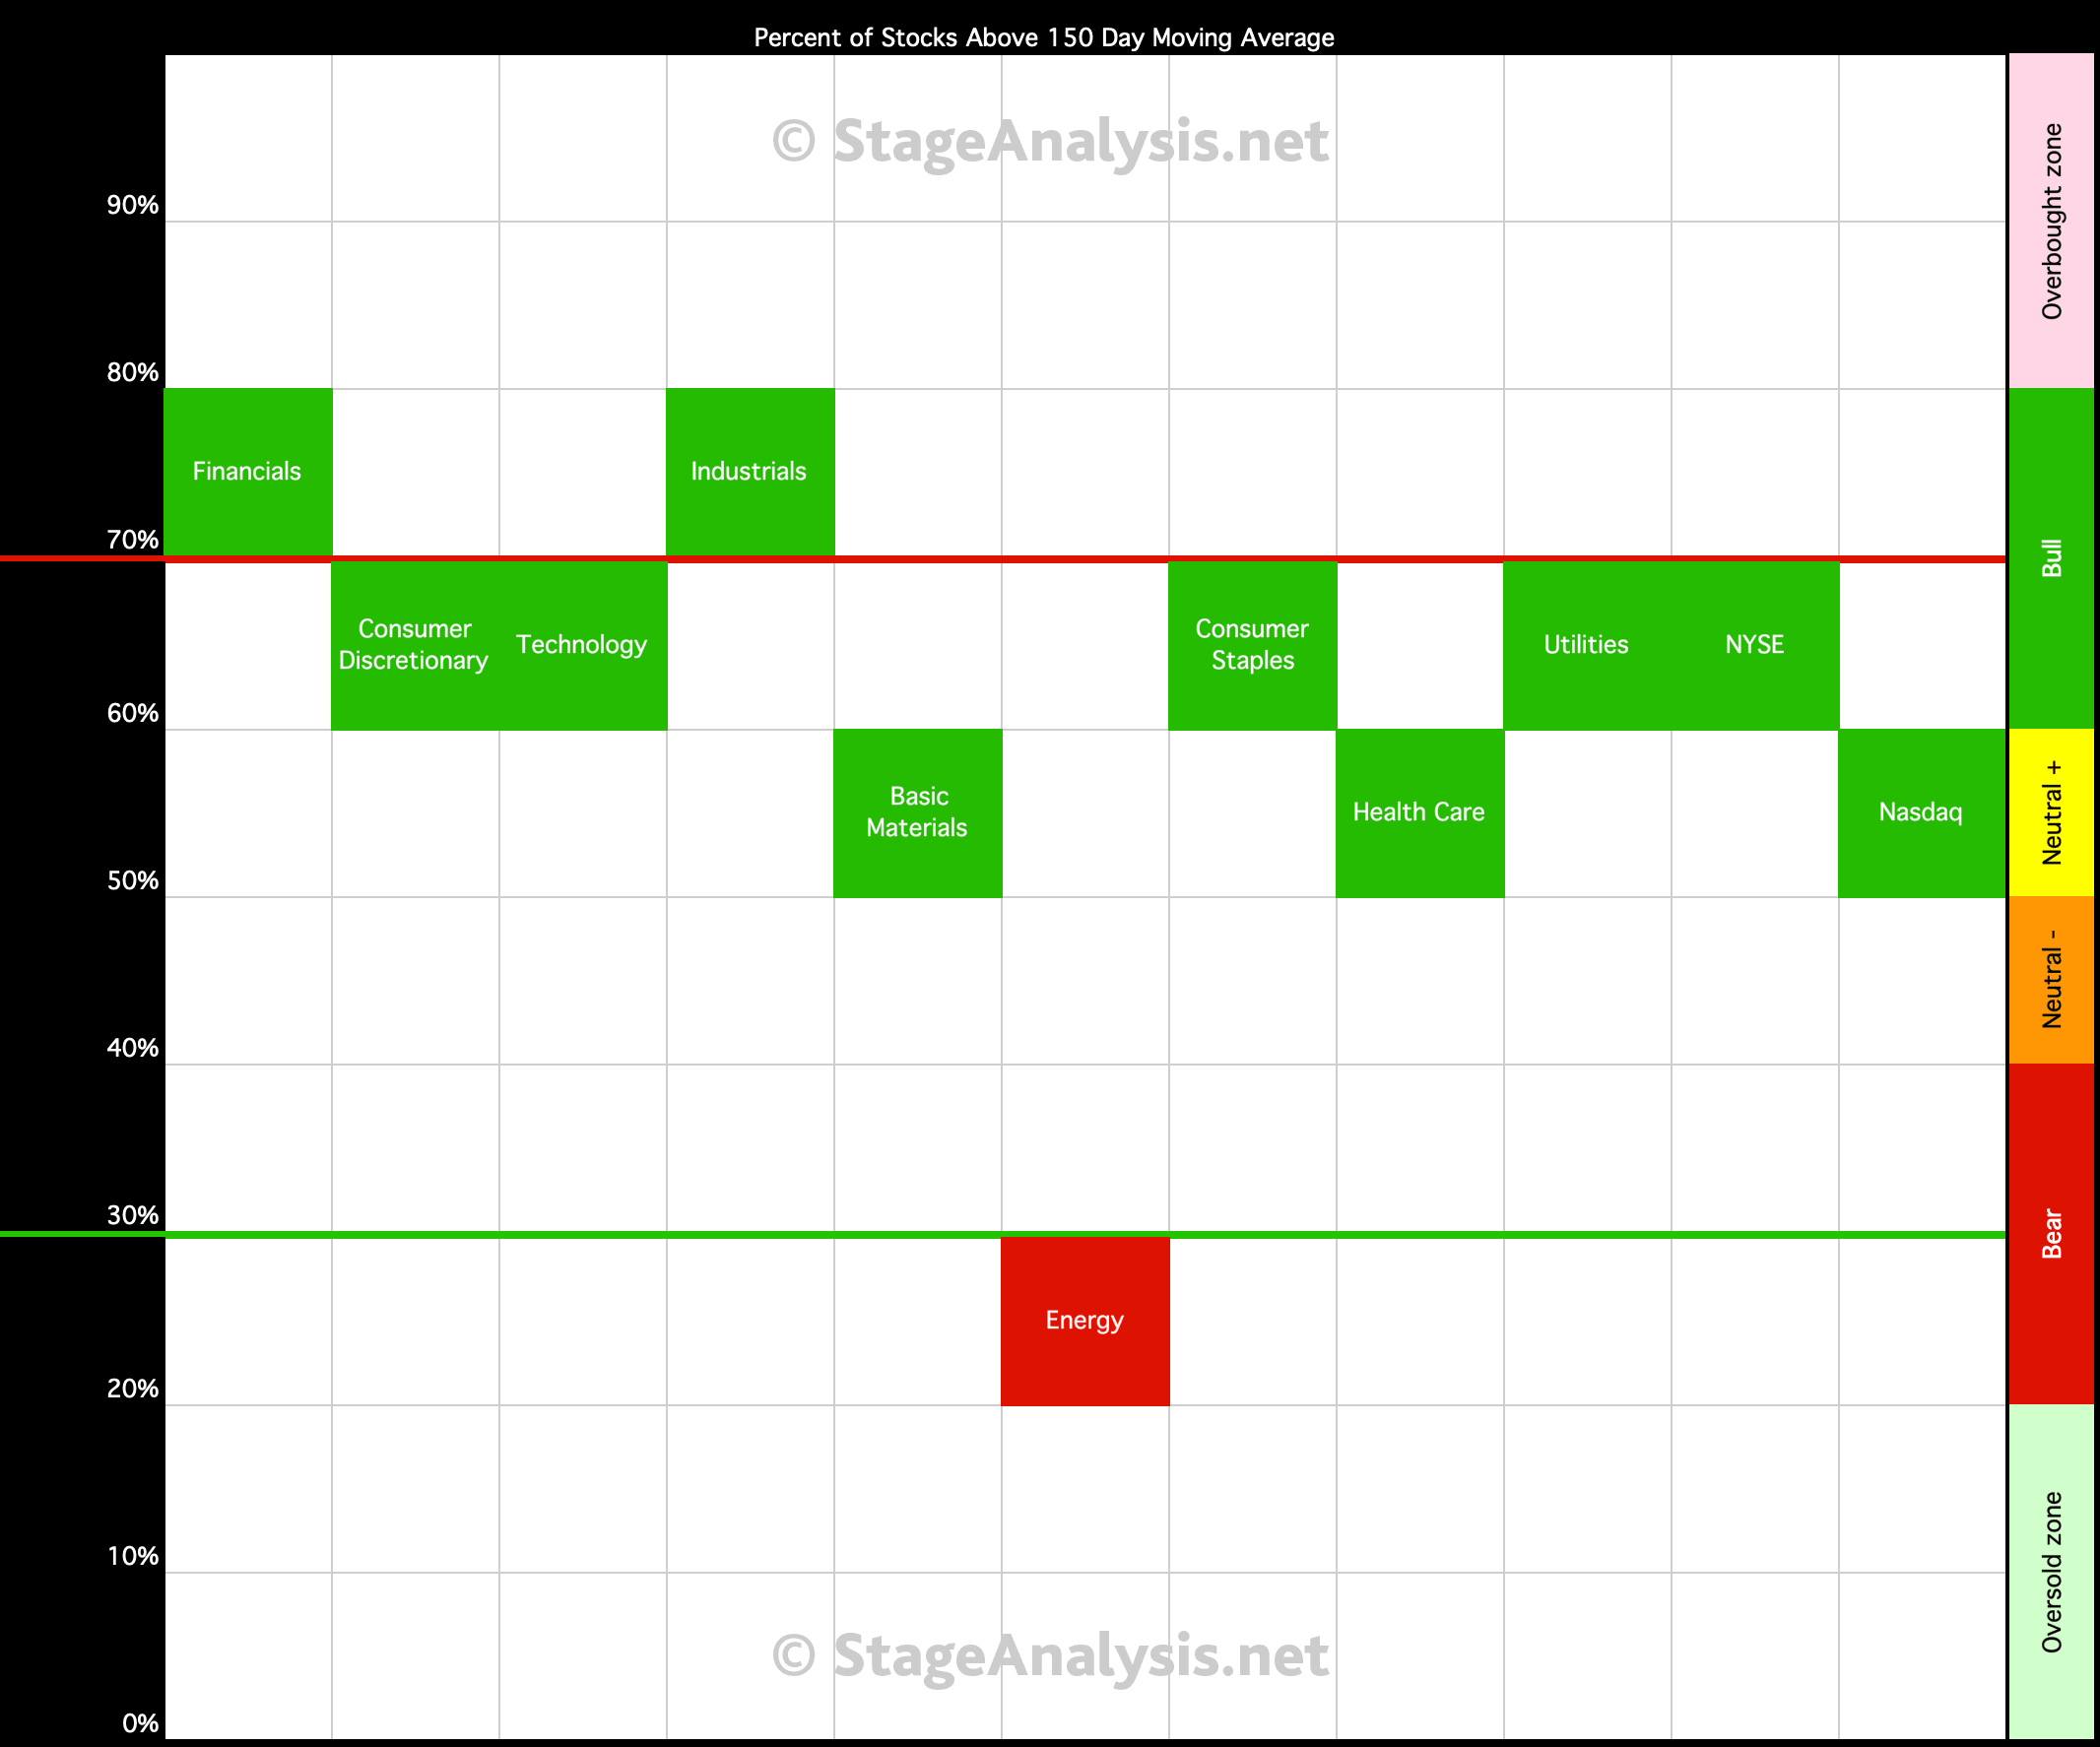
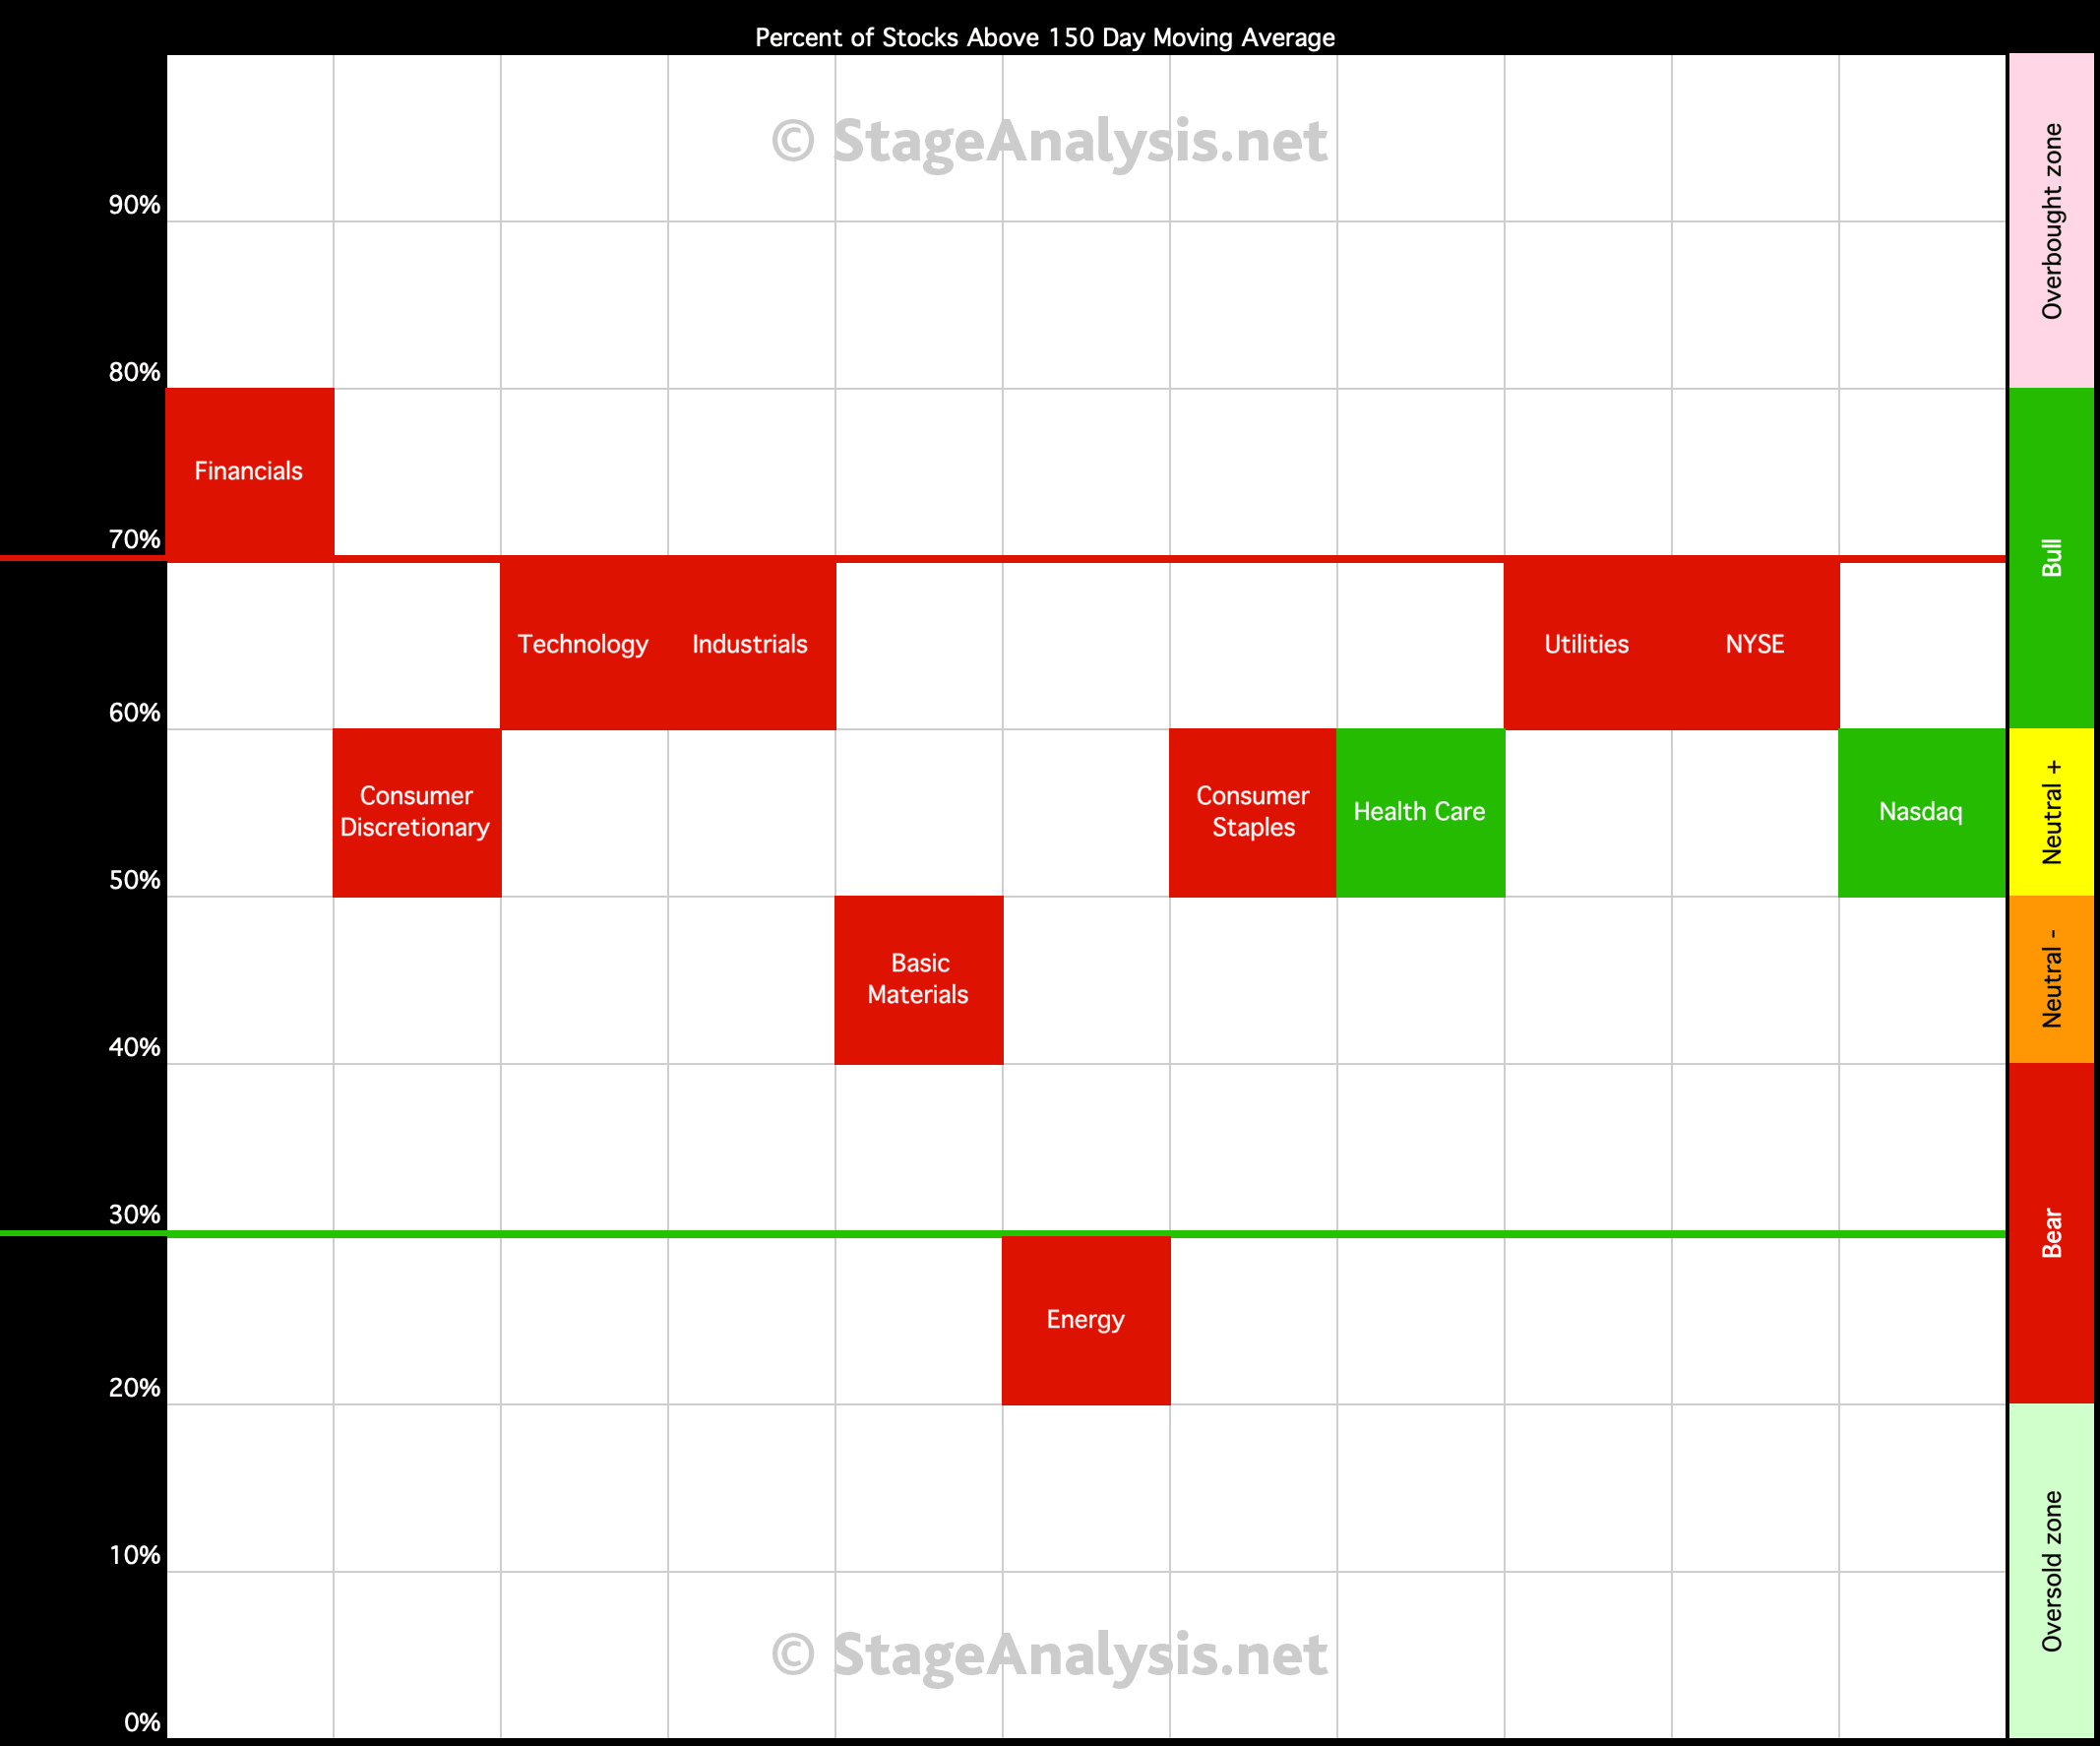
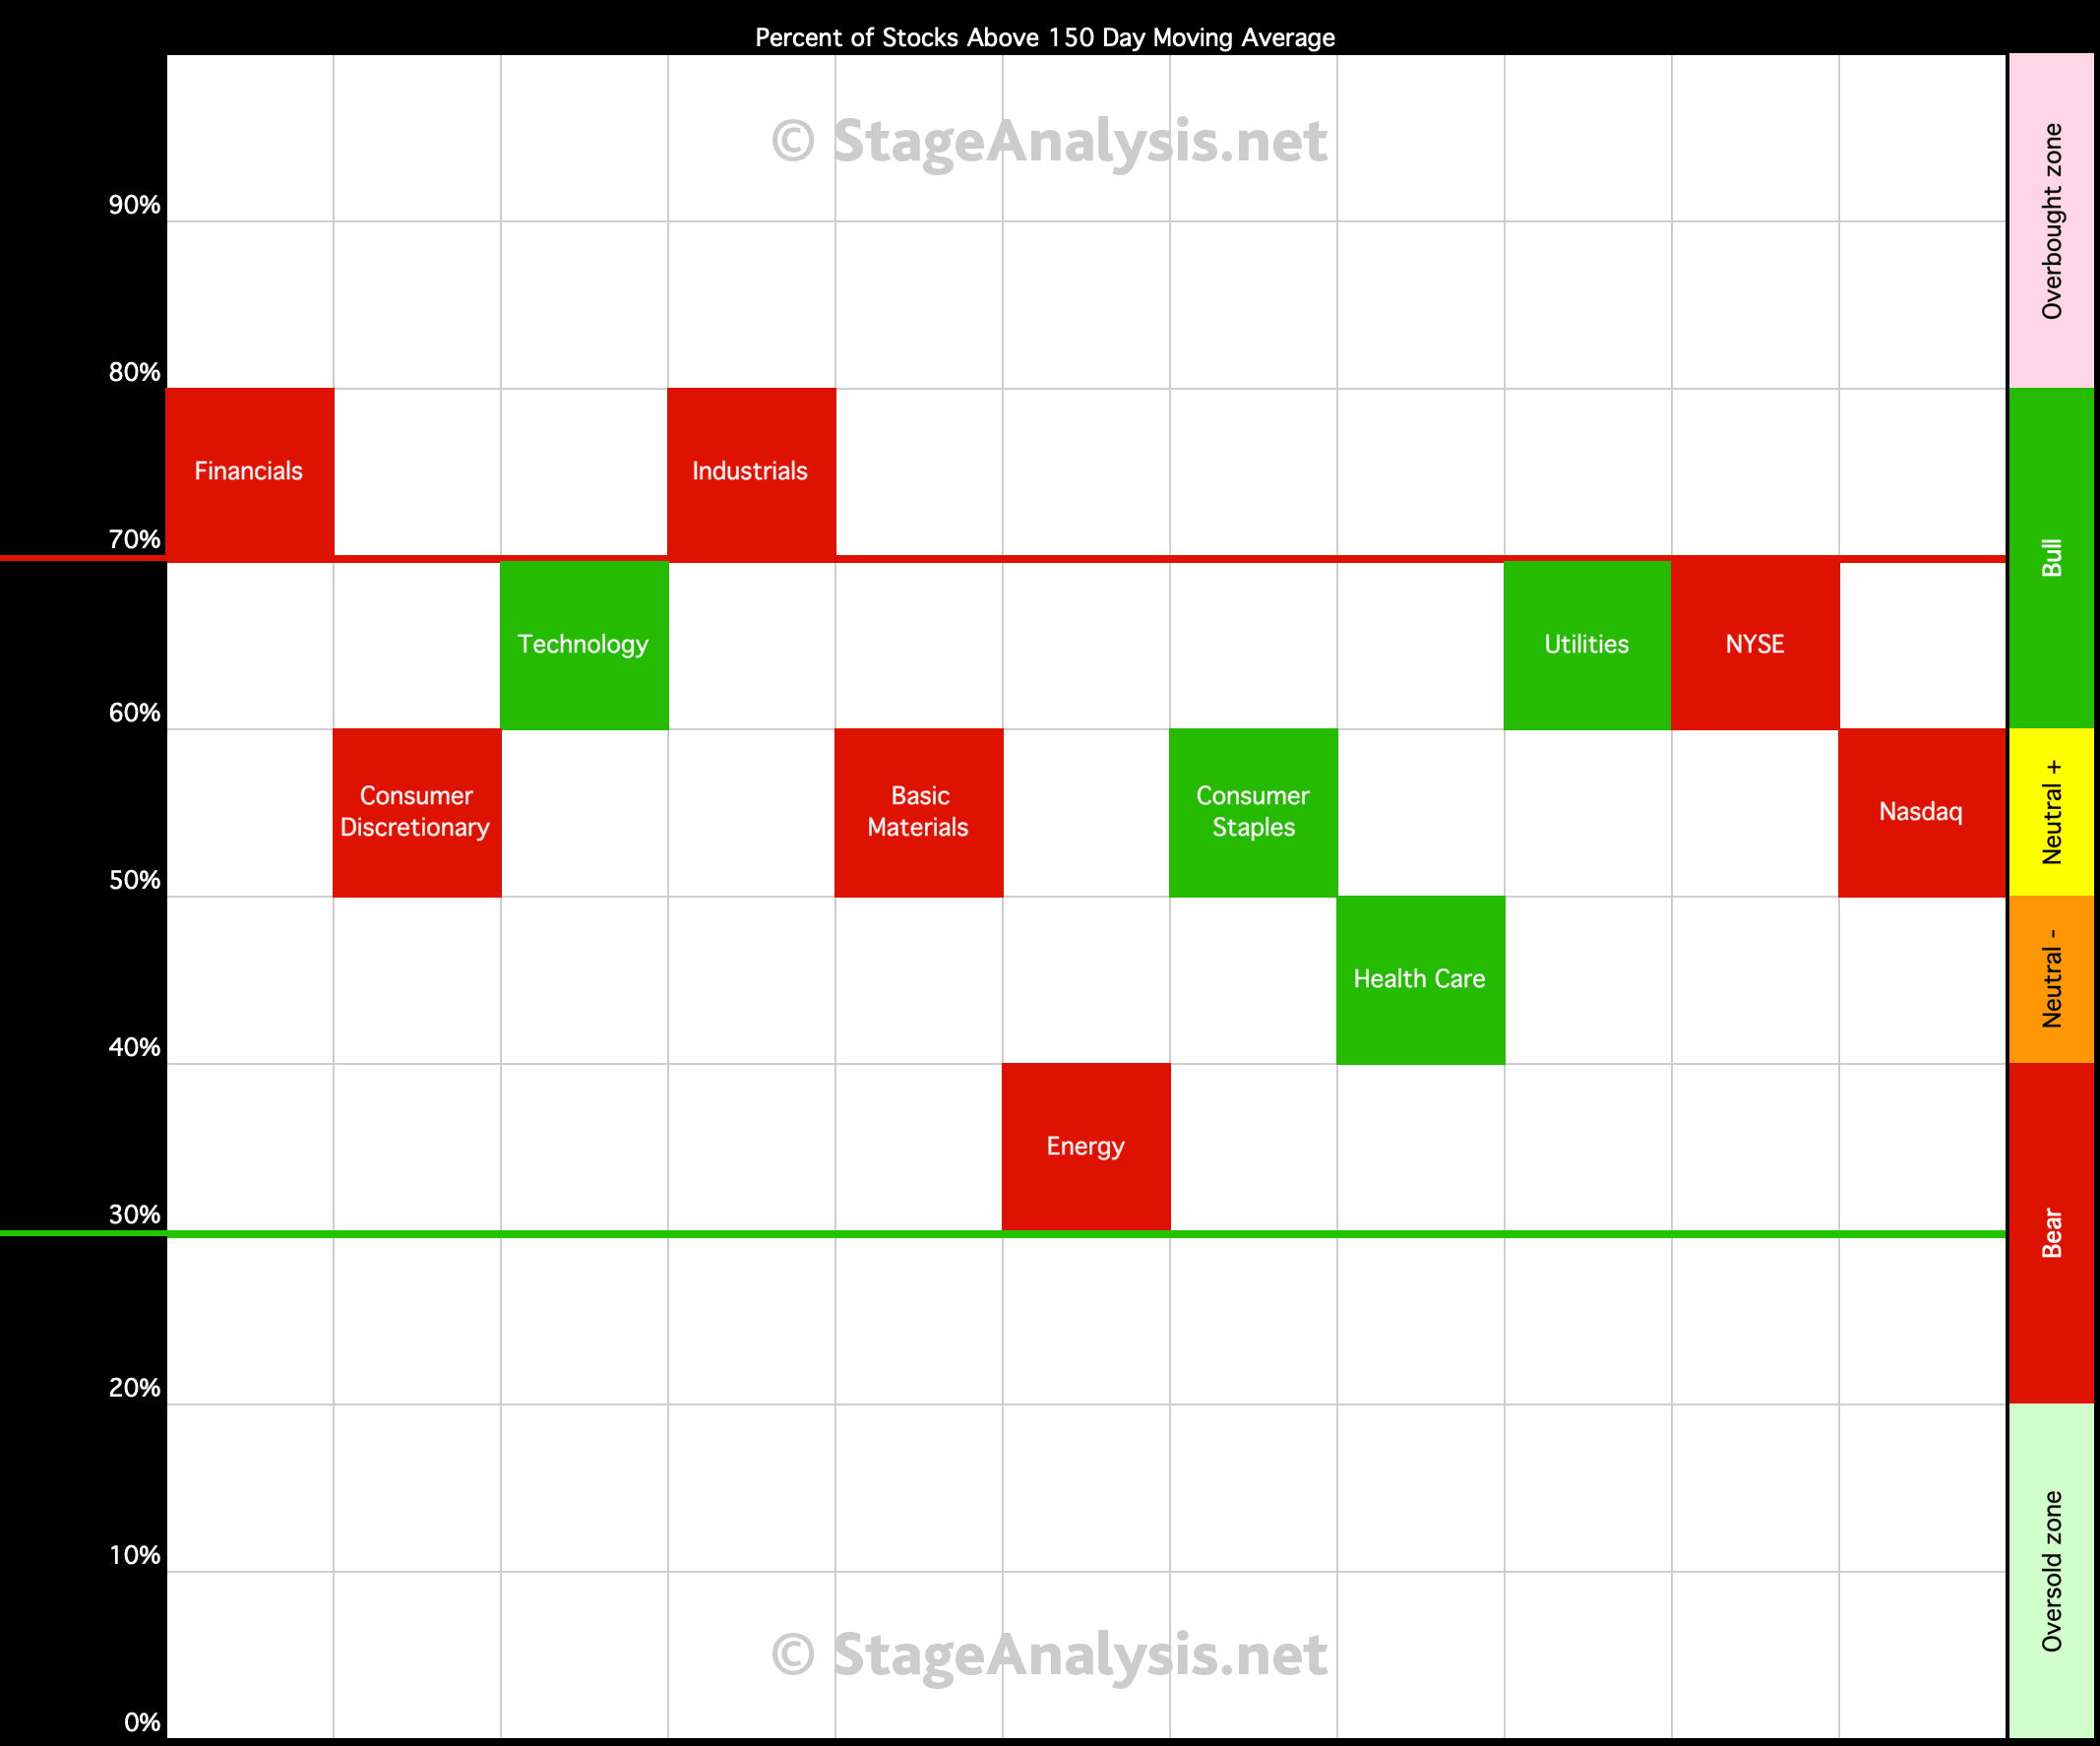
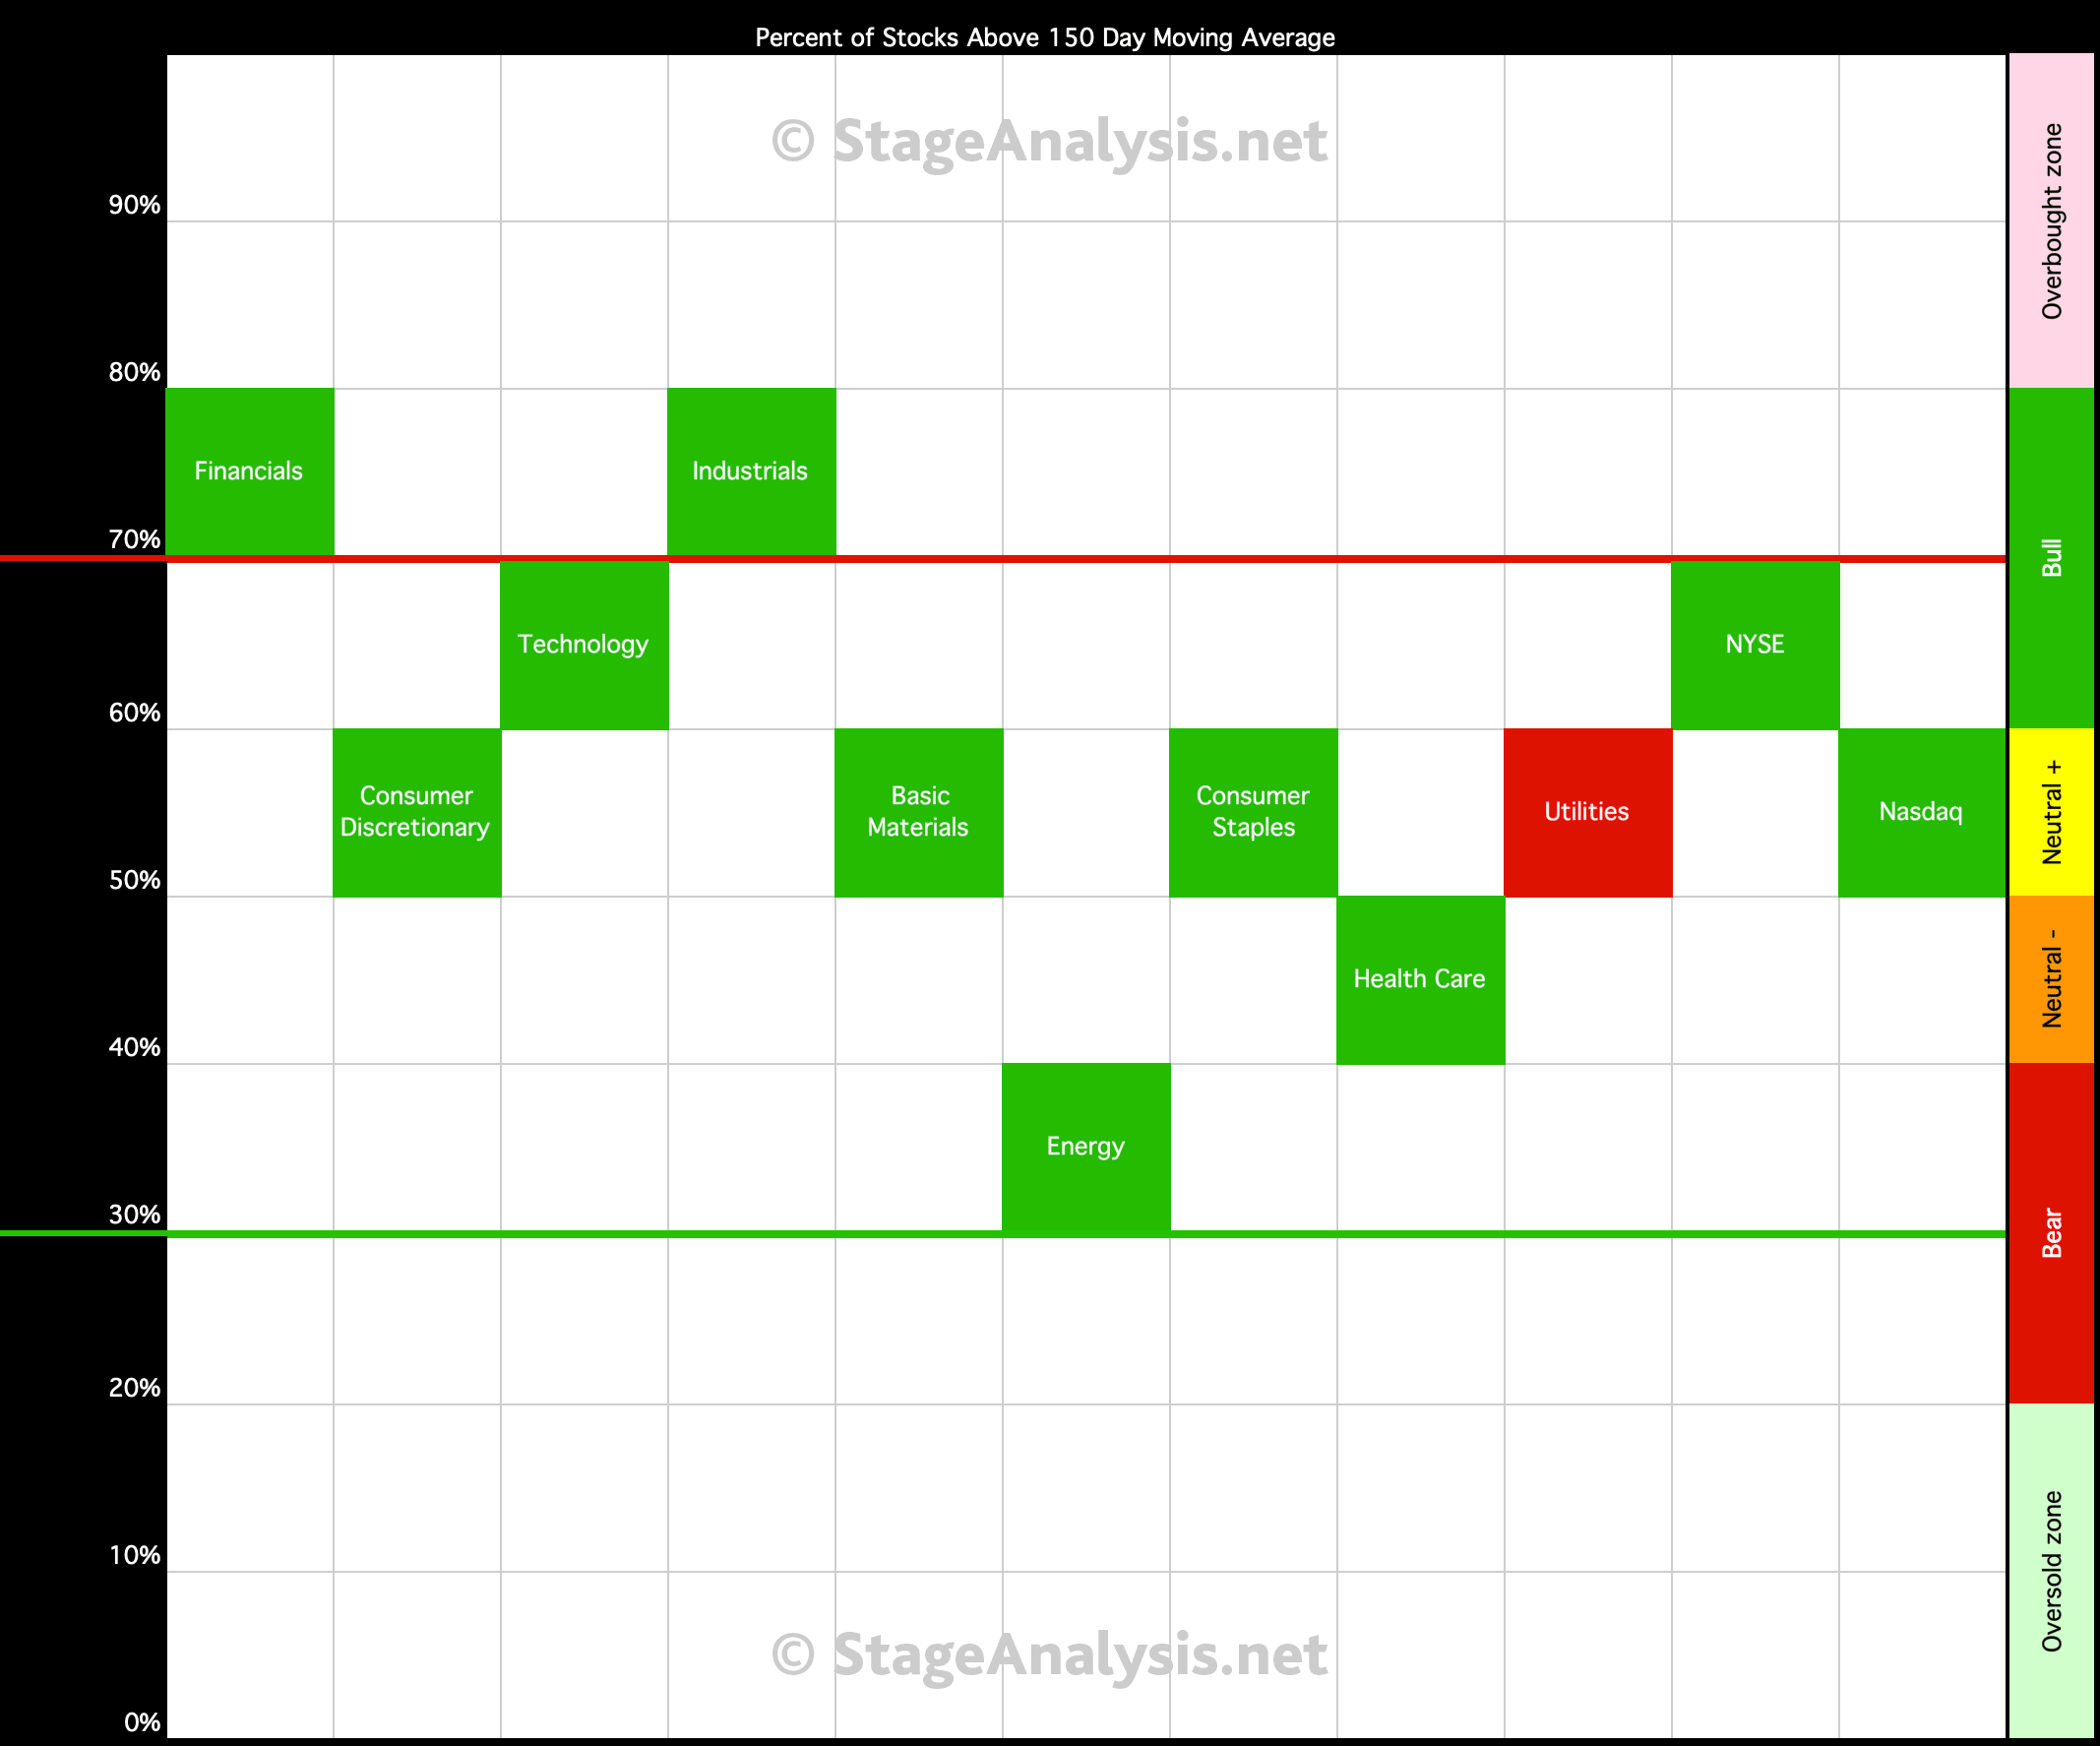
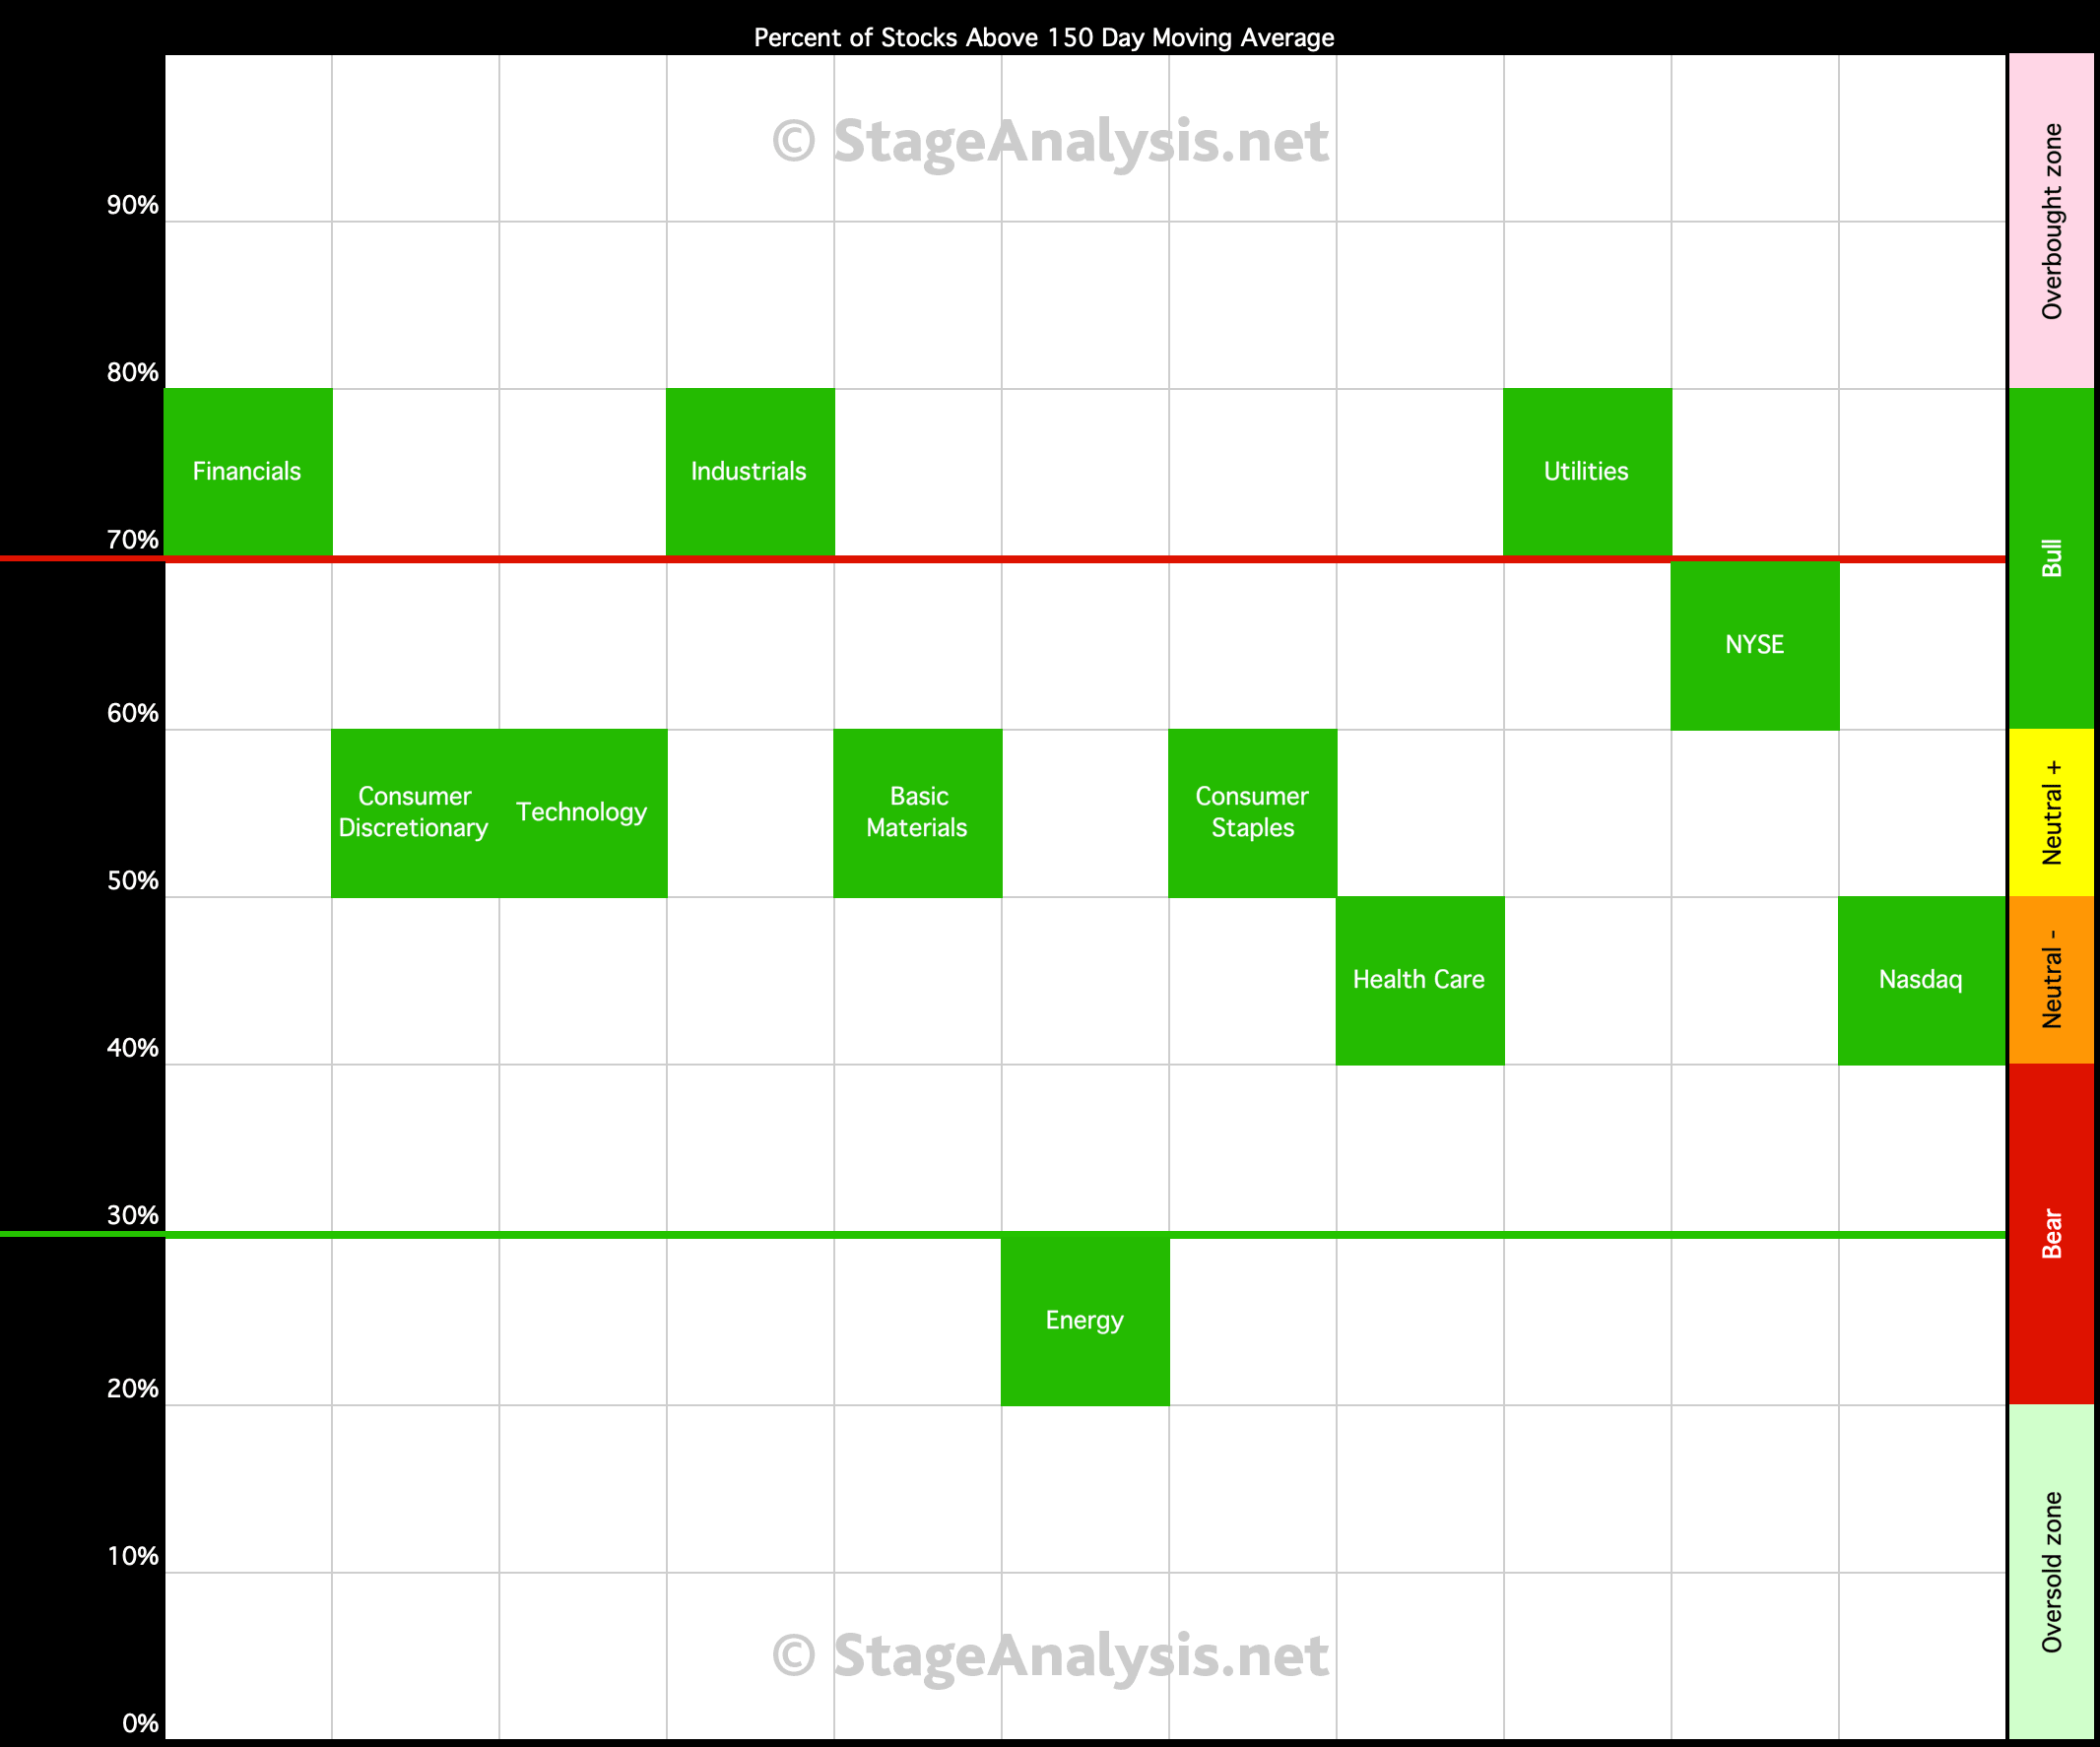
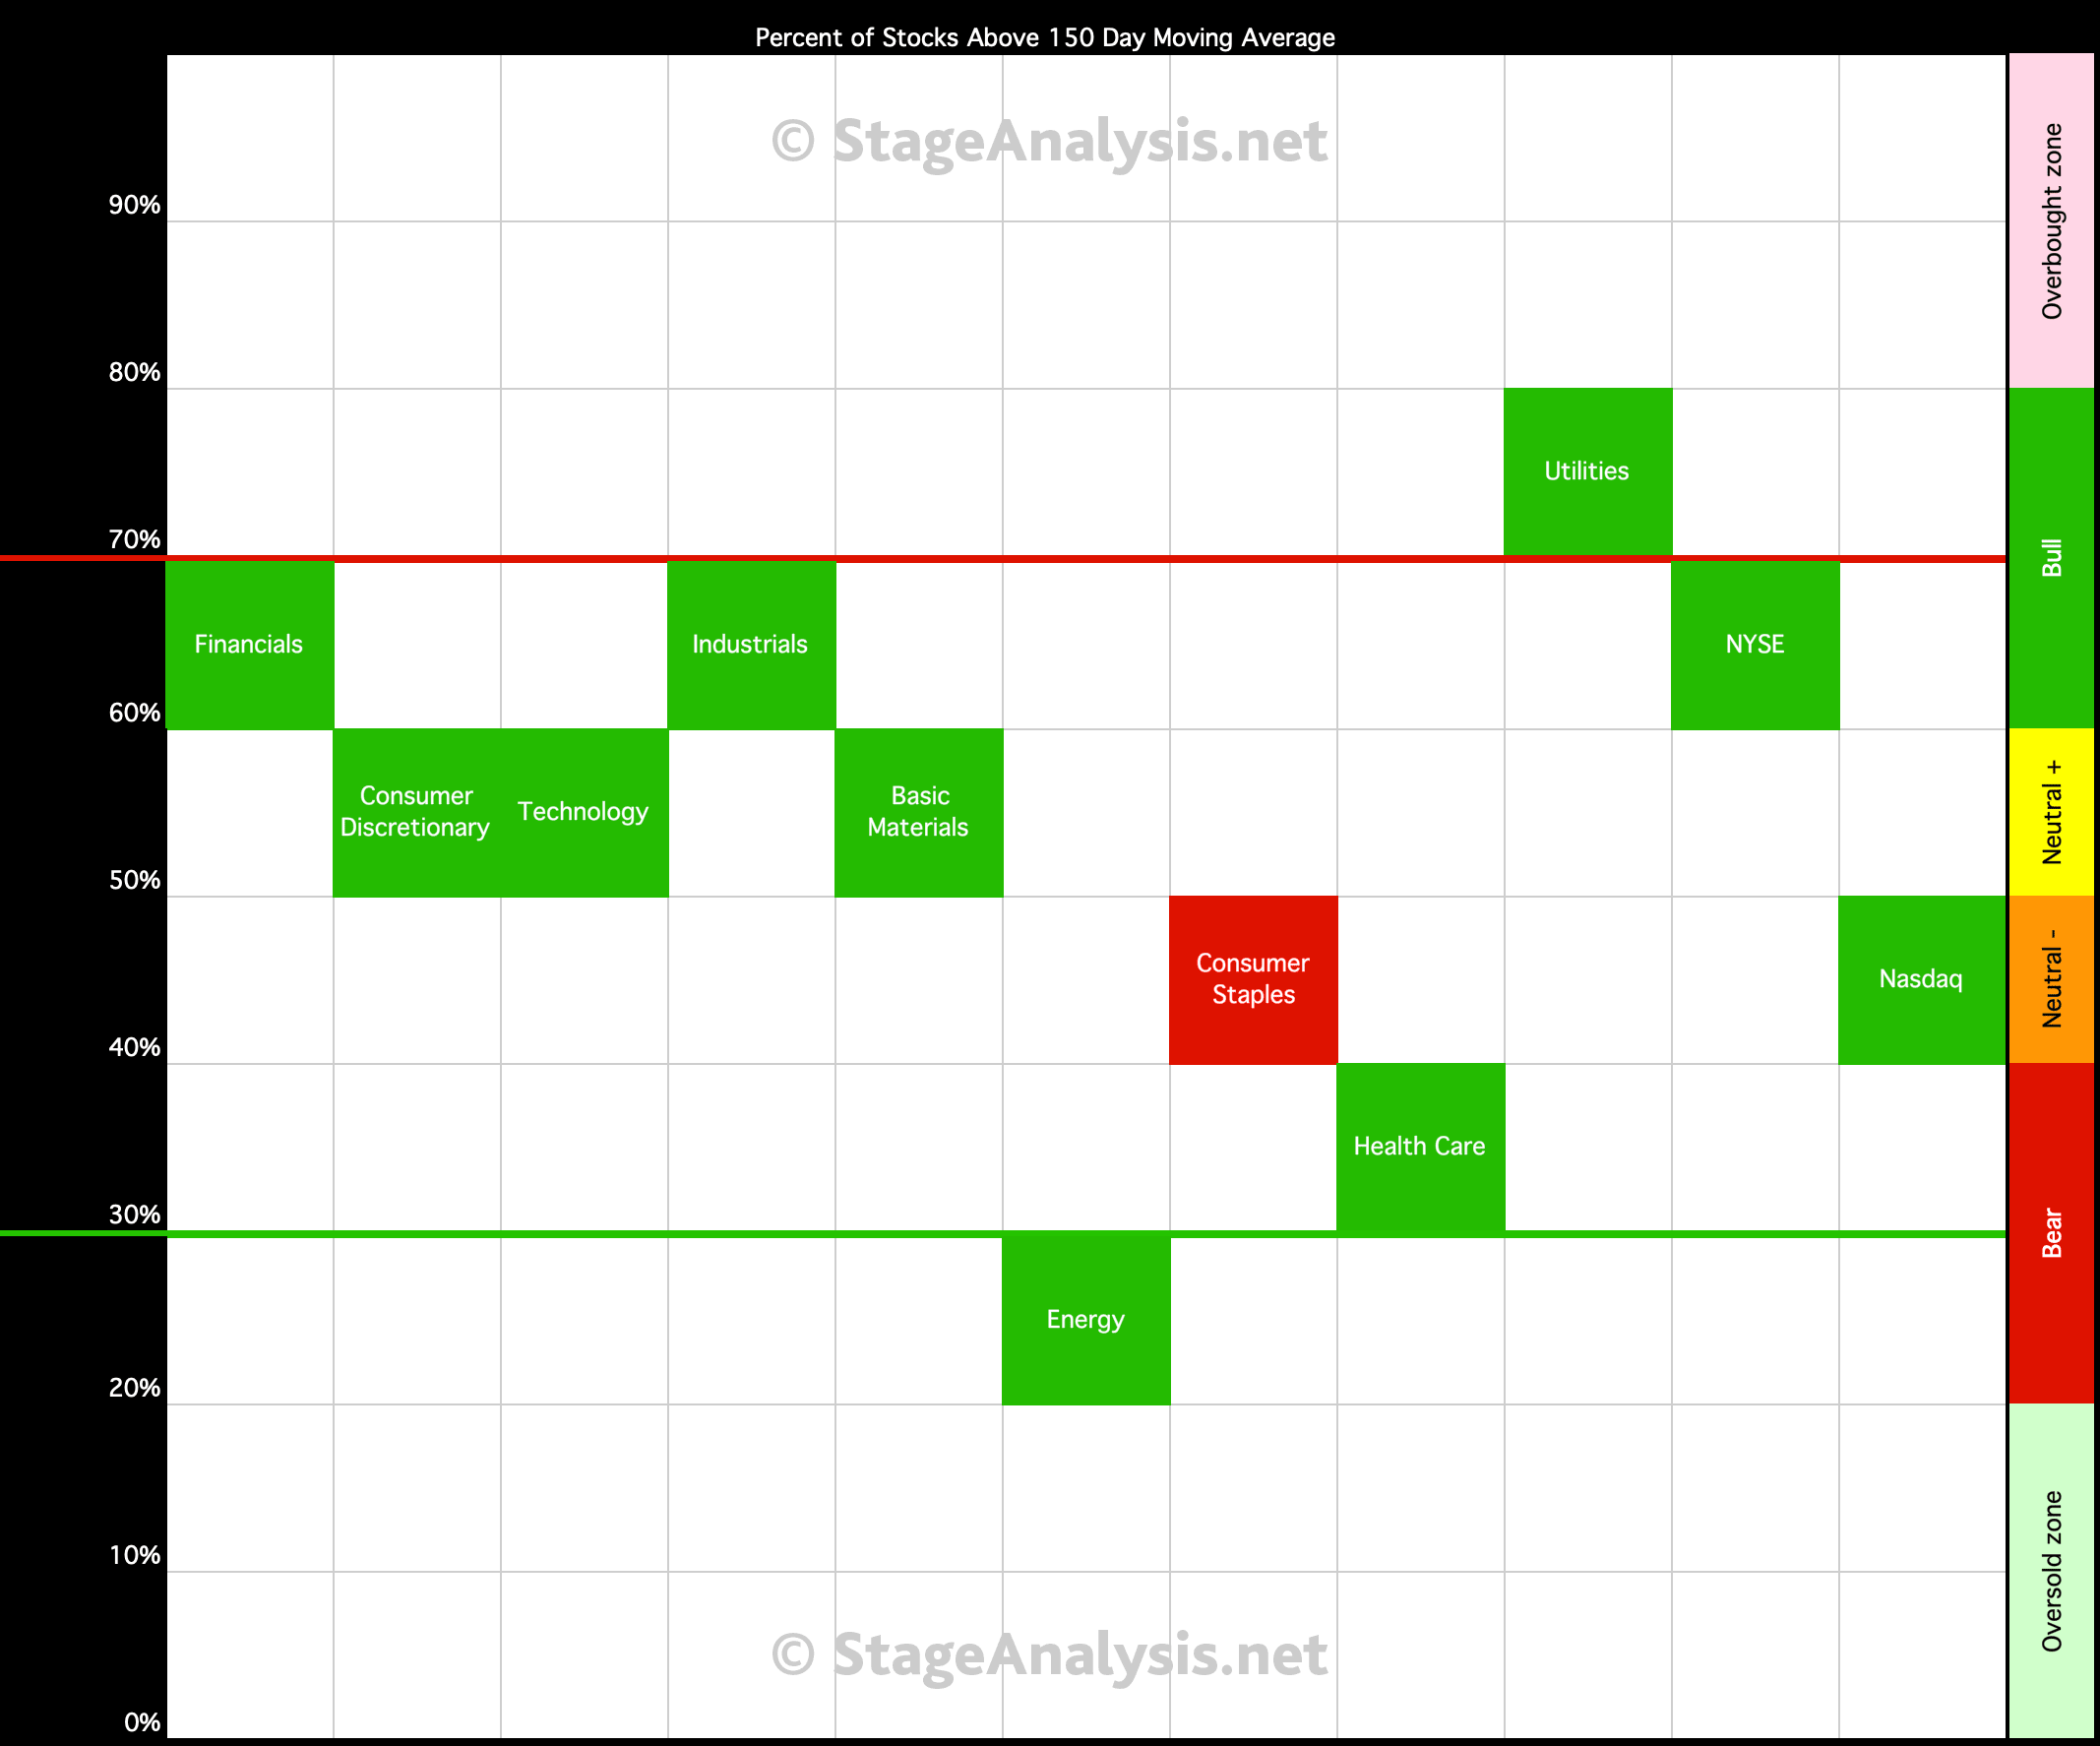
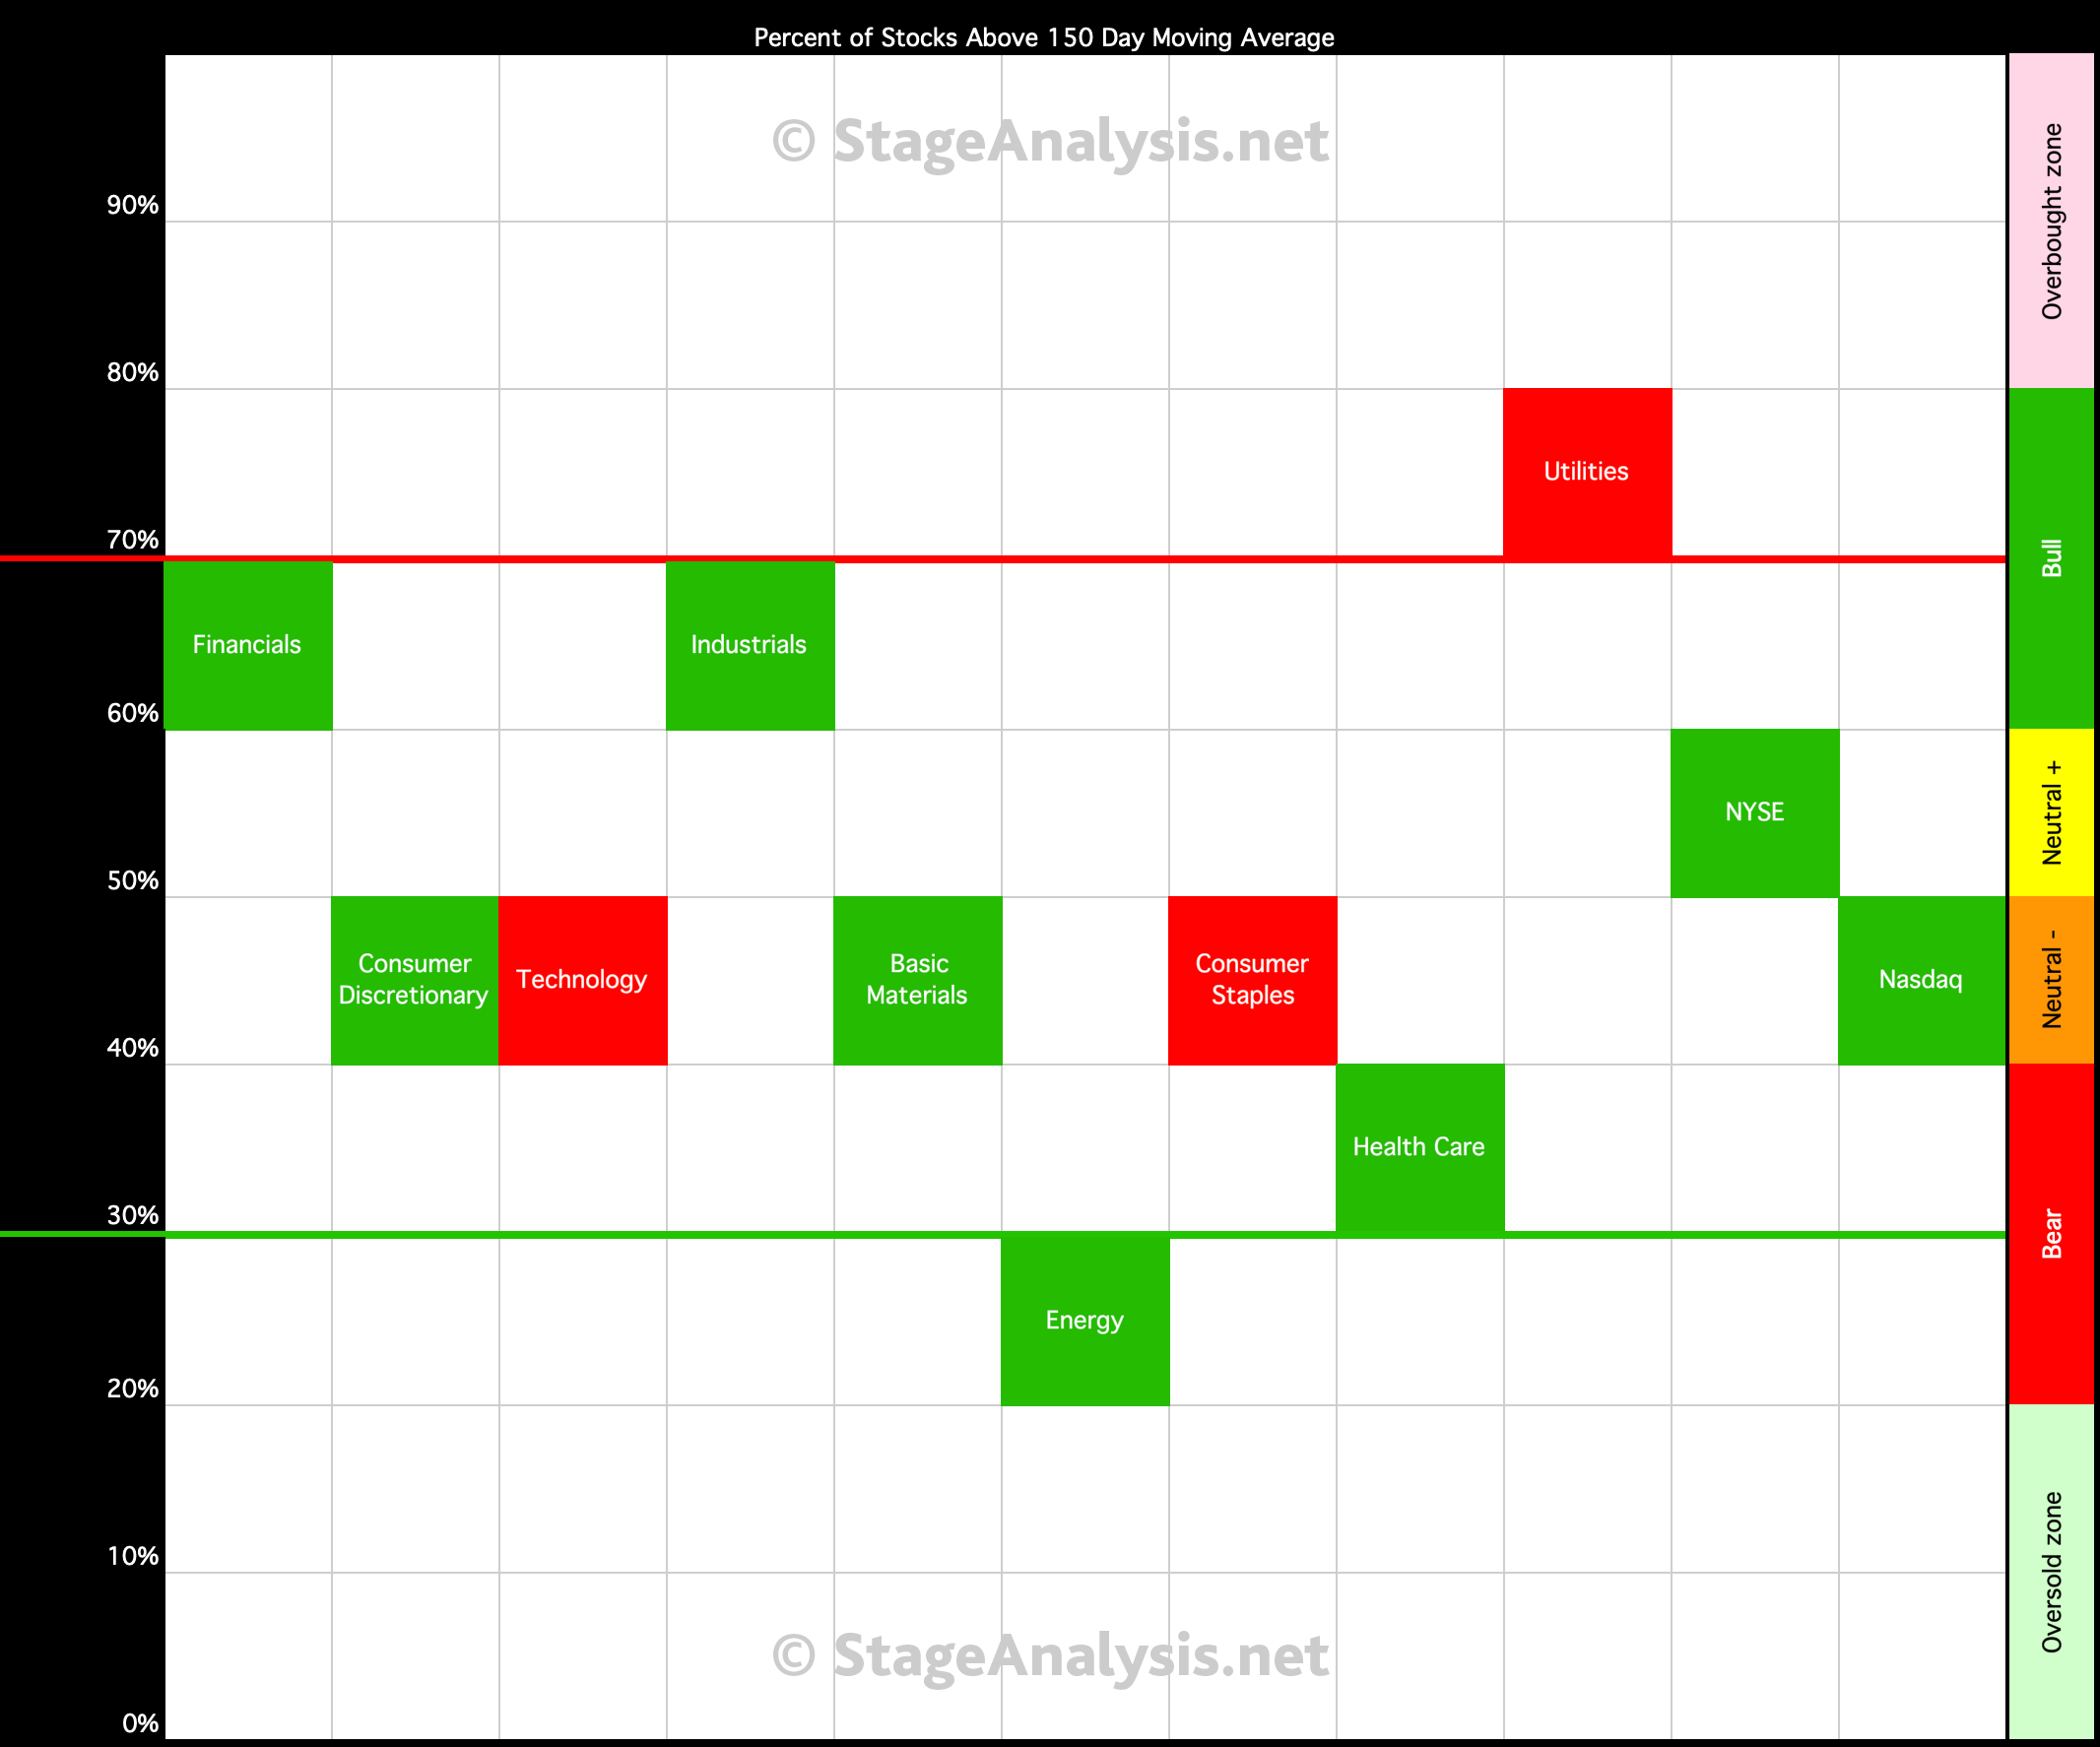
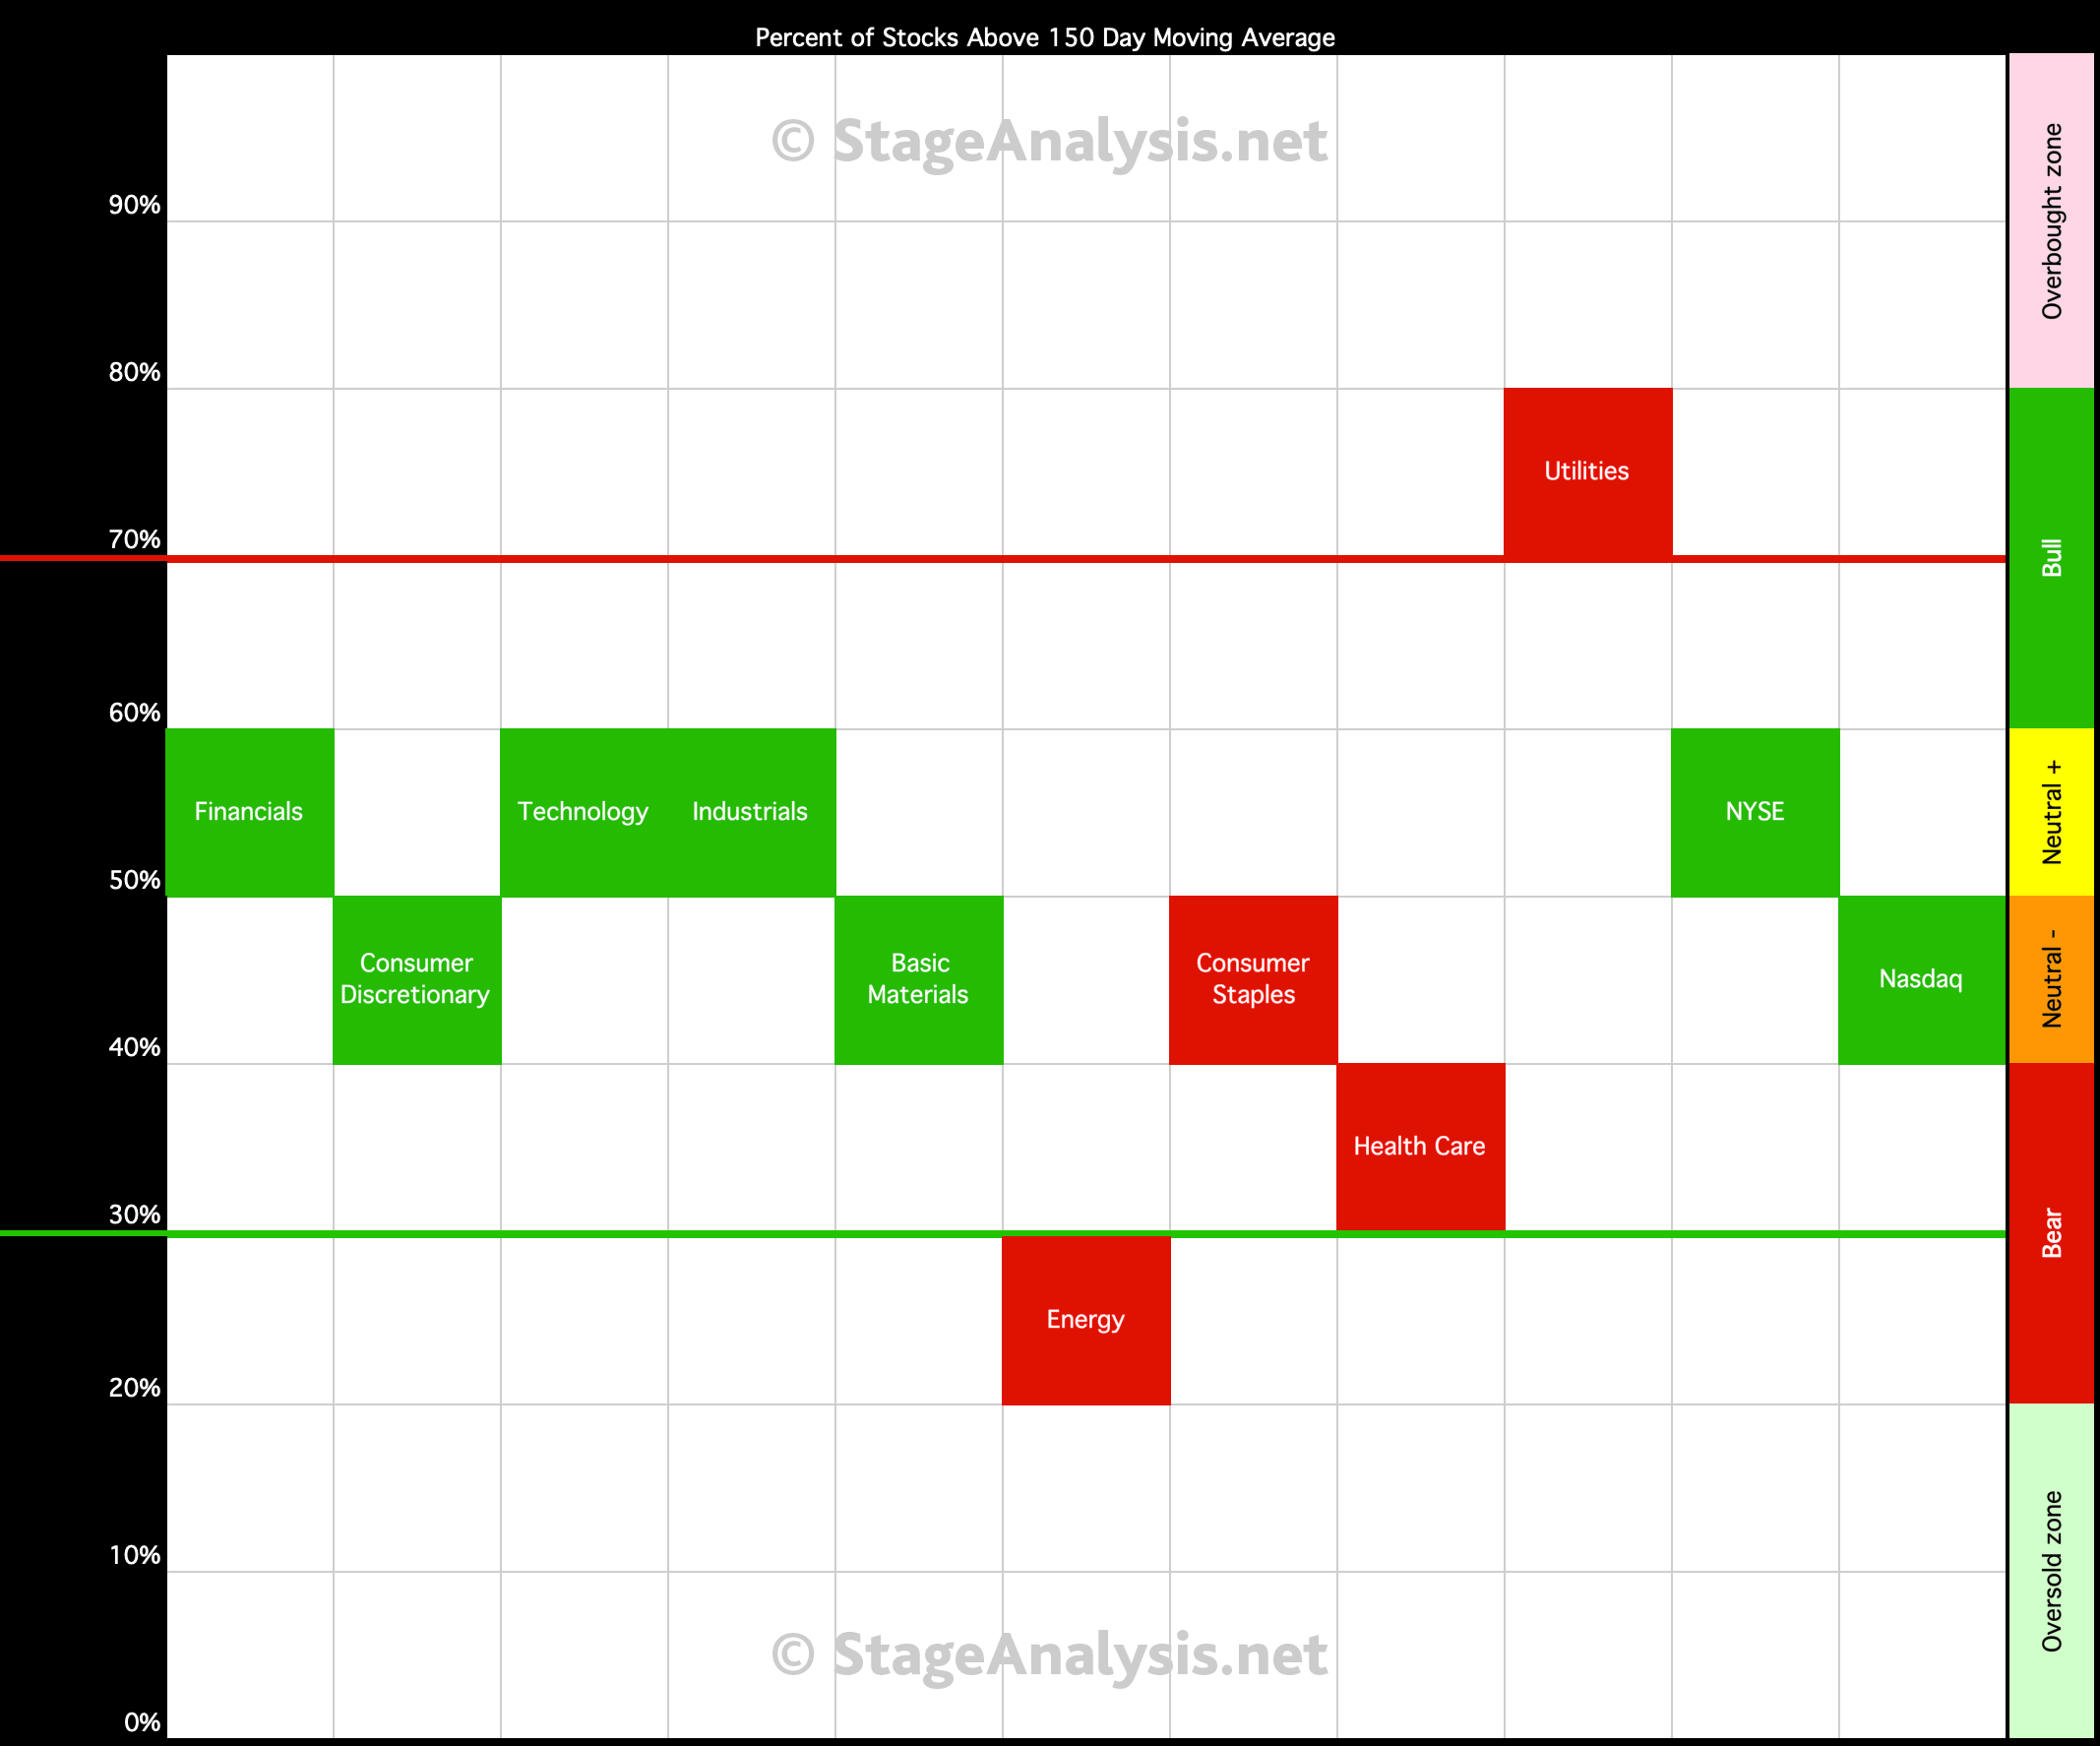
Percent of Stocks Above their 150 Day Moving Average table in each sector, which is ordered by overall health.
Read More
Blog
15 December, 2019
US Sectors - Percent of Stocks Above their 150 Day Moving Average
08 December, 2019
US Sectors - Percent of Stocks Above their 150 Day Moving Average
Percent of Stocks Above their 150 Day Moving Average table in each sector, which is ordered by overall health.
Read More
01 December, 2019
US Sectors - Percent of Stocks Above their 150 Day Moving Average
Percent of Stocks Above their 150 Day Moving Average table in each sector, which is ordered by overall health.
Read More
24 November, 2019
US Sectors - Percent of Stocks Above their 150 Day Moving Average
Percent of Stocks Above their 150 Day Moving Average table in each sector, which is ordered by overall health.
Read More
17 November, 2019
US Sectors - Percent of Stocks Above their 150 Day Moving Average
Percent of Stocks Above their 150 Day Moving Average table in each sector, which is ordered by overall health.
Read More
10 November, 2019
US Sectors - Percent of Stocks Above their 150 Day Moving Average
Percent of Stocks Above their 150 Day Moving Average table in each sector, which is ordered by overall health.
Read More
03 November, 2019
US Sectors - Percent of Stocks Above their 150 Day Moving Average
Percent of Stocks Above their 150 Day Moving Average table in each sector, which is ordered by overall health.
Read More
27 October, 2019
US Sectors - Percent of Stocks Above their 150 Day Moving Average
Percent of Stocks Above their 150 Day Moving Average table in each sector, which is ordered by overall health.
Read More
20 October, 2019
US Sectors - Percent of Stocks Above their 150 Day Moving Average
Percent of Stocks Above their 150 Day Moving Average table in each sector, which is ordered by overall health.
Read More
13 October, 2019
US Sectors - Percent of Stocks Above their 150 Day Moving Average
Percent of Stocks Above their 150 Day Moving Average table in each sector, which is ordered by overall health.
Read More

