Stage Analysis members weekend video with a discussion of the Significant Weekly Bars, new features discussion, the Sectors and Sub-industries Bell Curves, the US Watchlist Stocks in detail on multiple timeframes, the key Market Breadth Charts to determine the Weight of Evidence and the Major US Stock Market Indexes Update.
Read More

Blog
25 August, 2024
Stage Analysis Members Video – 25 August 2024 (1hr 3mins)
24 August, 2024
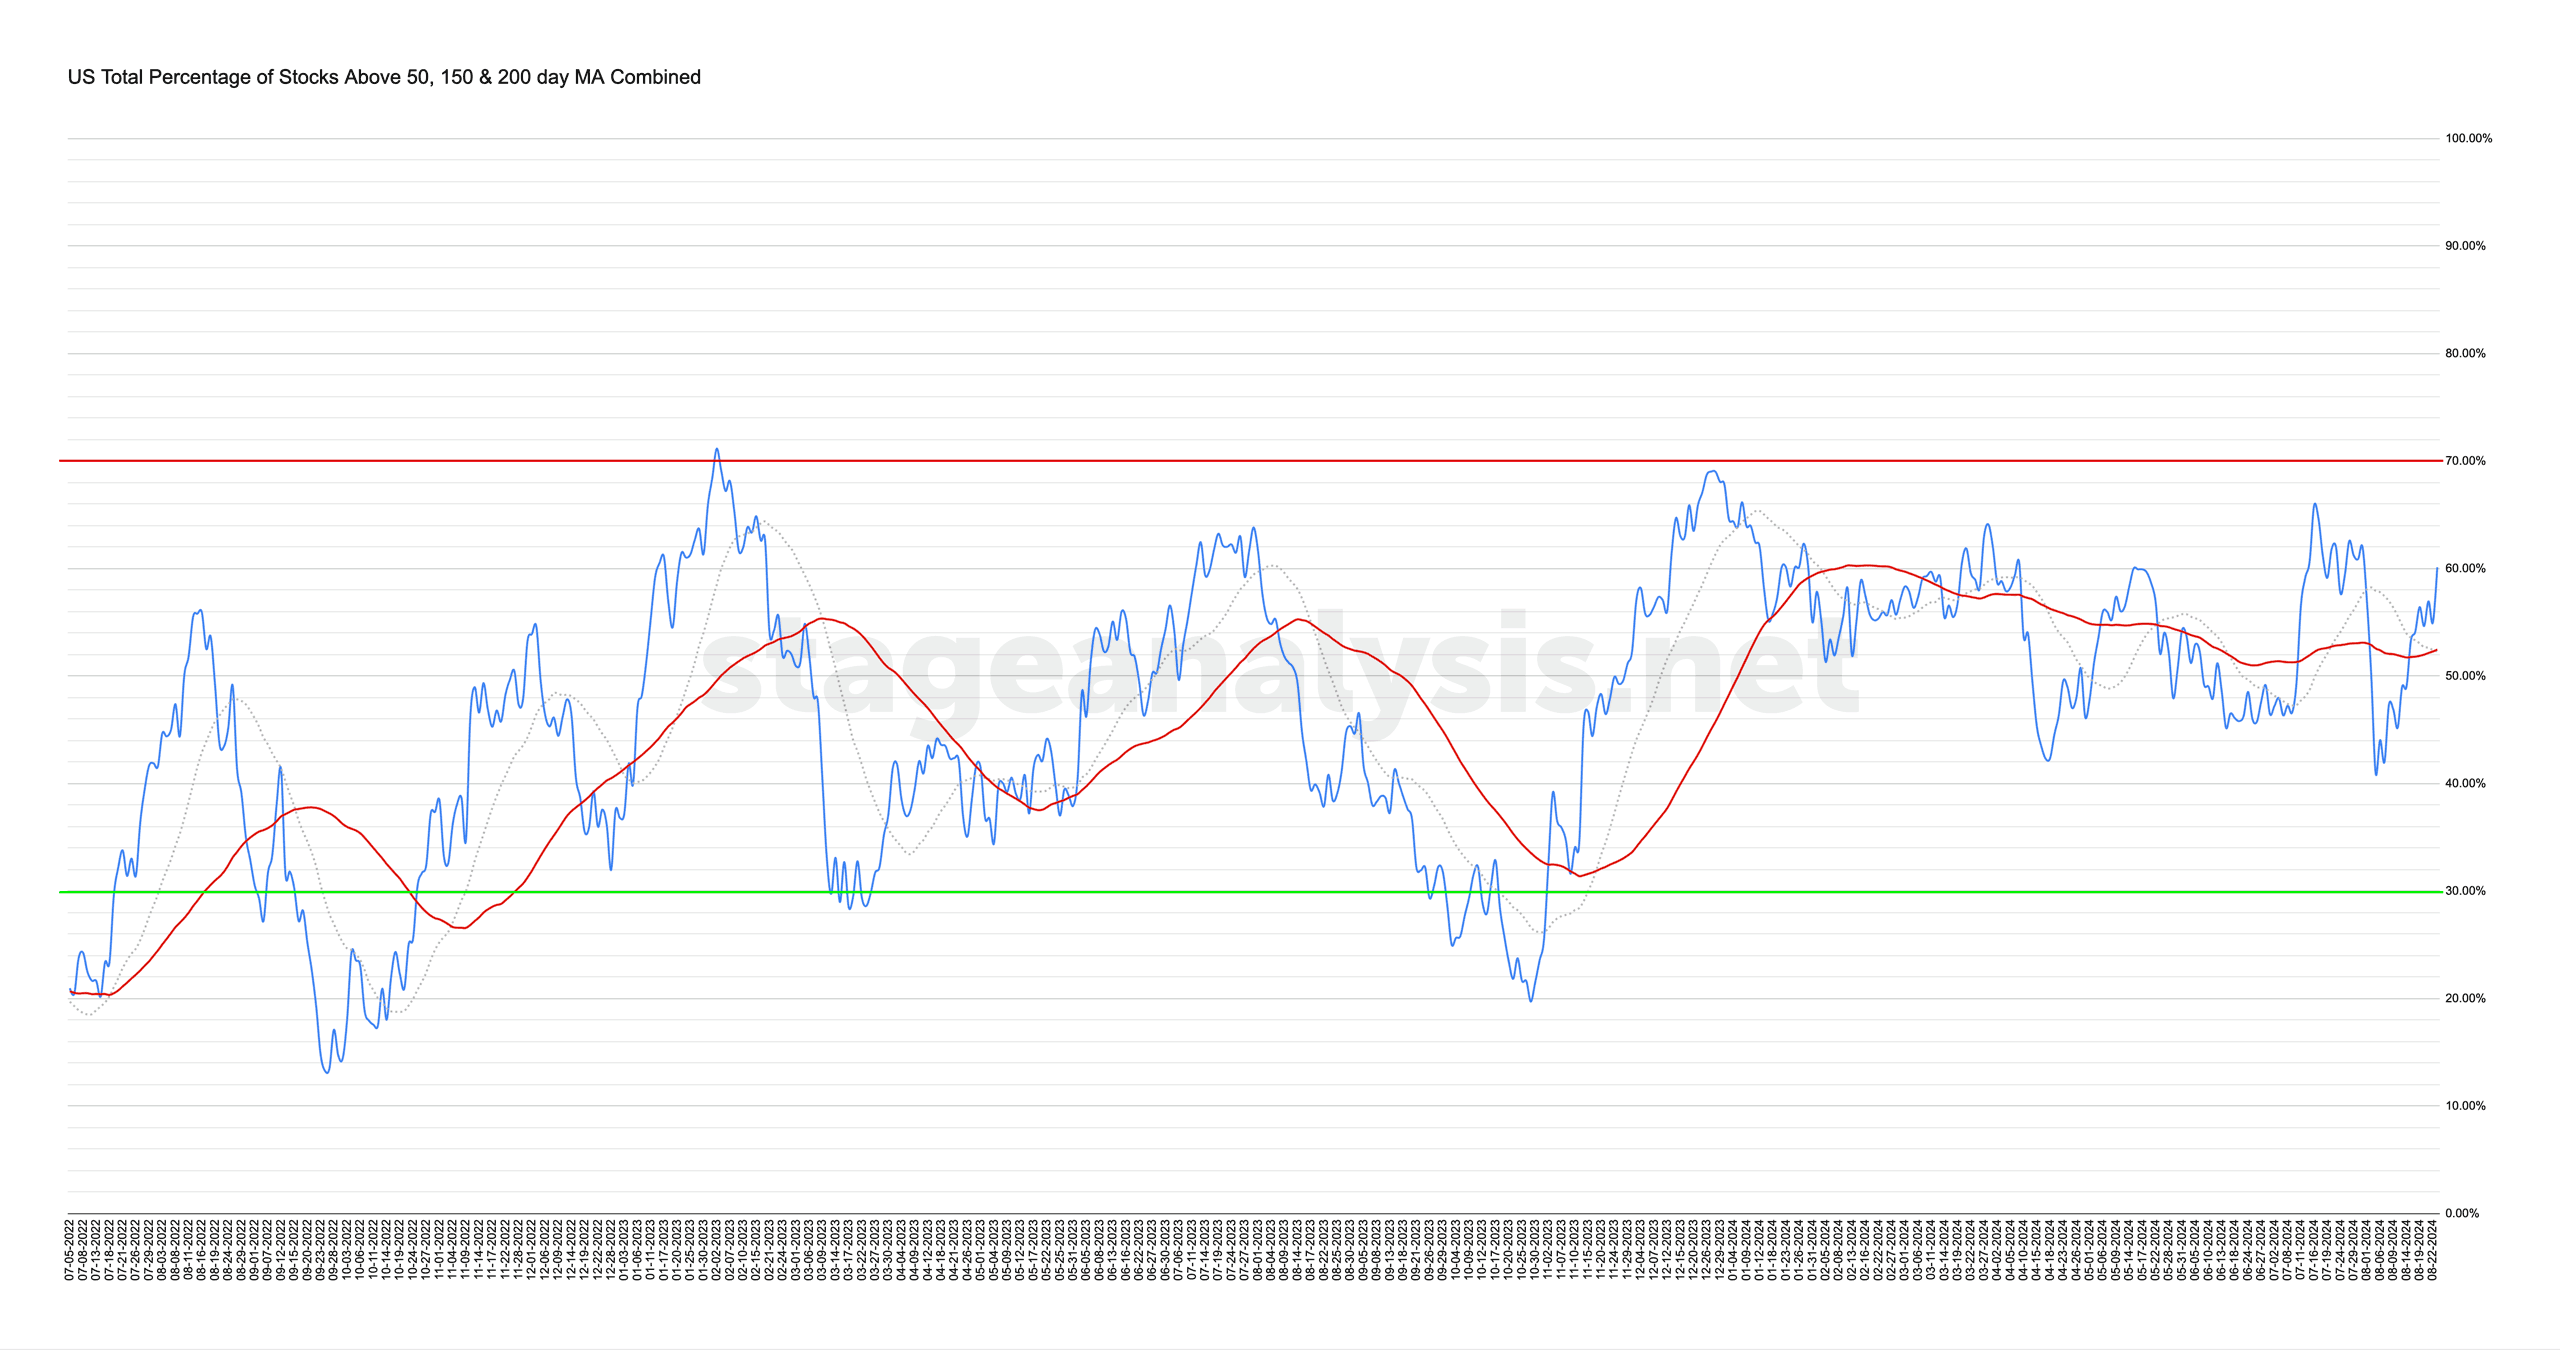
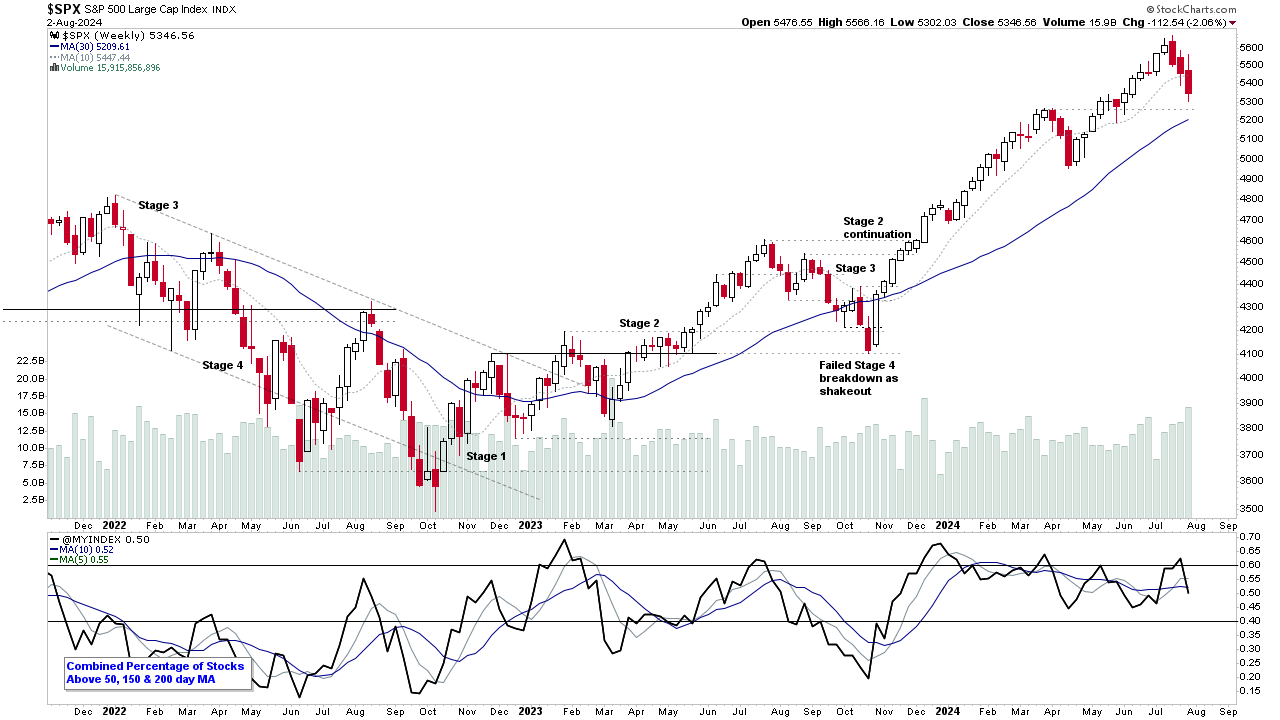
Market Breadth: Percentage of Stocks Above their 50 Day, 150 Day & 200 Day Moving Averages Combined
The US Total Percentage of Stocks above their 50 Day, 150 Day & 200 Day Moving Averages (shown above) increased by +6.00% this week. Therefore, the overall combined average is at 60.12% in the US market (NYSE and Nasdaq markets combined) above their short, medium and long term moving averages.
Read More
22 August, 2024
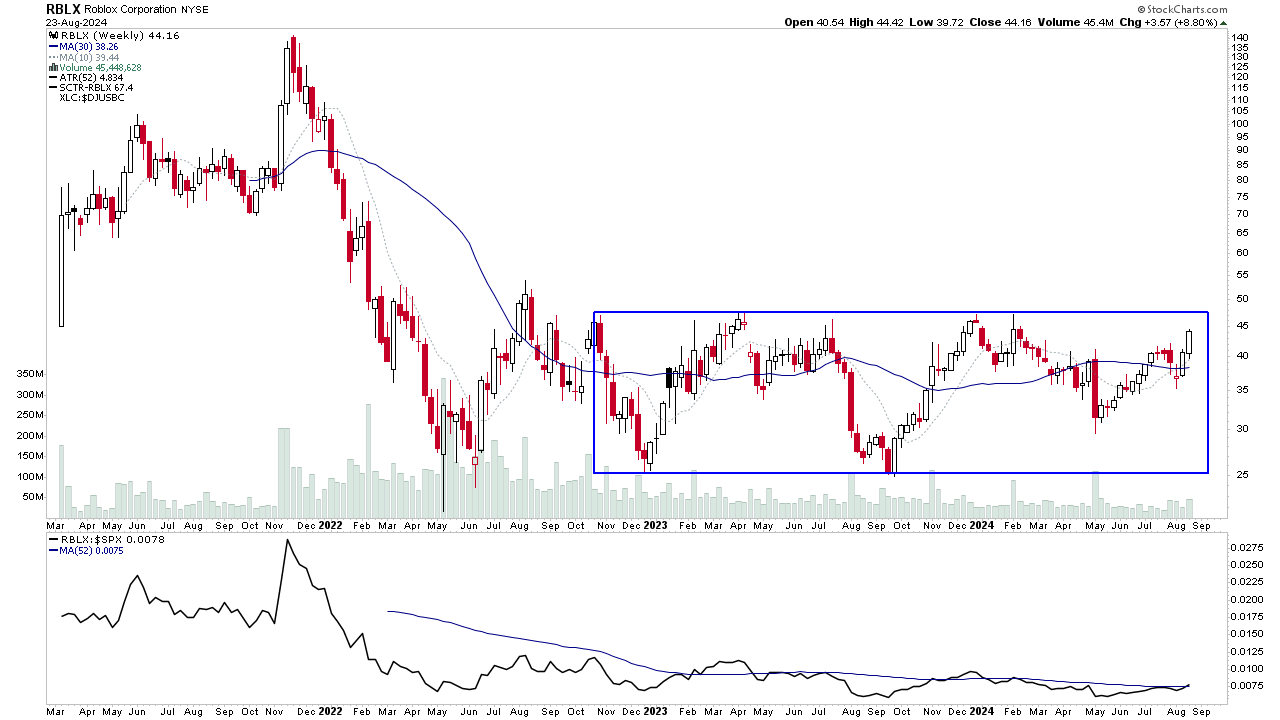
US Stocks Watchlist – 22 August 2024
There were 12 stocks highlighted from the US stocks watchlist scans today...
Read More

18 August, 2024
Stage Analysis Members Video – 18 August 2024 (48mins)
Stage Analysis members weekend video starting with a discussion of the Significant Weekly Bars, the US Watchlist Stocks in detail on multiple timeframes, the Sectors and Sub-industries Bell Curves, the key Market Breadth Charts to determine the Weight of Evidence and the Major US Stock Market Indexes Update.
Read More
17 August, 2024
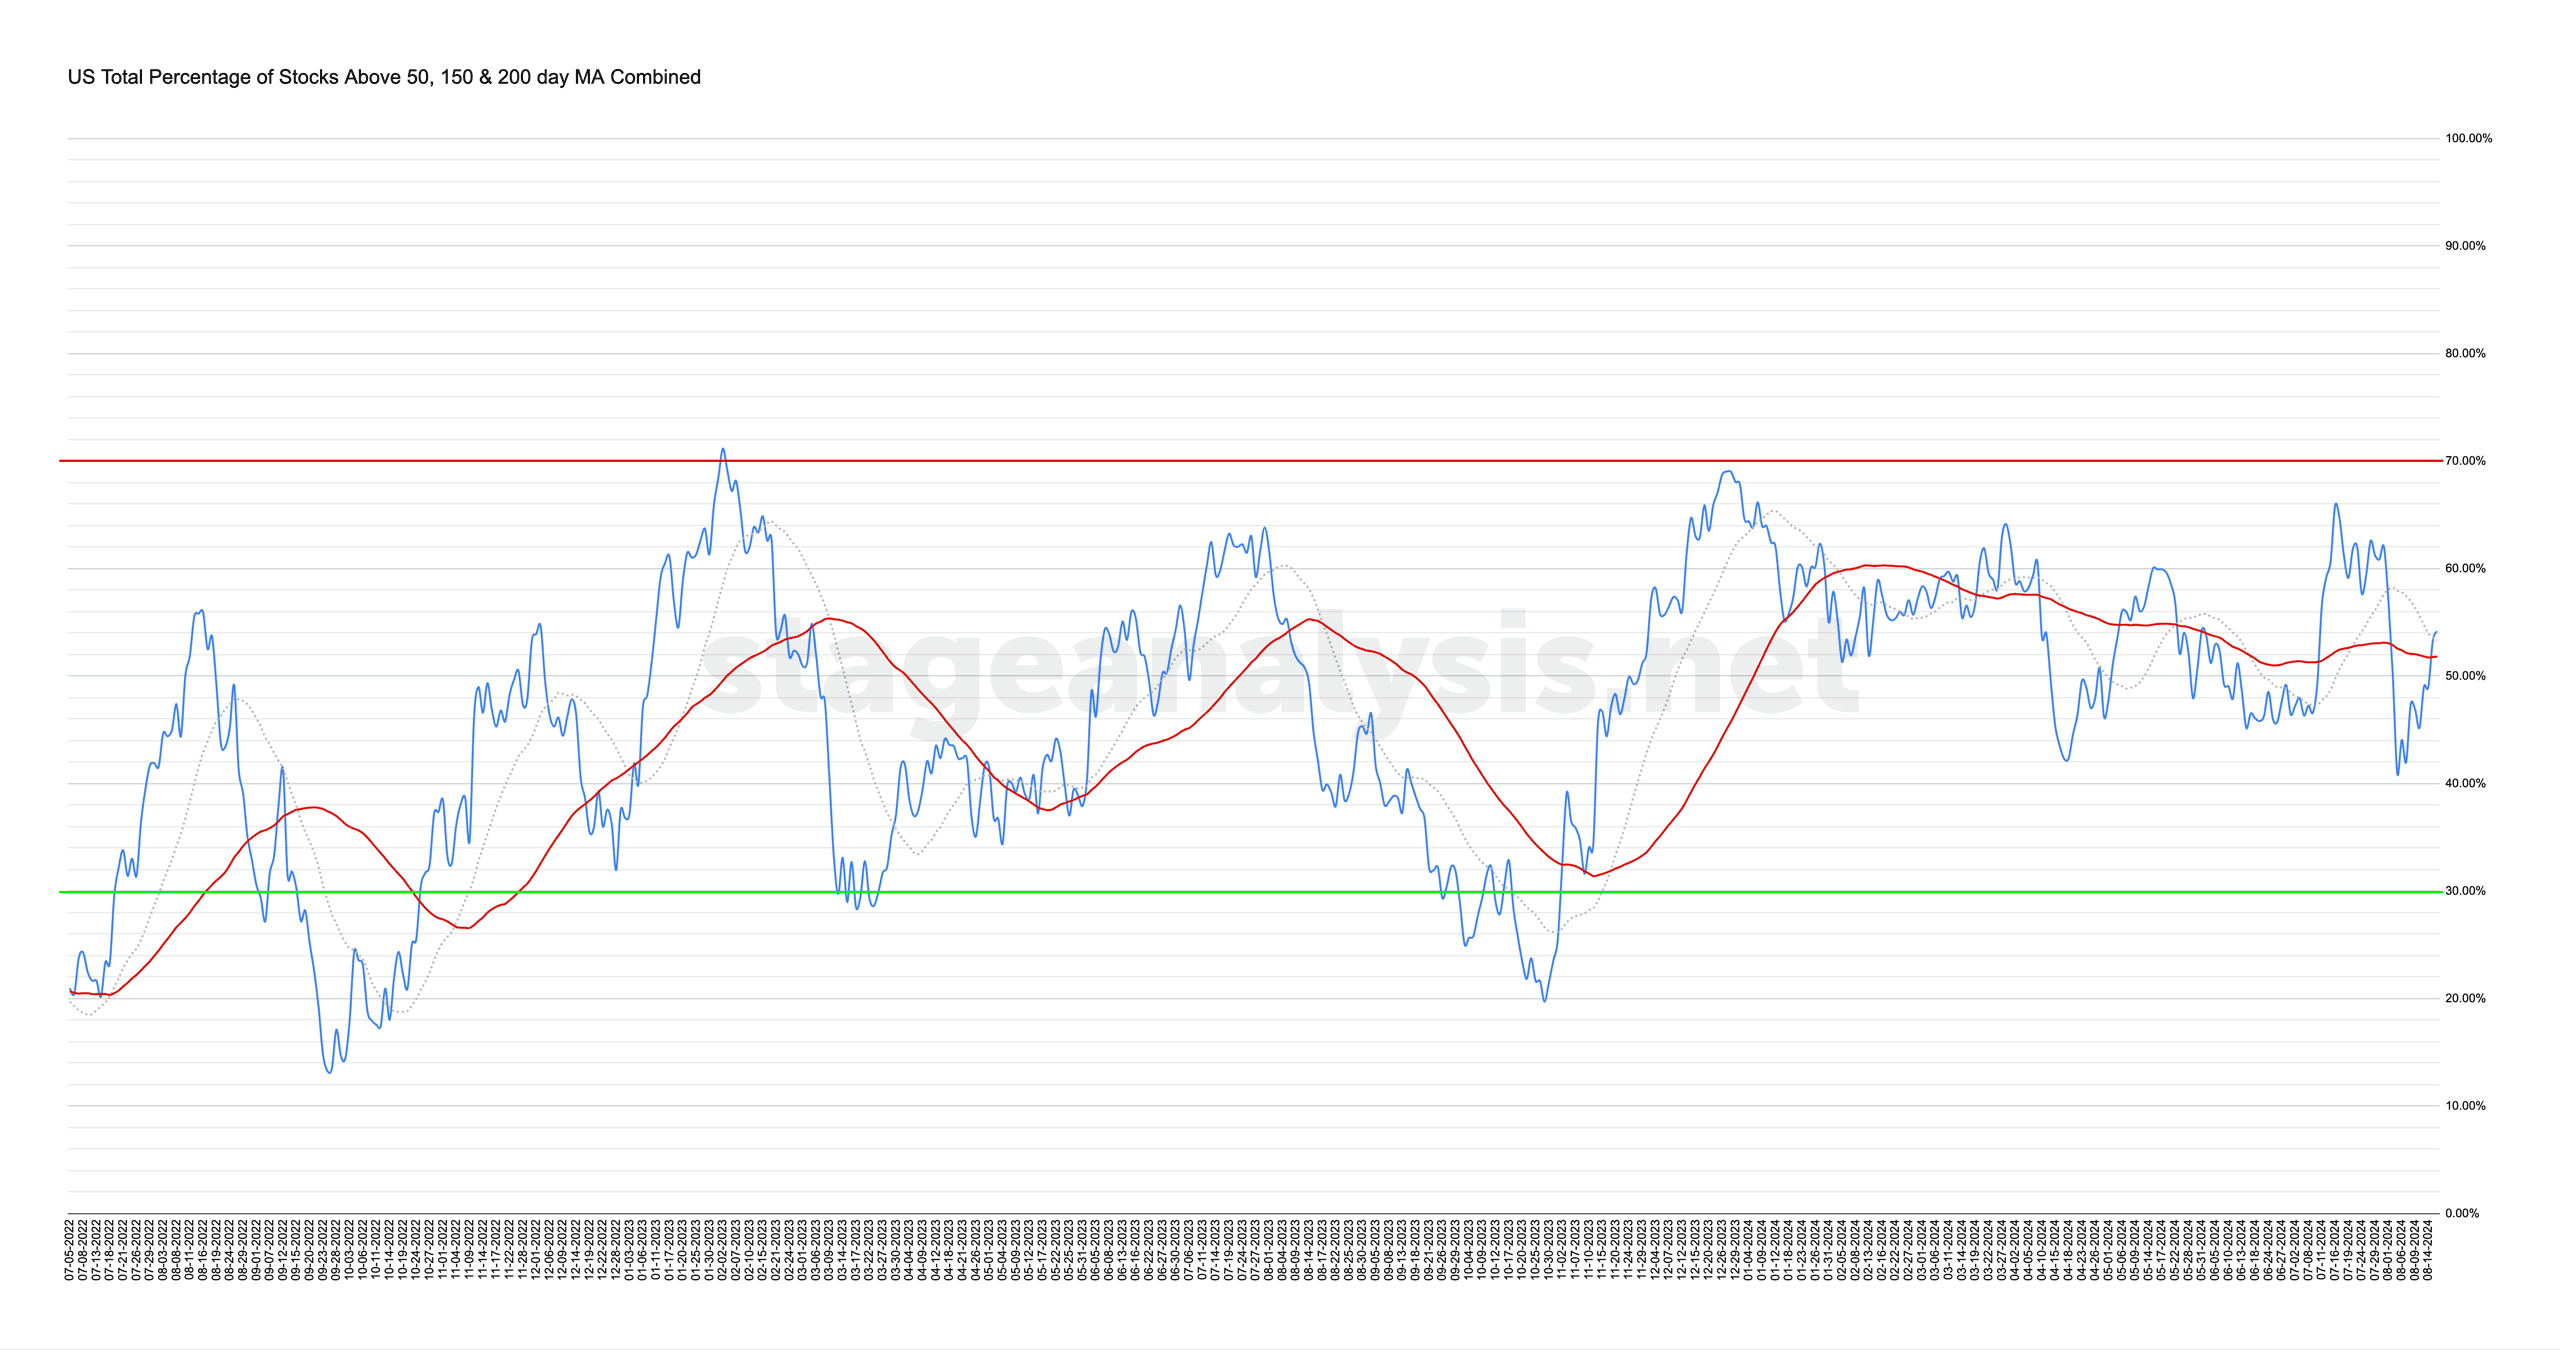
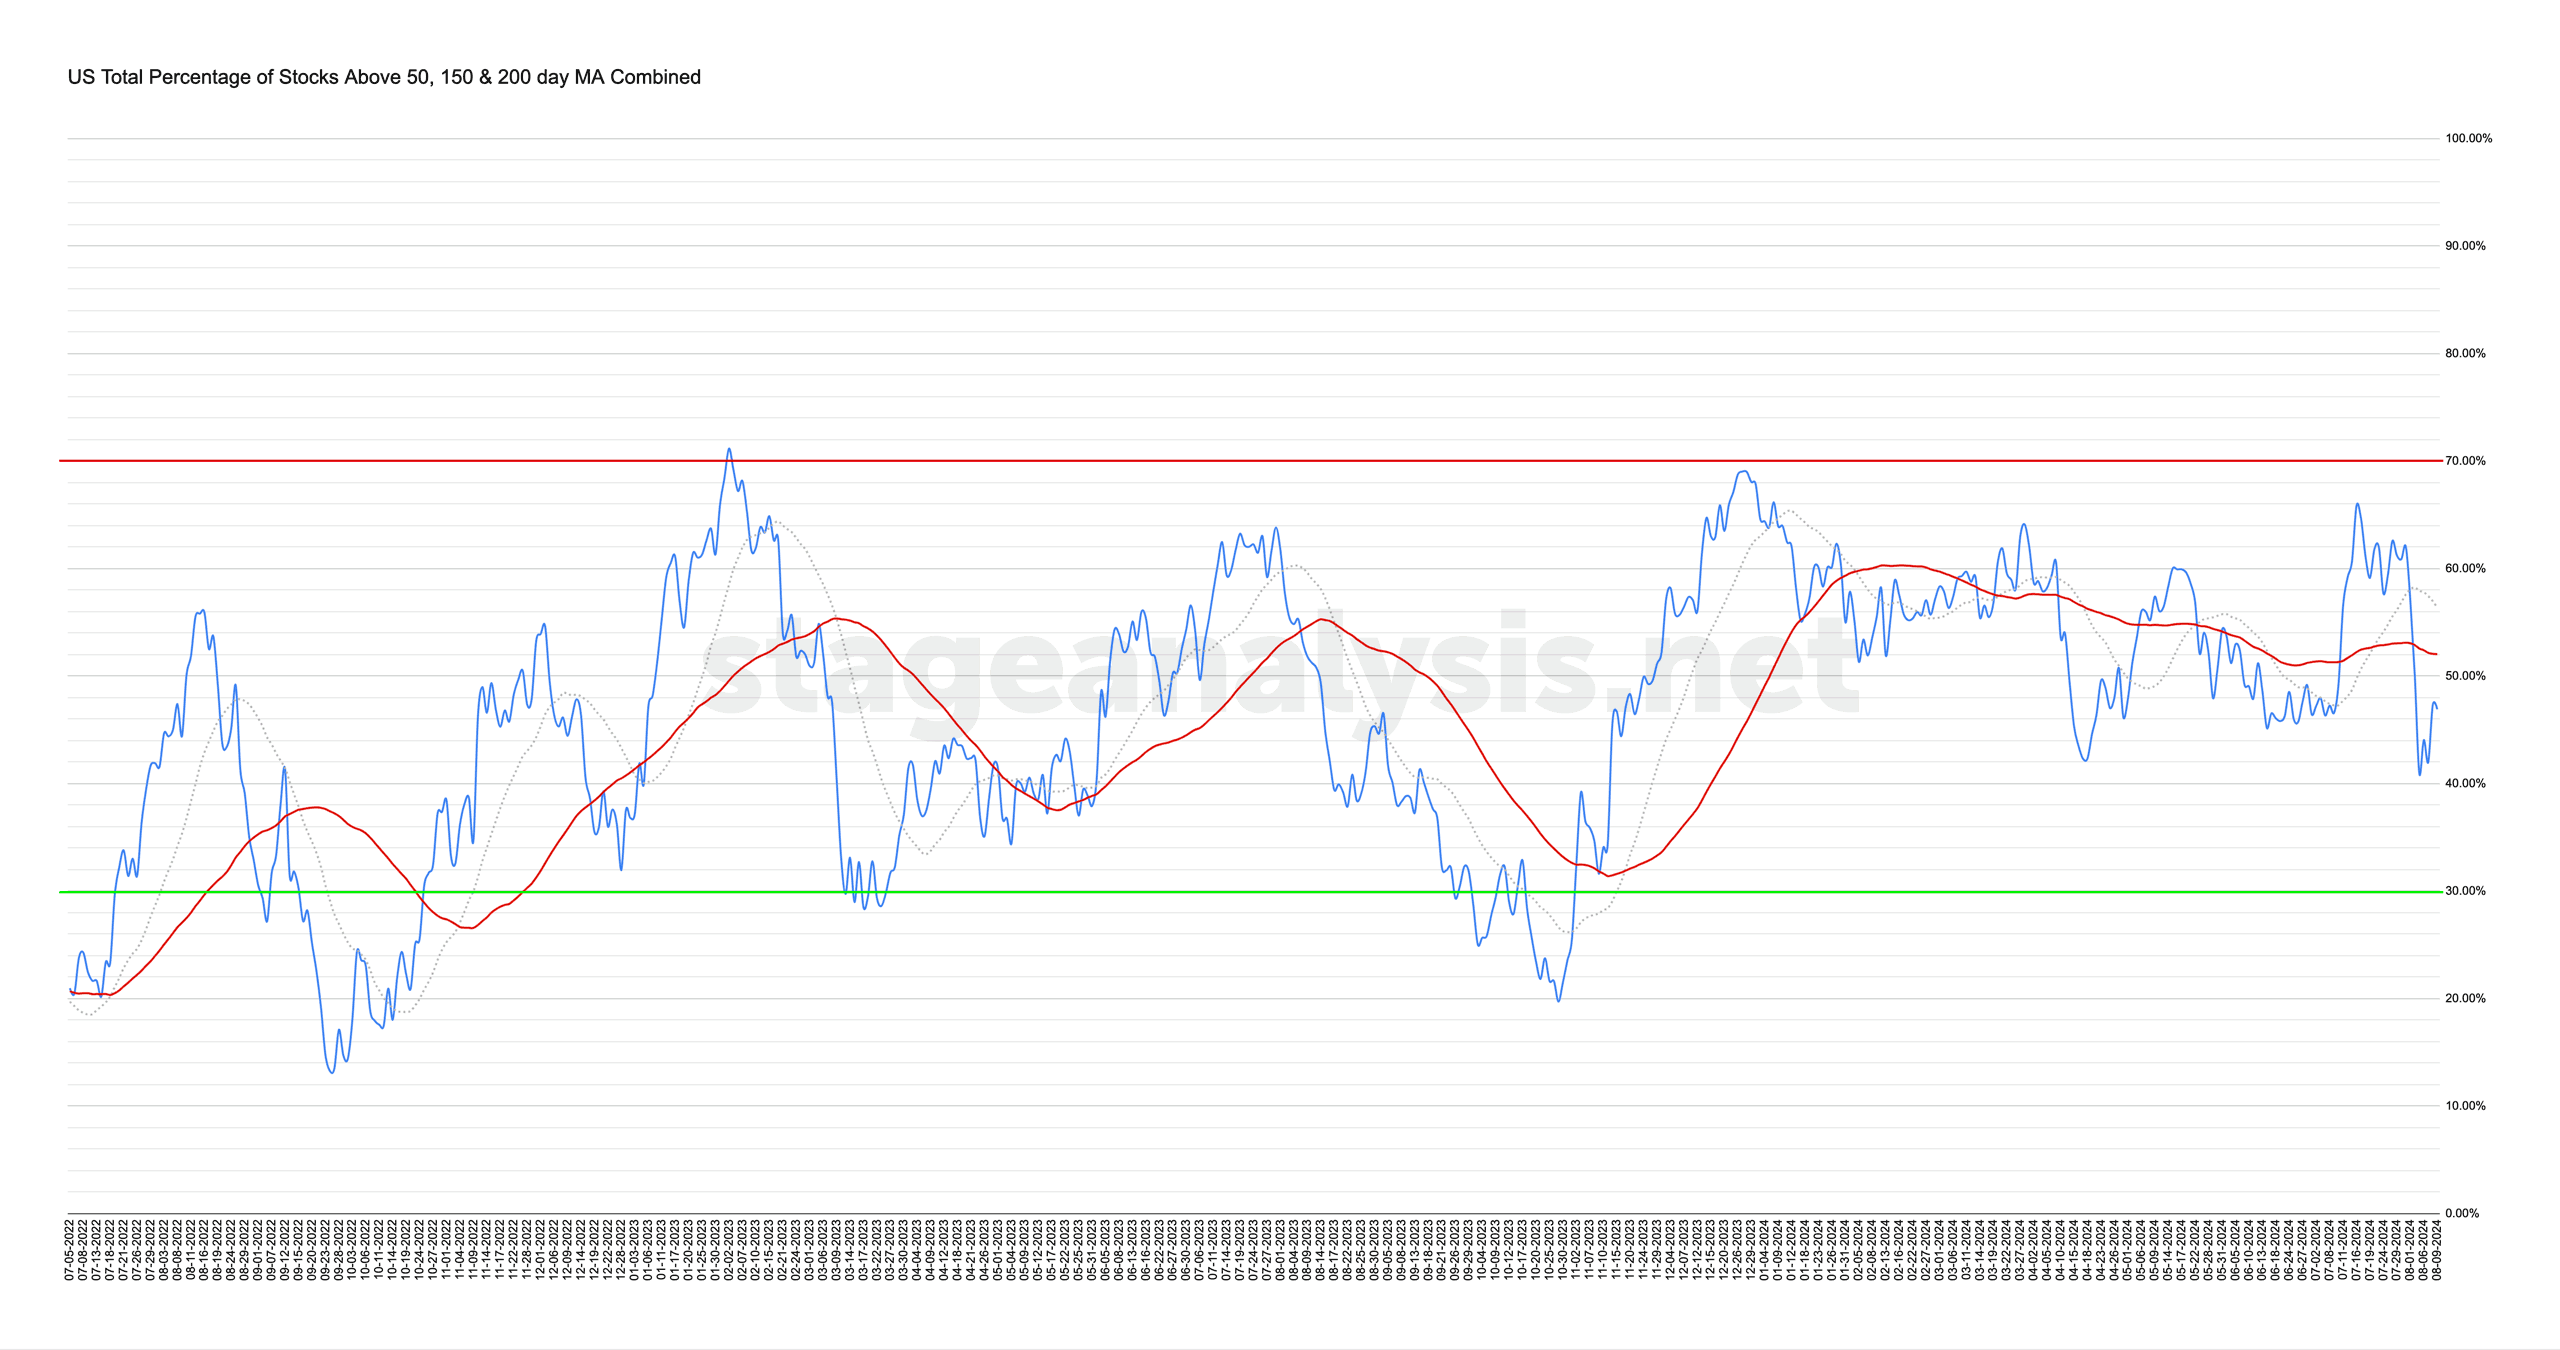
Market Breadth: Percentage of Stocks Above their 50 Day, 150 Day & 200 Day Moving Averages Combined
The US Total Percentage of Stocks above their 50 Day, 150 Day & 200 Day Moving Averages (shown above) increased by +7.22% this week. Therefore, the overall combined average is at 54.12% in the US market (NYSE and Nasdaq markets combined) above their short, medium and long term moving averages.
Read More
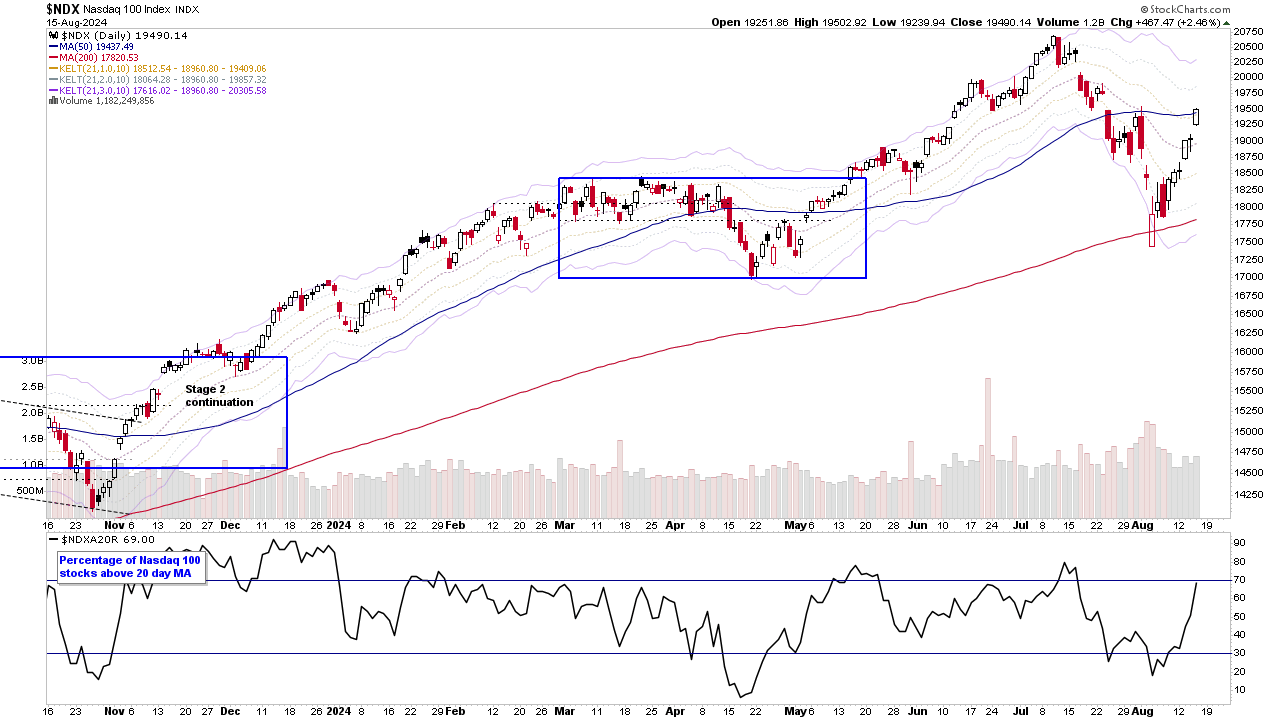
15 August, 2024
US Stocks Watchlist – 15 August 2024
There were 13 stocks highlighted from the US stocks watchlist scans today...
Read More
11 August, 2024
Stage Analysis Members Video – 11 August 2024 (58mins)
Stage Analysis members weekend video starting with a discussion of the Significant Weekly Bars, the Major US Stock Market Indexes, the Sectors and Sub-industries Bell Curves, the key Market Breadth Charts to determine the Weight of Evidence and the US Watchlist Stocks in detail on multiple timeframes
Read More
10 August, 2024
Market Breadth: Percentage of Stocks Above their 50 Day, 150 Day & 200 Day Moving Averages Combined
The US Total Percentage of Stocks above their 50 Day, 150 Day & 200 Day Moving Averages (shown above) decreased by -3.13% this week. Therefore, the overall combined average is at 46.90% in the US market (NYSE and Nasdaq markets combined) above their short, medium and long term moving averages.
Read More
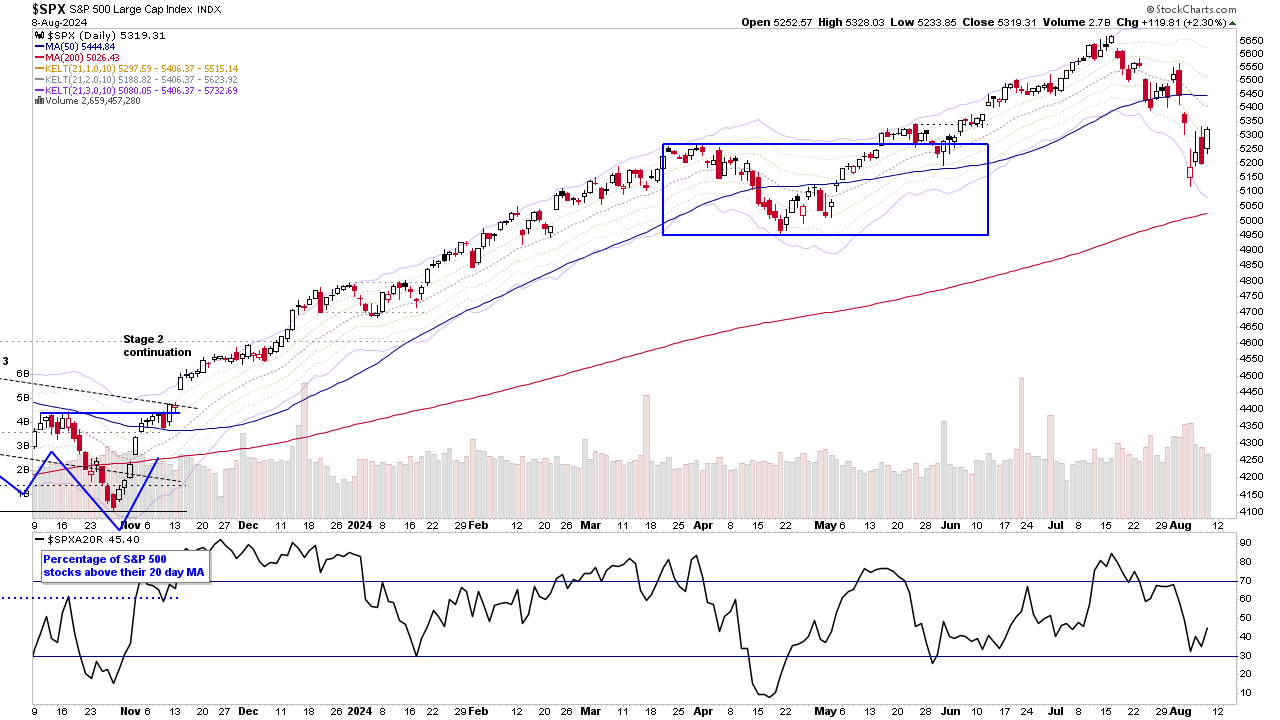
08 August, 2024
US Stocks Watchlist – 8 August 2024
The market continues to attempt to bounce on what the CAN SLIM method traders would call Day 3, and so tomorrow is where they start watching for a potential Follow Through Day (FTD), and so would need a further powerful rally day to achieve that...
Read More
04 August, 2024
Stage Analysis Members Video – 4 August 2024 (45mins)
Stage Analysis members weekend video starting with a discussion about the Stage 4 breakdown attempt in Ethereum. Followed by the Major US Stock Market Indexes, the Sector Breadth and Sub-industry Bell Curve, the key Market Breadth Charts to determine the Weight of Evidence and a look at some of the stocks with upcoming earnings this coming week.
Read More