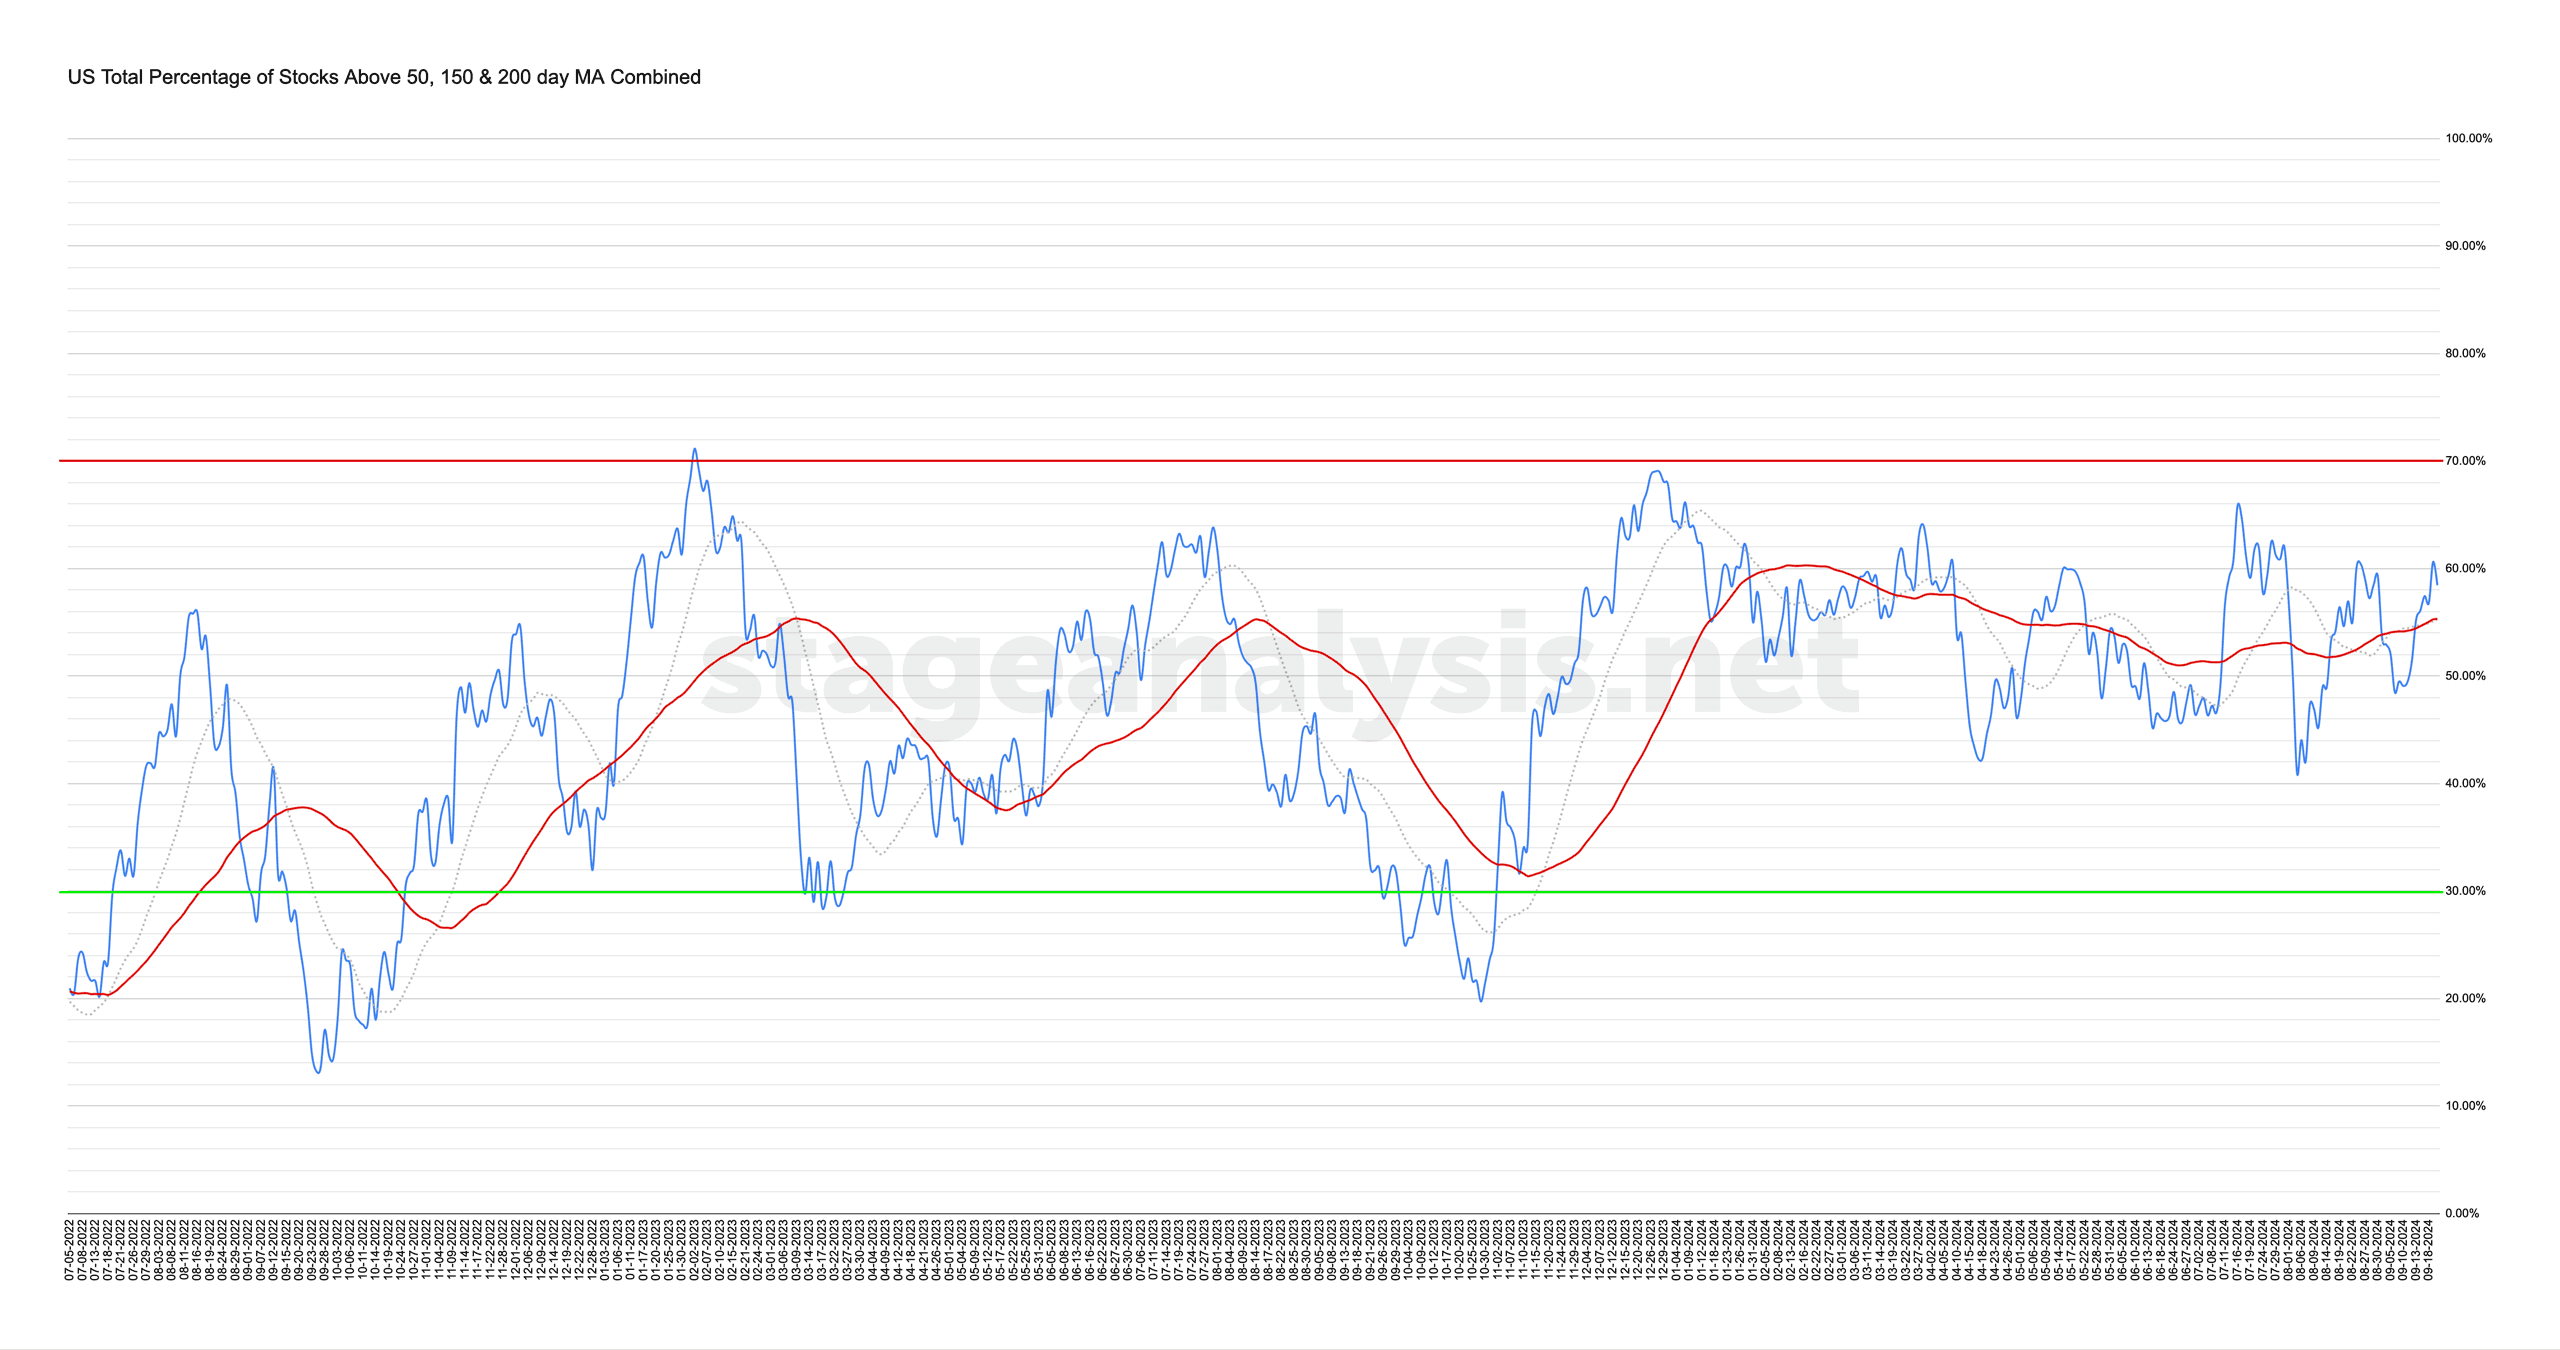
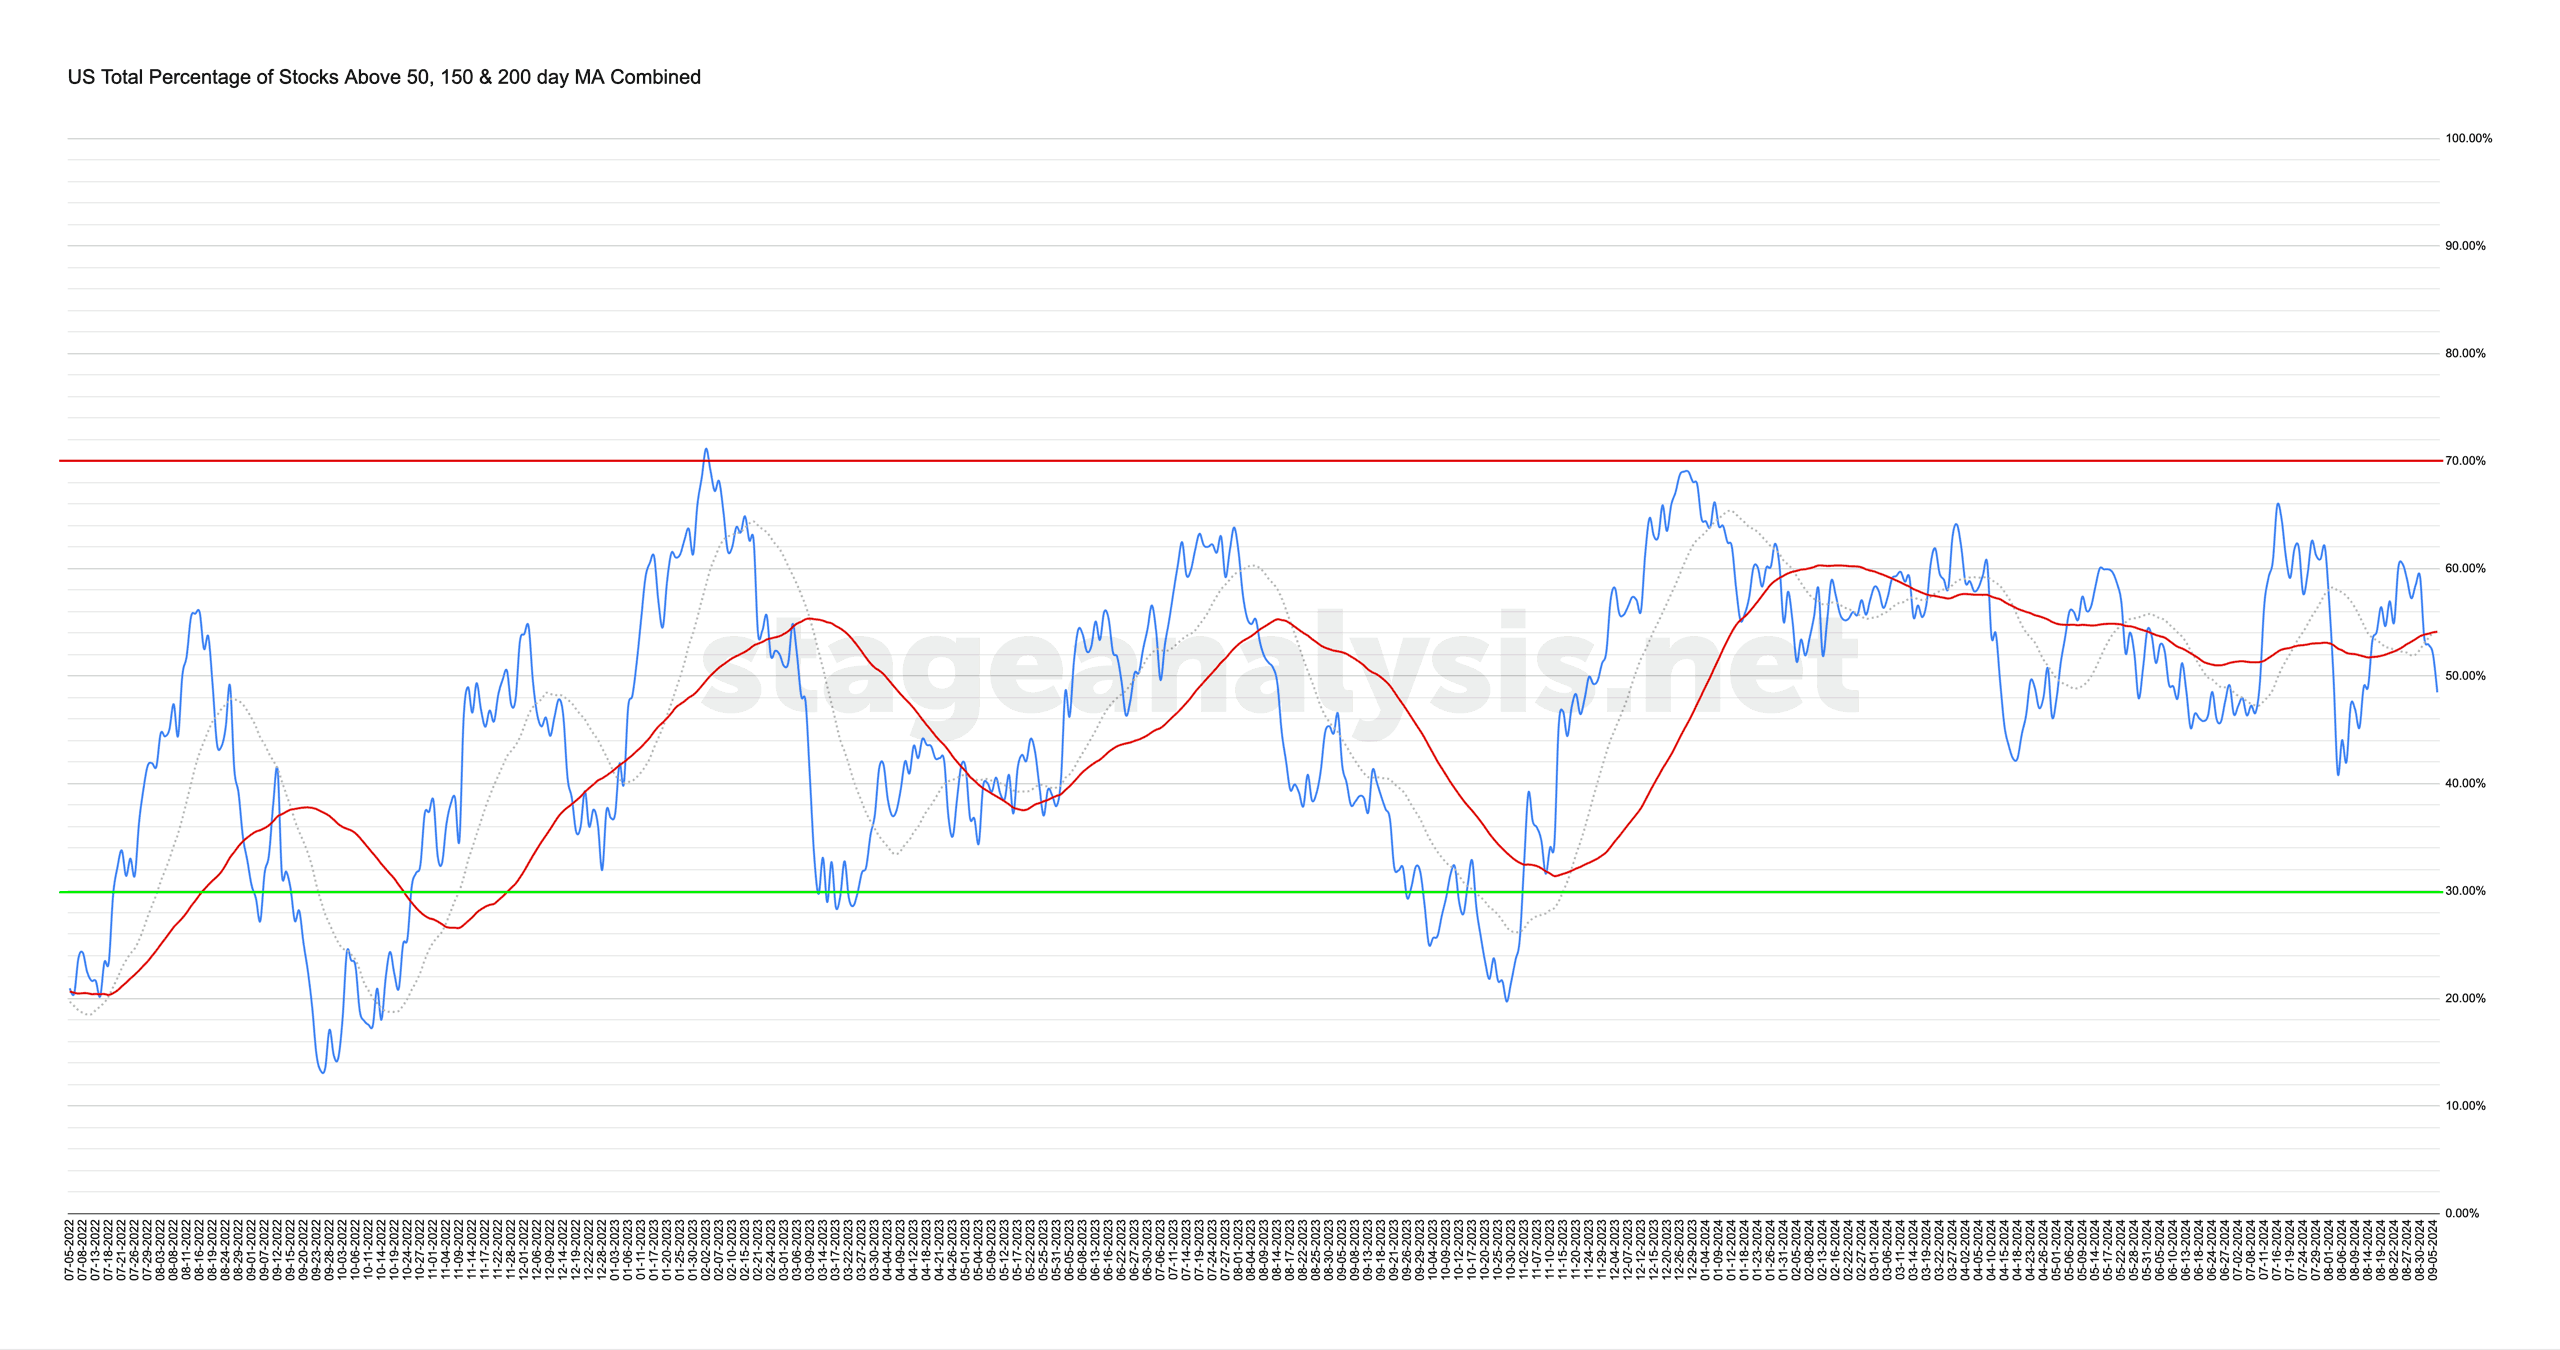
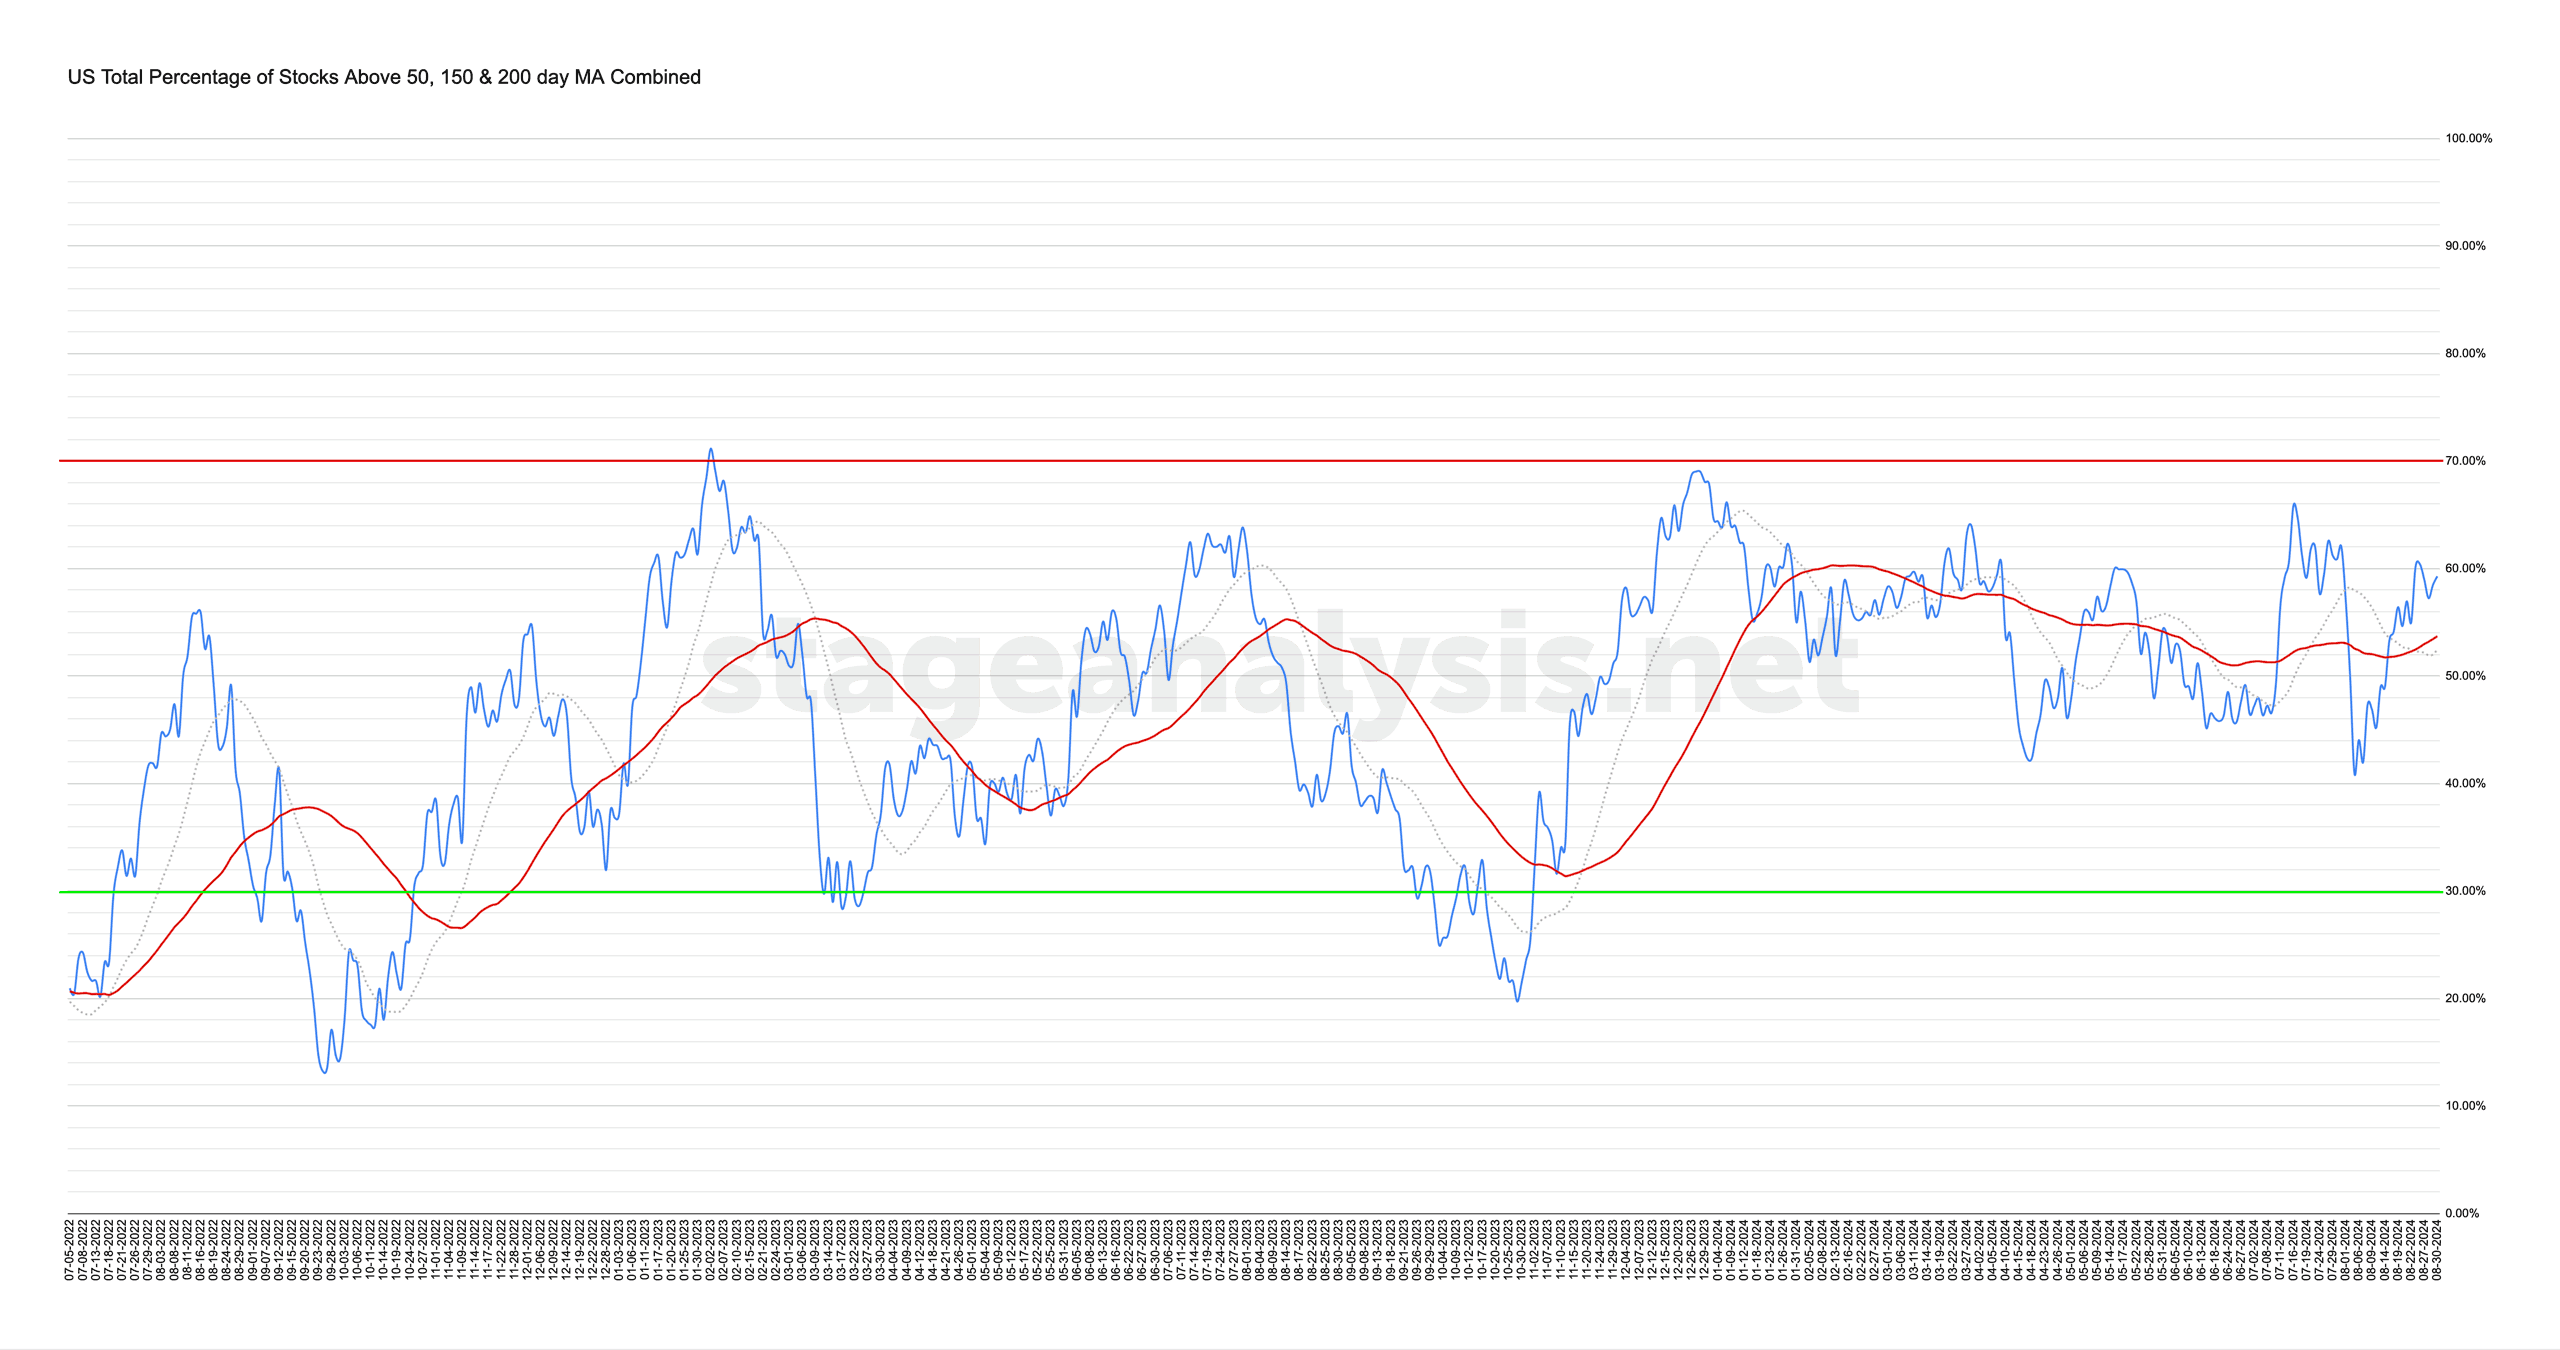
The US Total Percentage of Stocks above their 50 Day, 150 Day & 200 Day Moving Averages (shown above) increased by +3.21% this week. Therefore, the overall combined average is at 58.44% in the US market (NYSE and Nasdaq markets combined) above their short, medium and long term moving averages.
Read More

Blog
15 September, 2024
Stage Analysis Members Video – 15 September 2024 (54mins)
Stage Analysis members weekend video begins this week with a discussion of the US Watchlist Stocks in detail on multiple timeframes, the Significant Weekly Bars, the Sectors and Sub-industries Bell Curves and RS Rankings, the key Market Breadth Charts to determine the Weight of Evidence, and the Major US Stock Market Indexes Update.
Read More
14 September, 2024
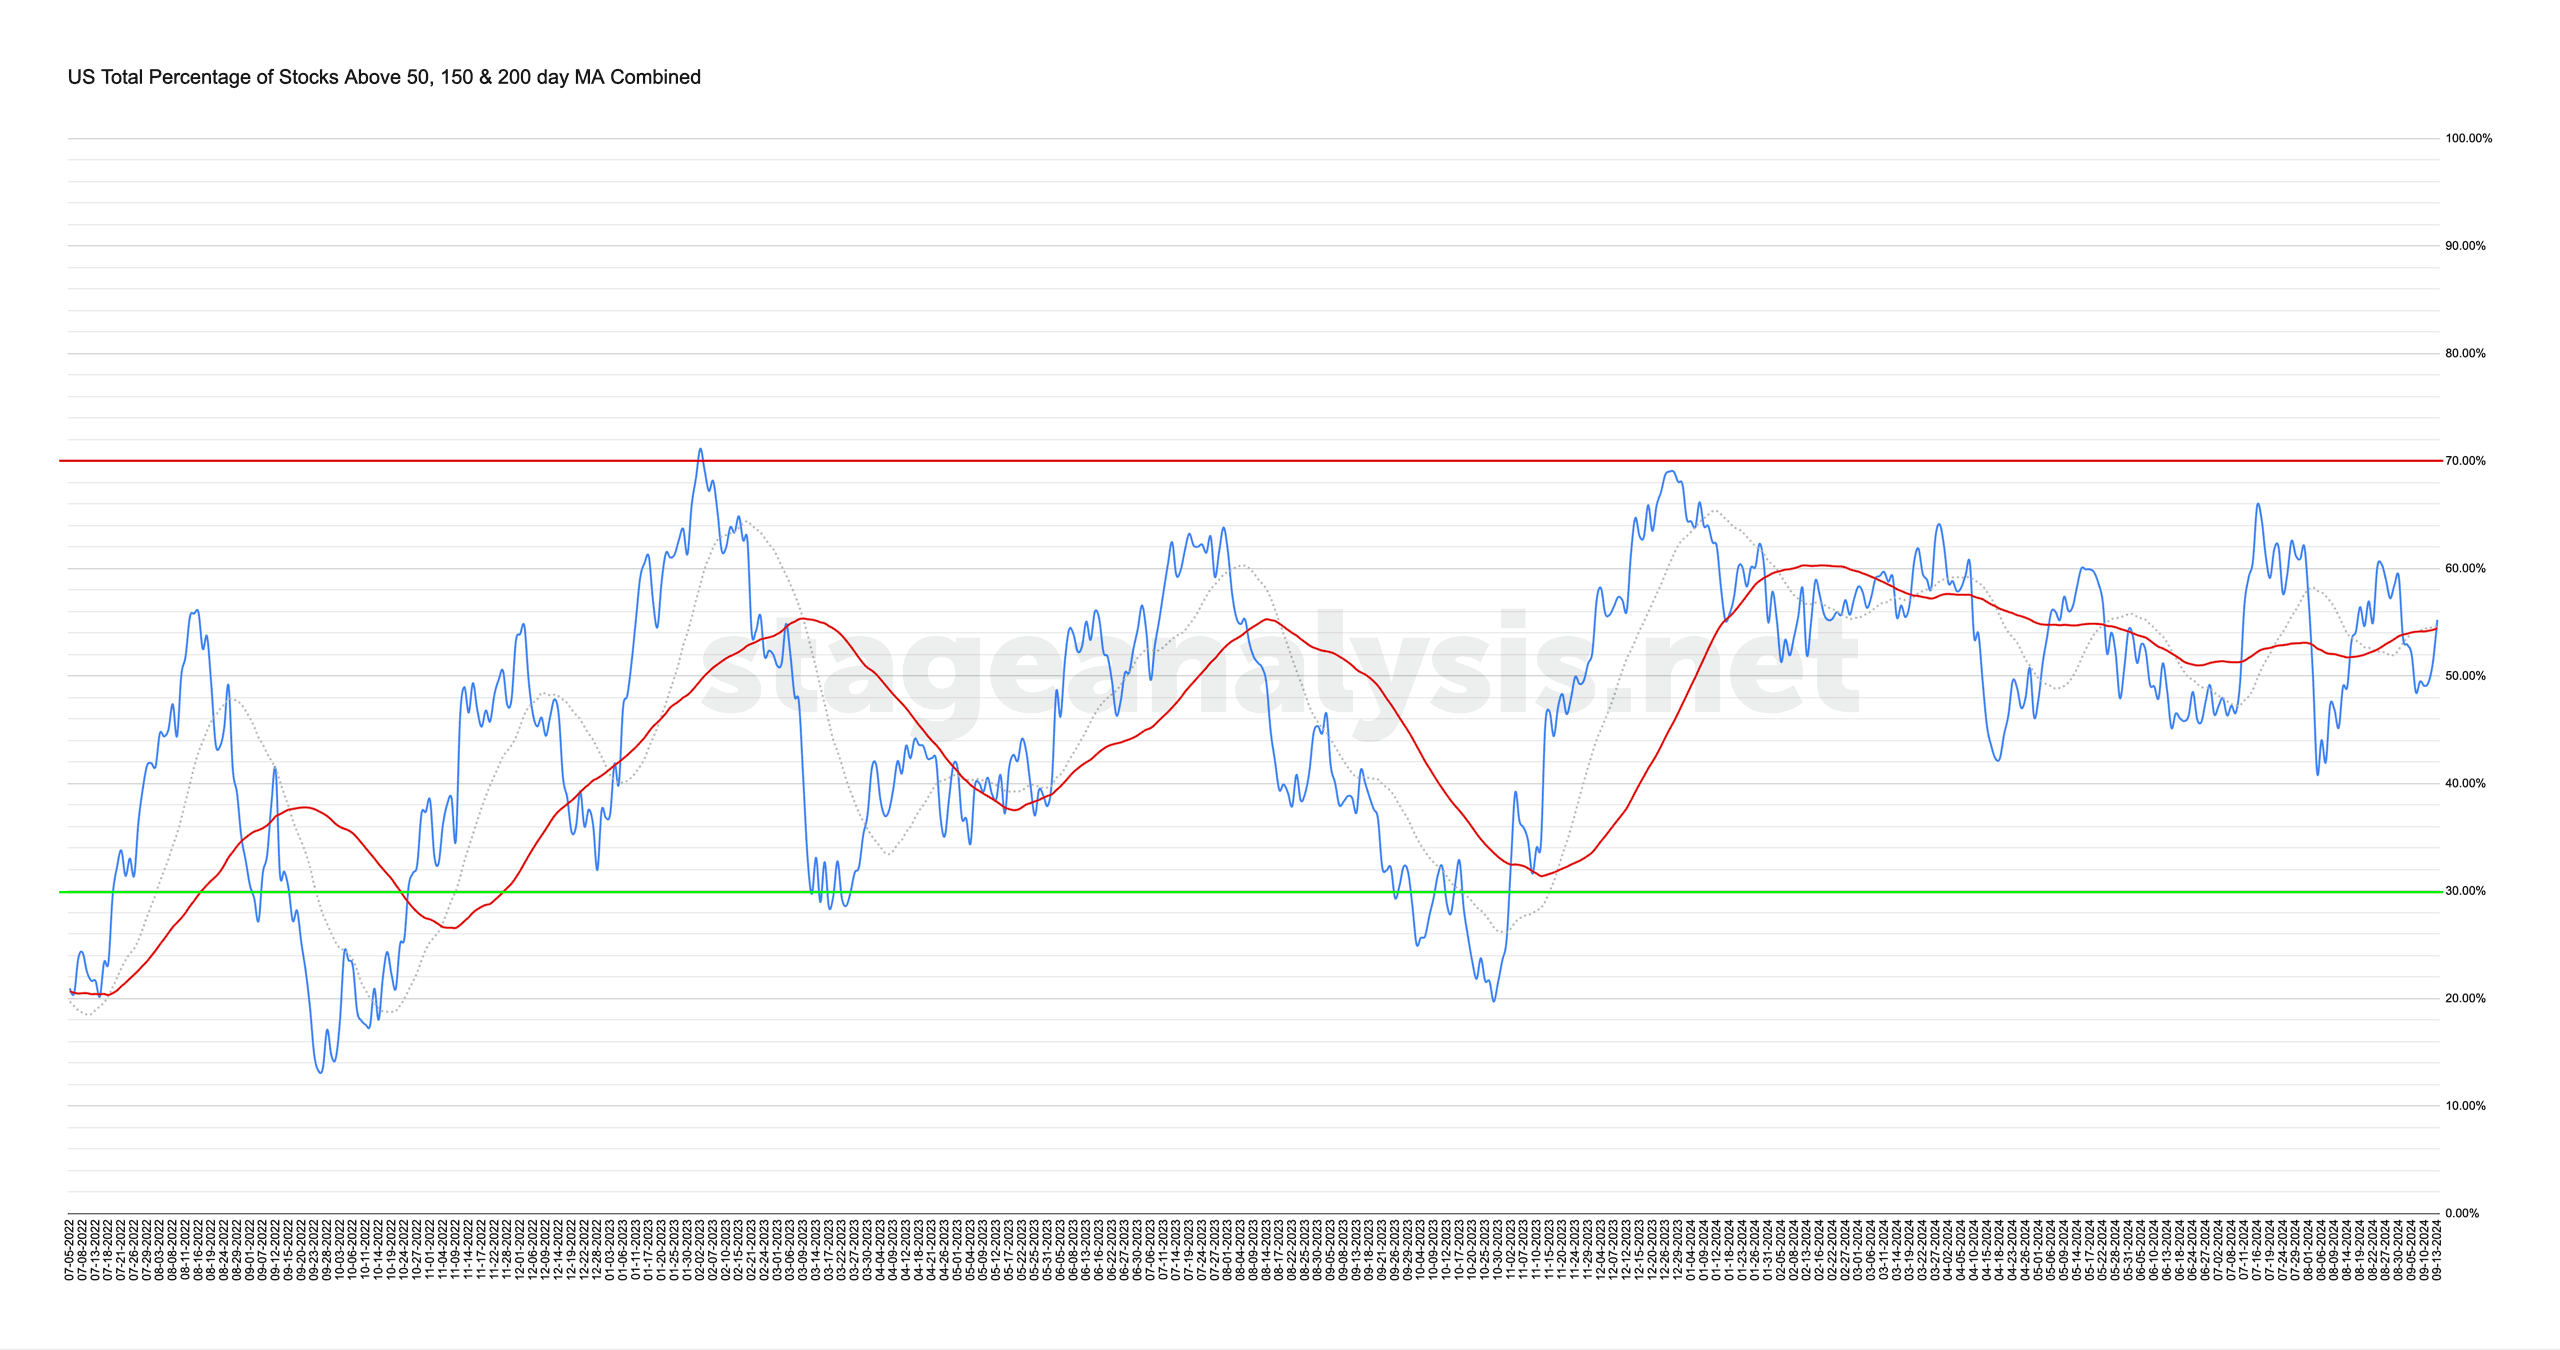
Market Breadth: Percentage of Stocks Above their 50 Day, 150 Day & 200 Day Moving Averages Combined
The US Total Percentage of Stocks above their 50 Day, 150 Day & 200 Day Moving Averages (shown above) increased by +6.75% this week. Therefore, the overall combined average is at 55.23% in the US market (NYSE and Nasdaq markets combined) above their short, medium and long term moving averages.
Read More
12 September, 2024
US Stocks Watchlist – 12 September 2024
There were 25 stocks highlighted from the US stocks watchlist scans today...
Read More
08 September, 2024
Stage Analysis Members Video – 8 September 2024 (54mins)
Stage Analysis members weekend video discussing the US Watchlist Stocks in detail on multiple timeframes, the Significant Weekly Bars, the Sectors and Sub-industries Bell Curves and RS Rankings, the key Market Breadth Charts to determine the Weight of Evidence, Bitcoin & Ethereum and the Major US Stock Market Indexes Update.
Read More
07 September, 2024
Market Breadth: Percentage of Stocks Above their 50 Day, 150 Day & 200 Day Moving Averages Combined
The US Total Percentage of Stocks above their 50 Day, 150 Day & 200 Day Moving Averages (shown above) decreased by -10.80% this week. Therefore, the overall combined average is at 48.48% in the US market (NYSE and Nasdaq markets combined) above their short, medium and long term moving averages.
Read More
05 September, 2024
US Stocks Watchlist – 5 September 2024
There were 26 stocks highlighted from the US stocks watchlist scans today...
Read More
01 September, 2024
Stage Analysis Members Video – 1 September 2024 (46mins)
Stage Analysis members weekend video starting with a discussion of the new User Chartlists feature and how to use it, followed by the US Watchlist Stocks in detail on multiple timeframes, the Significant Weekly Bars, the Sectors and Sub-industries Bell Curves, the key Market Breadth Charts to determine the Weight of Evidence and the Major US Stock Market Indexes Update.
Read More
31 August, 2024
Market Breadth: Percentage of Stocks Above their 50 Day, 150 Day & 200 Day Moving Averages Combined
The US Total Percentage of Stocks above their 50 Day, 150 Day & 200 Day Moving Averages (shown above) decreased by -0.84% this week. Therefore, the overall combined average is at 59.28% in the US market (NYSE and Nasdaq markets combined) above their short, medium and long term moving averages.
Read More
29 August, 2024
US Stocks Watchlist – 29 August 2024
There were 17 stocks highlighted from the US stocks watchlist scans today...
Read More