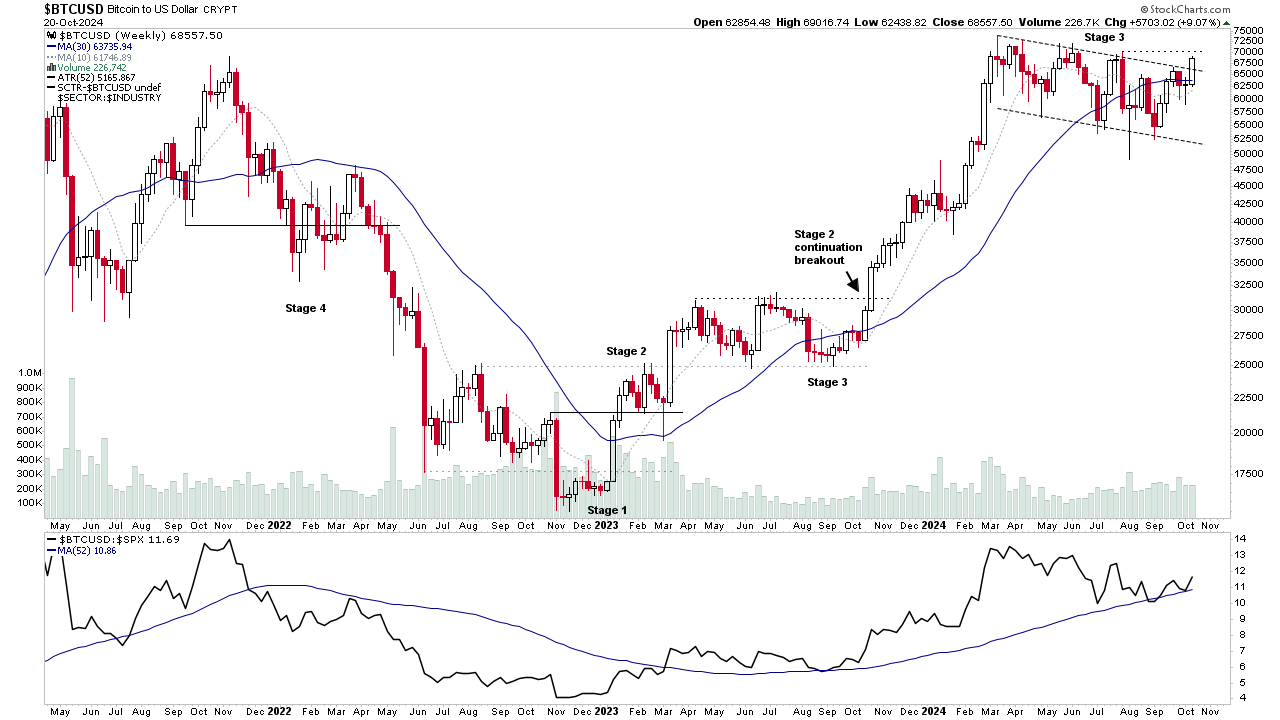
Stage Analysis members weekend video beginning with a discussion of the Stages of the major crypto coins – Bitcoin, Ethereum etc. Followed by the regular content of the US Watchlist Stocks in detail on multiple timeframes, Significant Bars, the Industry Groups Relative Strength (RS) Rankings, the Sector breadth and Sub-industries Bell Curves, the key Market Breadth Charts to determine the Weight of Evidence, and the Major US Stock Market Indexes Update.
Read More

Blog
20 October, 2024
Stage Analysis Members Video – 20 October 2024 (1hr 12mins)
19 October, 2024
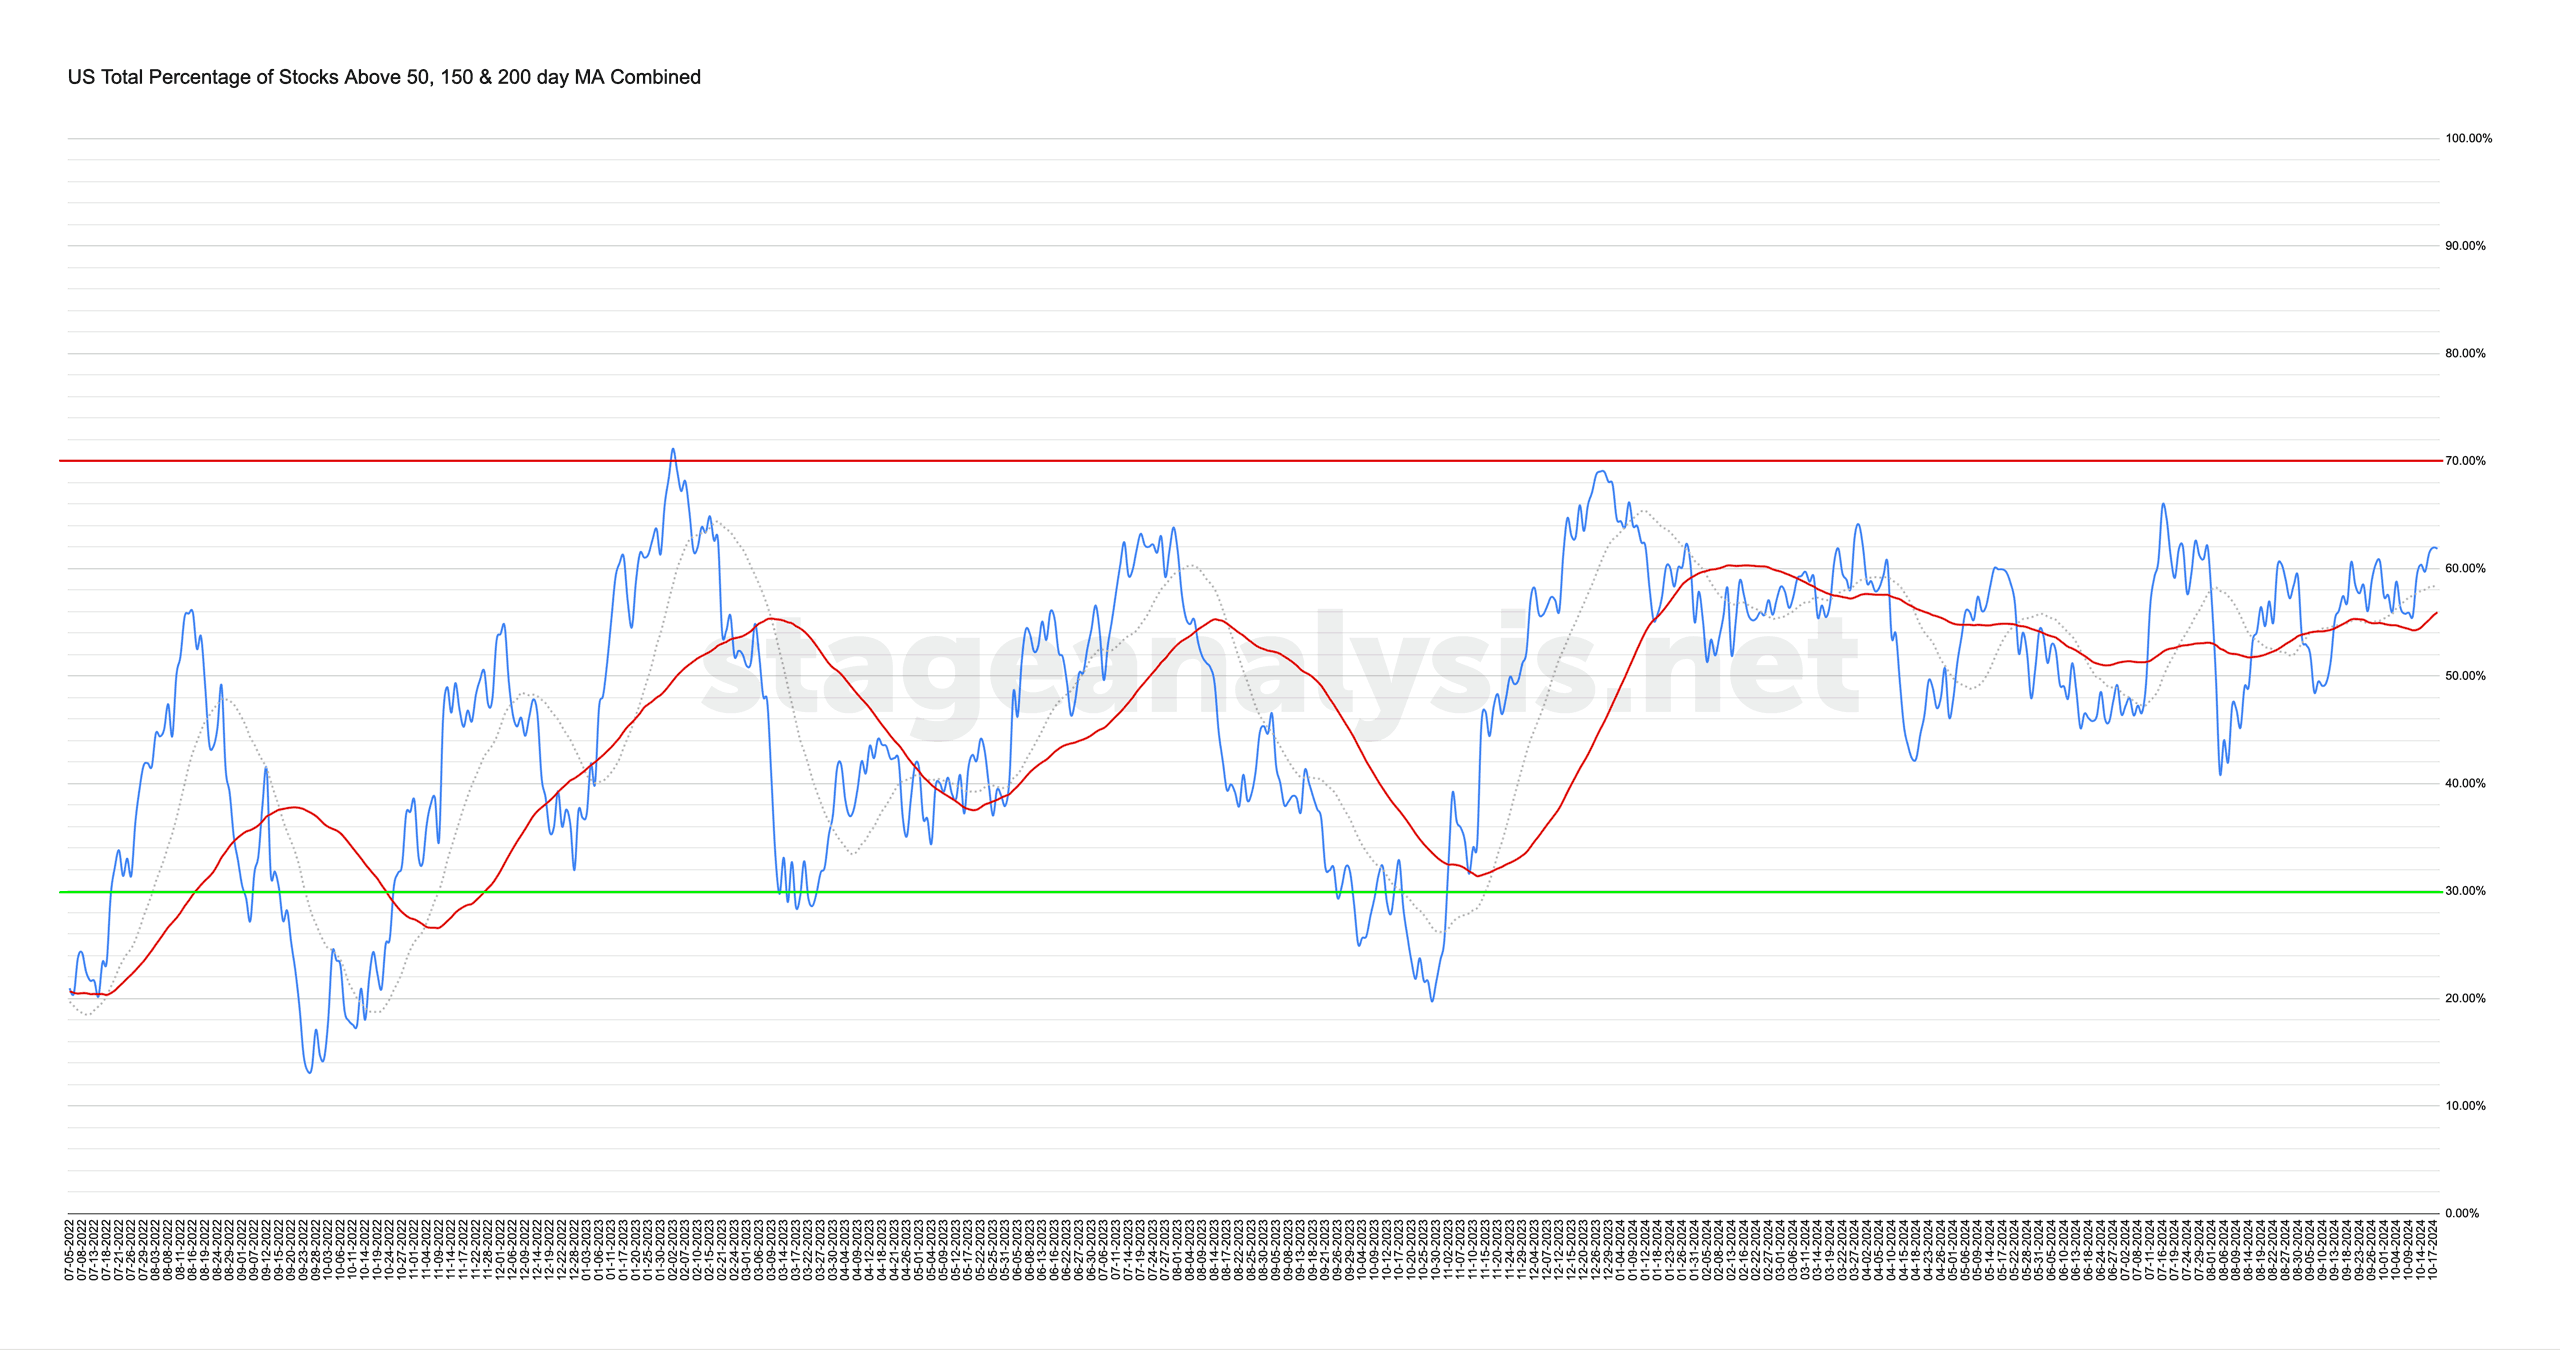
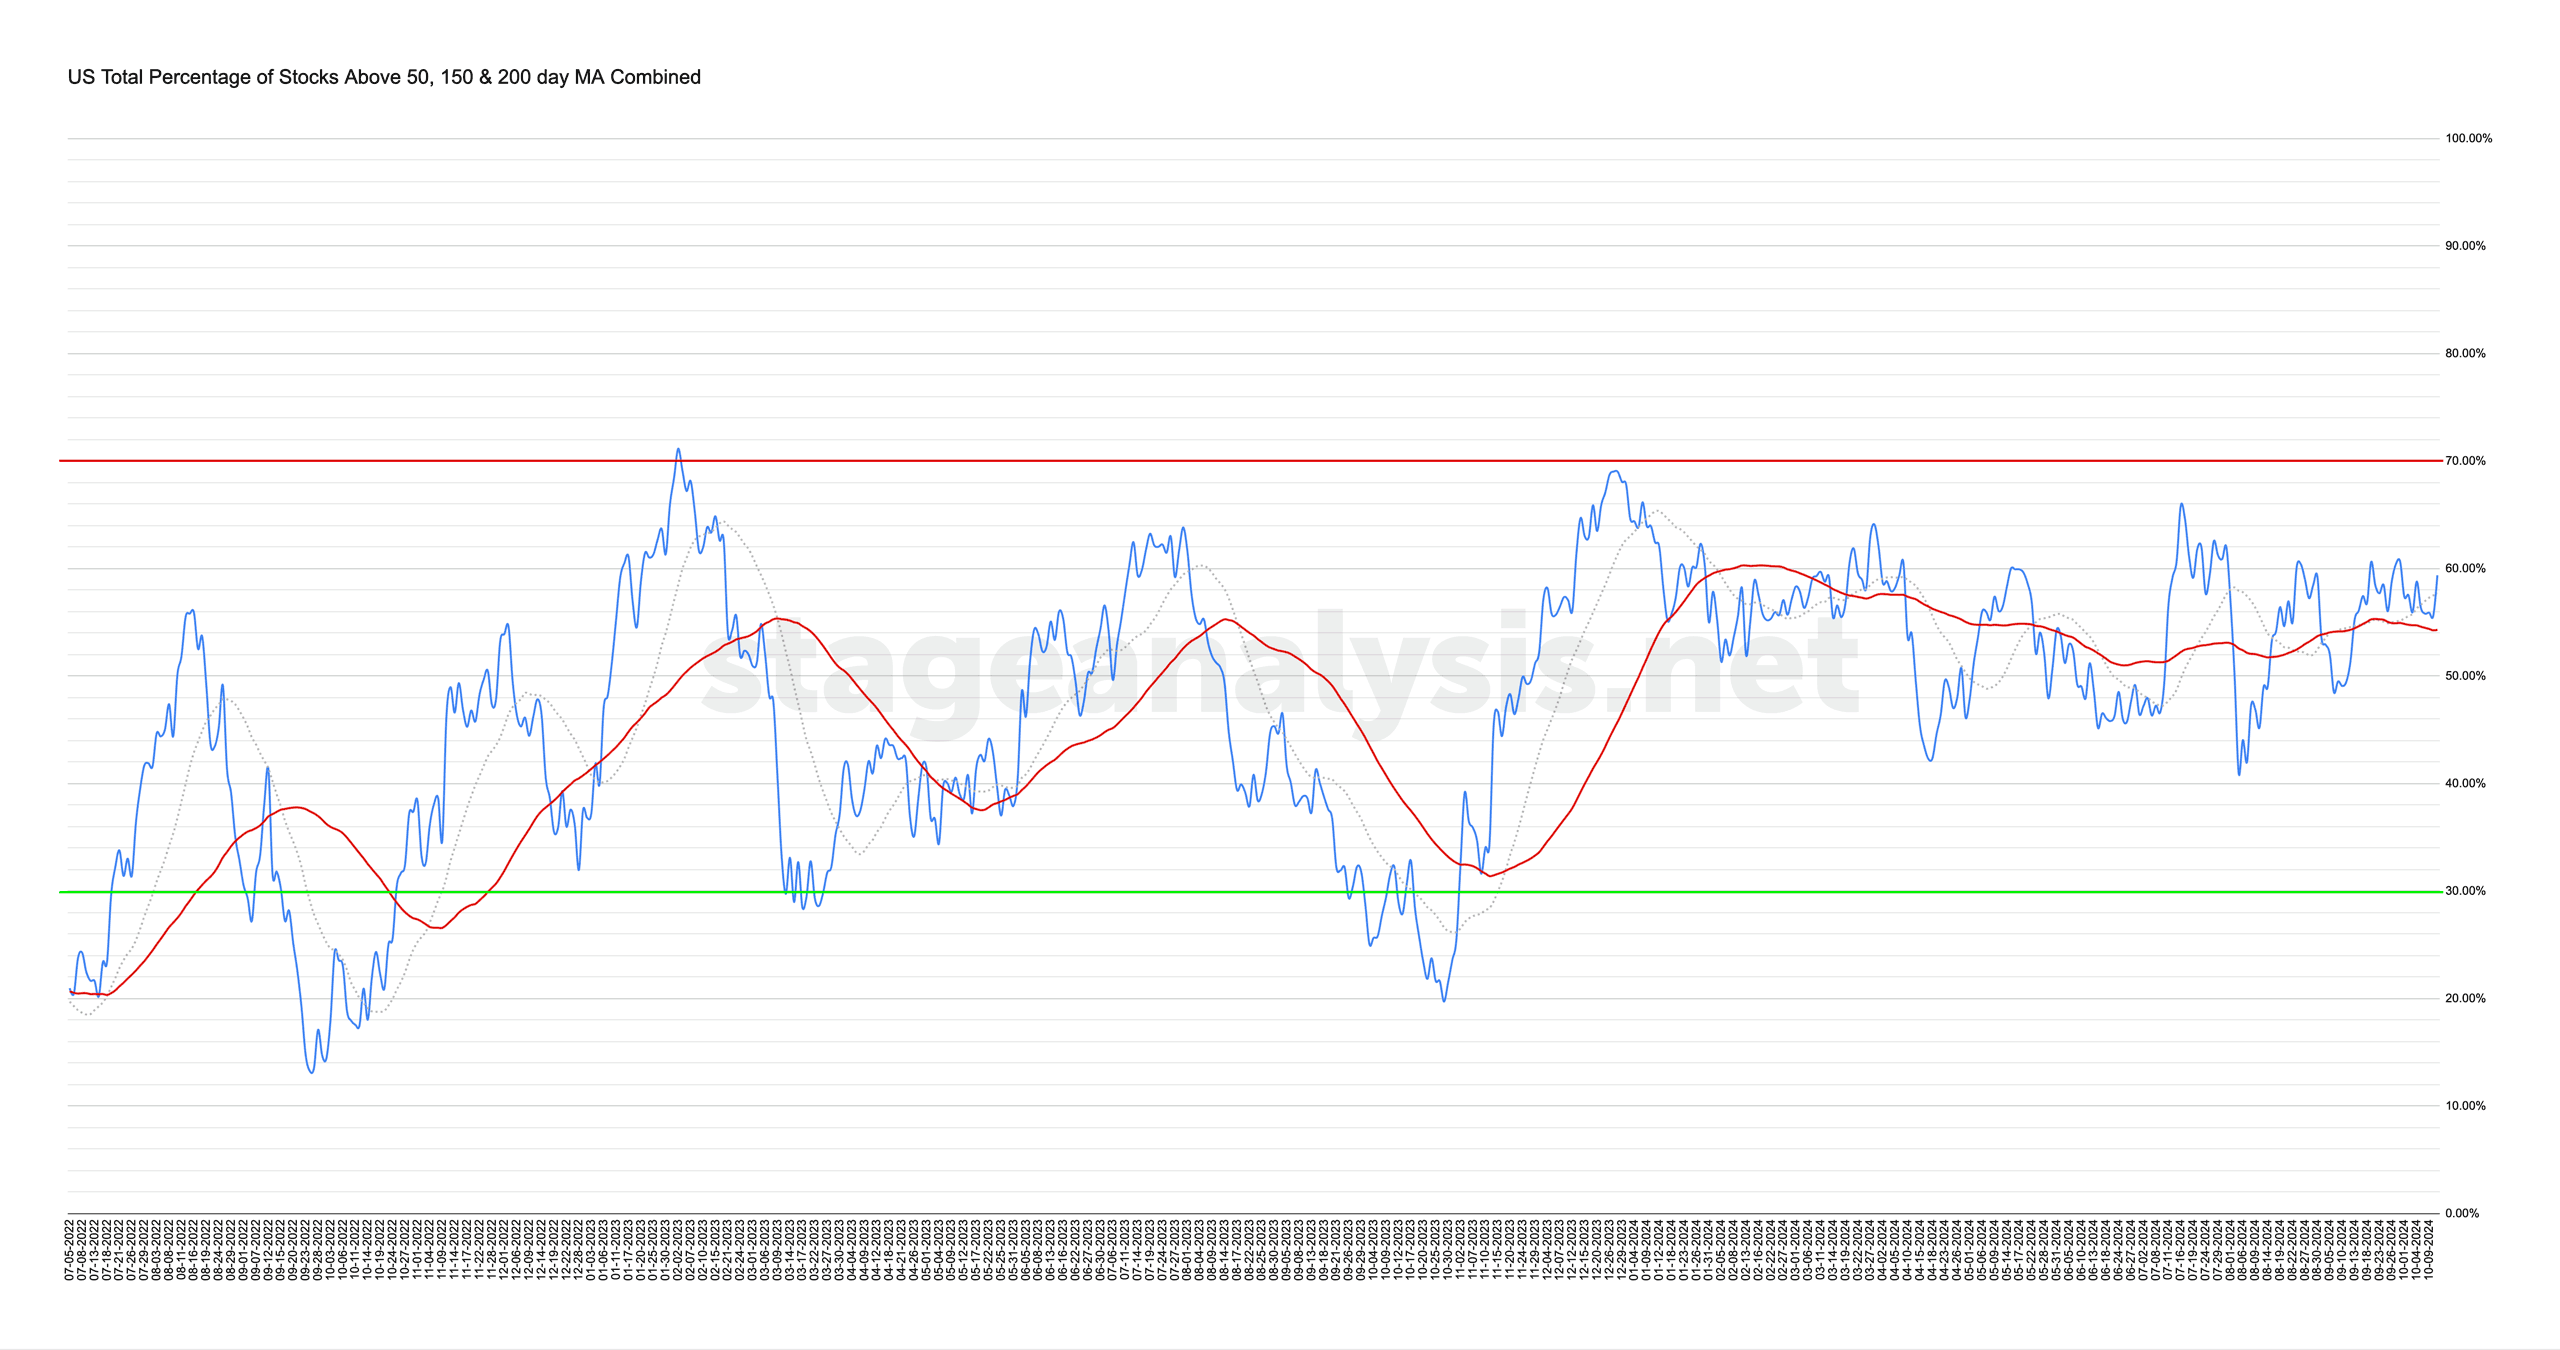
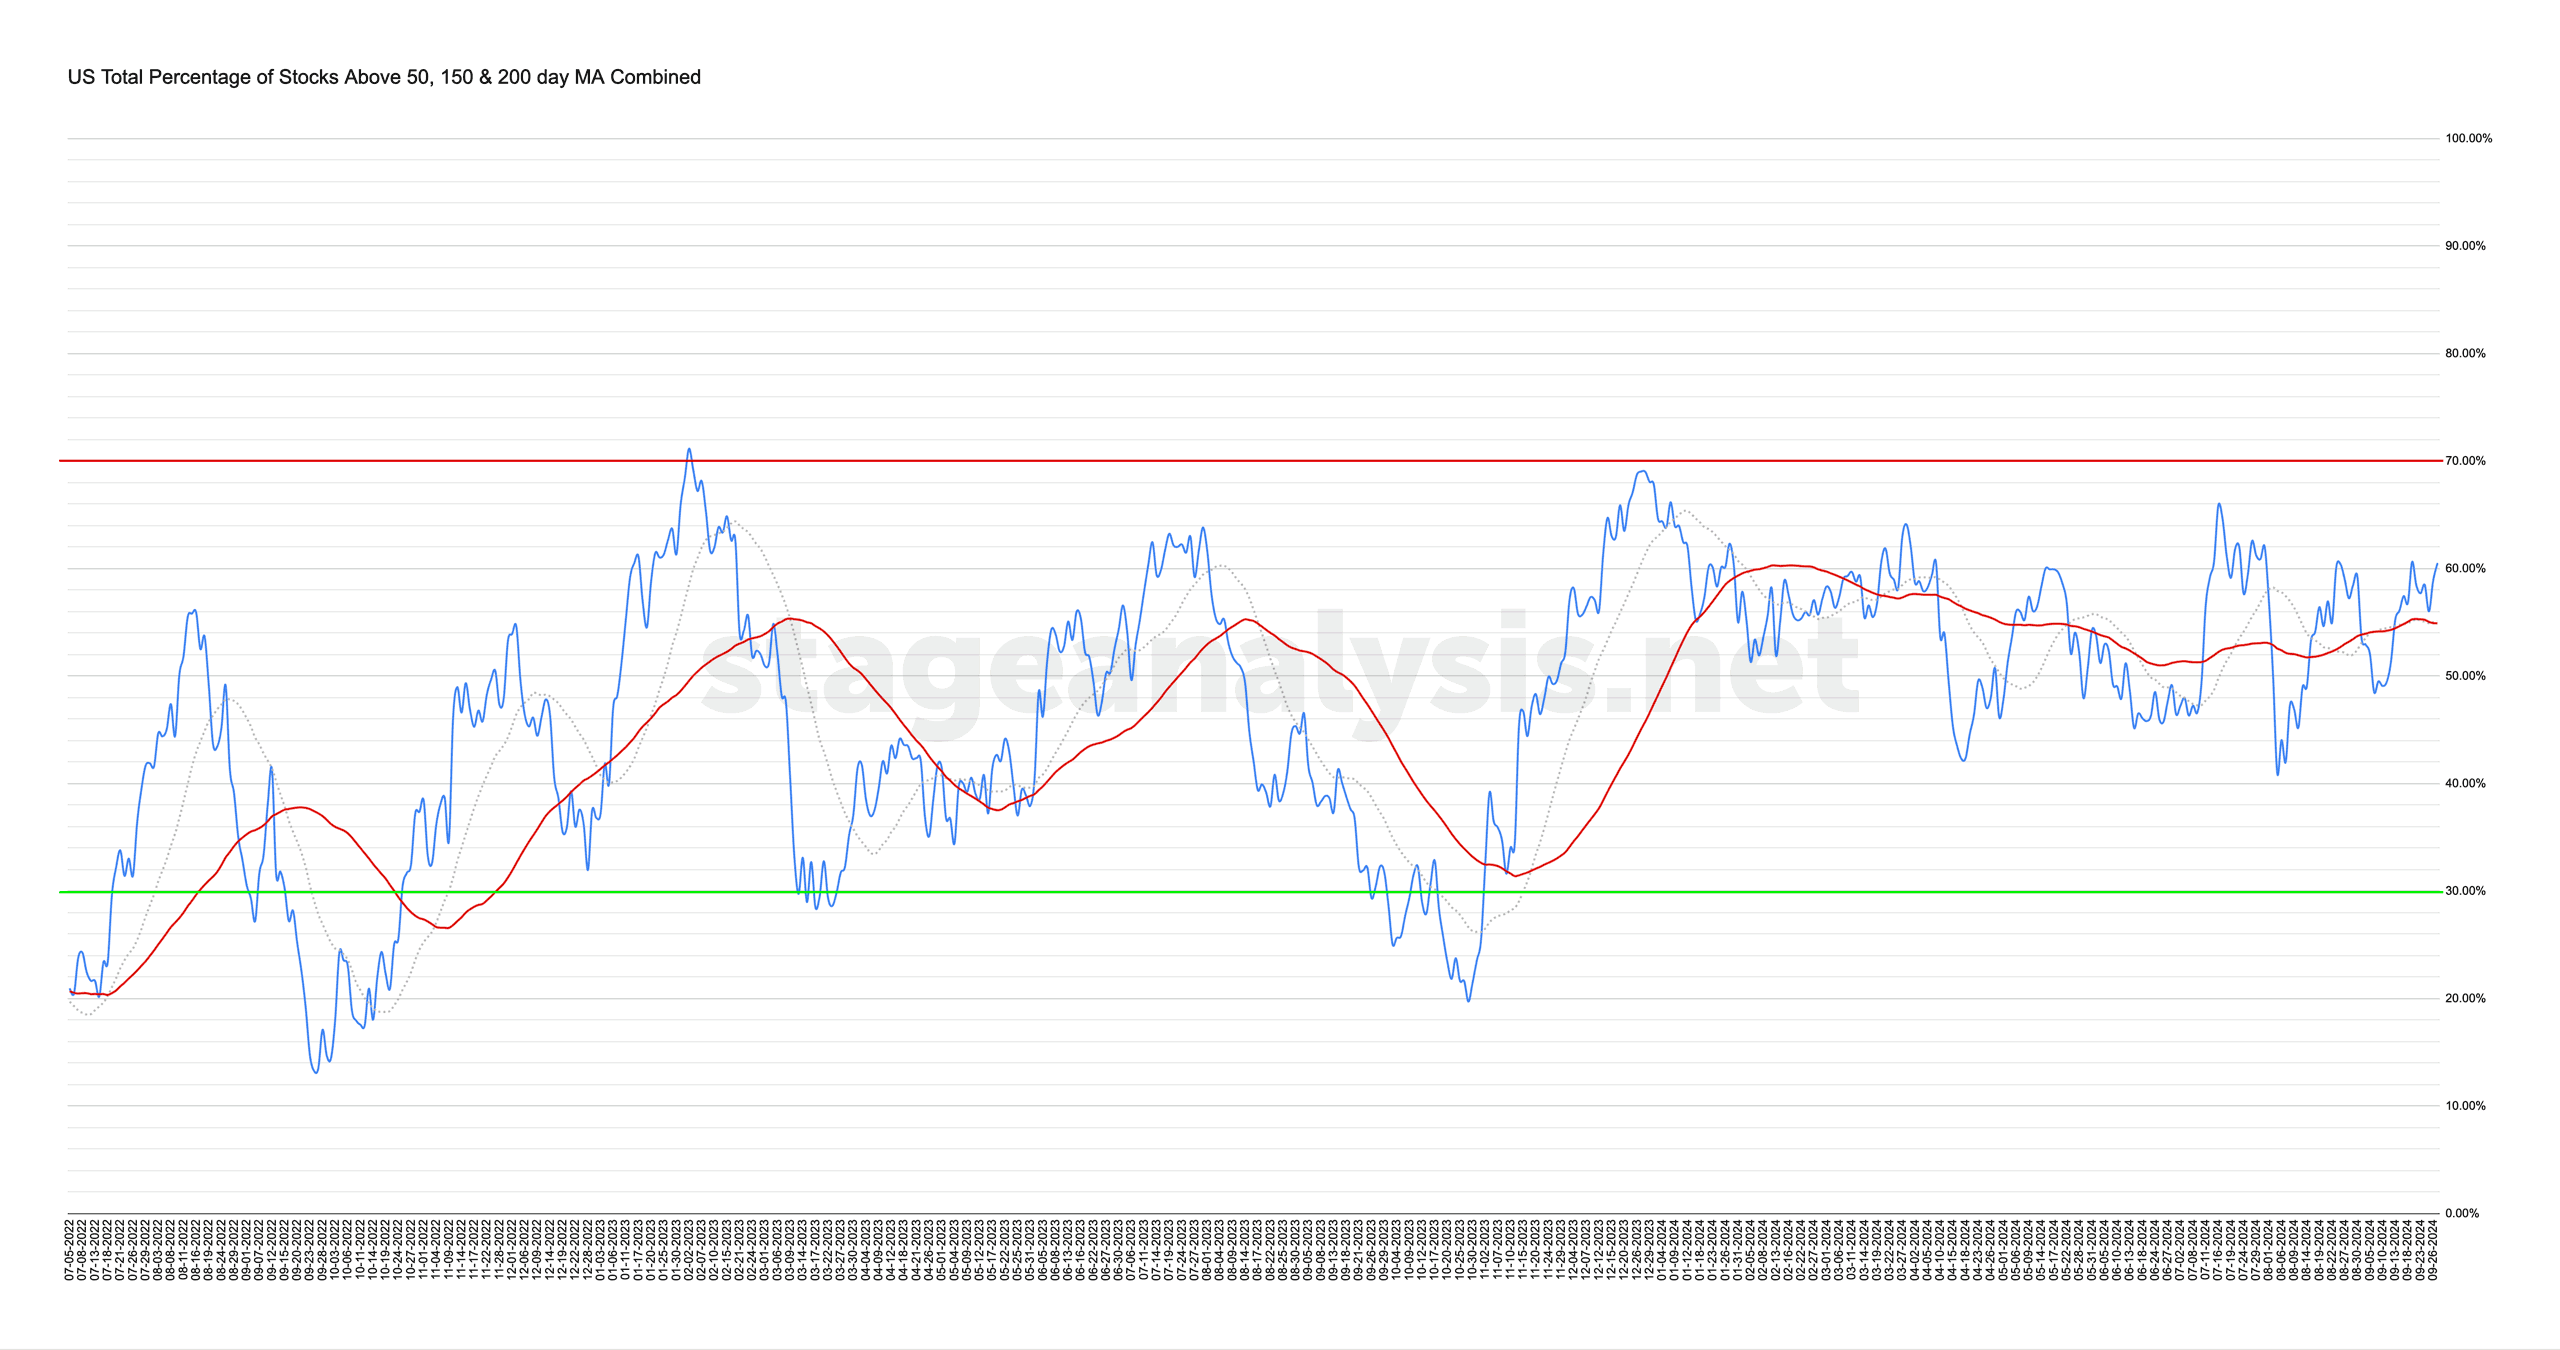
Market Breadth: Percentage of Stocks Above their 50 Day, 150 Day & 200 Day Moving Averages Combined
The US Total Percentage of Stocks above their 50 Day, 150 Day & 200 Day Moving Averages (shown above) decreased by +2.46% this week. Therefore, the overall combined average is at 61.84% in the US market (NYSE and Nasdaq markets combined) above their short, medium and long term moving averages.
Read More
18 October, 2024
US Stocks Watchlist – 17 October 2024
There were 15 stocks highlighted from the US stocks watchlist scans today...
Read More
15 October, 2024
Video: Market Breadth Update - 14 October 2024
Video discussing the key market breadth charts, including the Moving Averages breadth, Bullish Percent Index, Advance Decline Lines, New Highs - New Lows and the unique SATA breadth measures on the website.
Read More
12 October, 2024
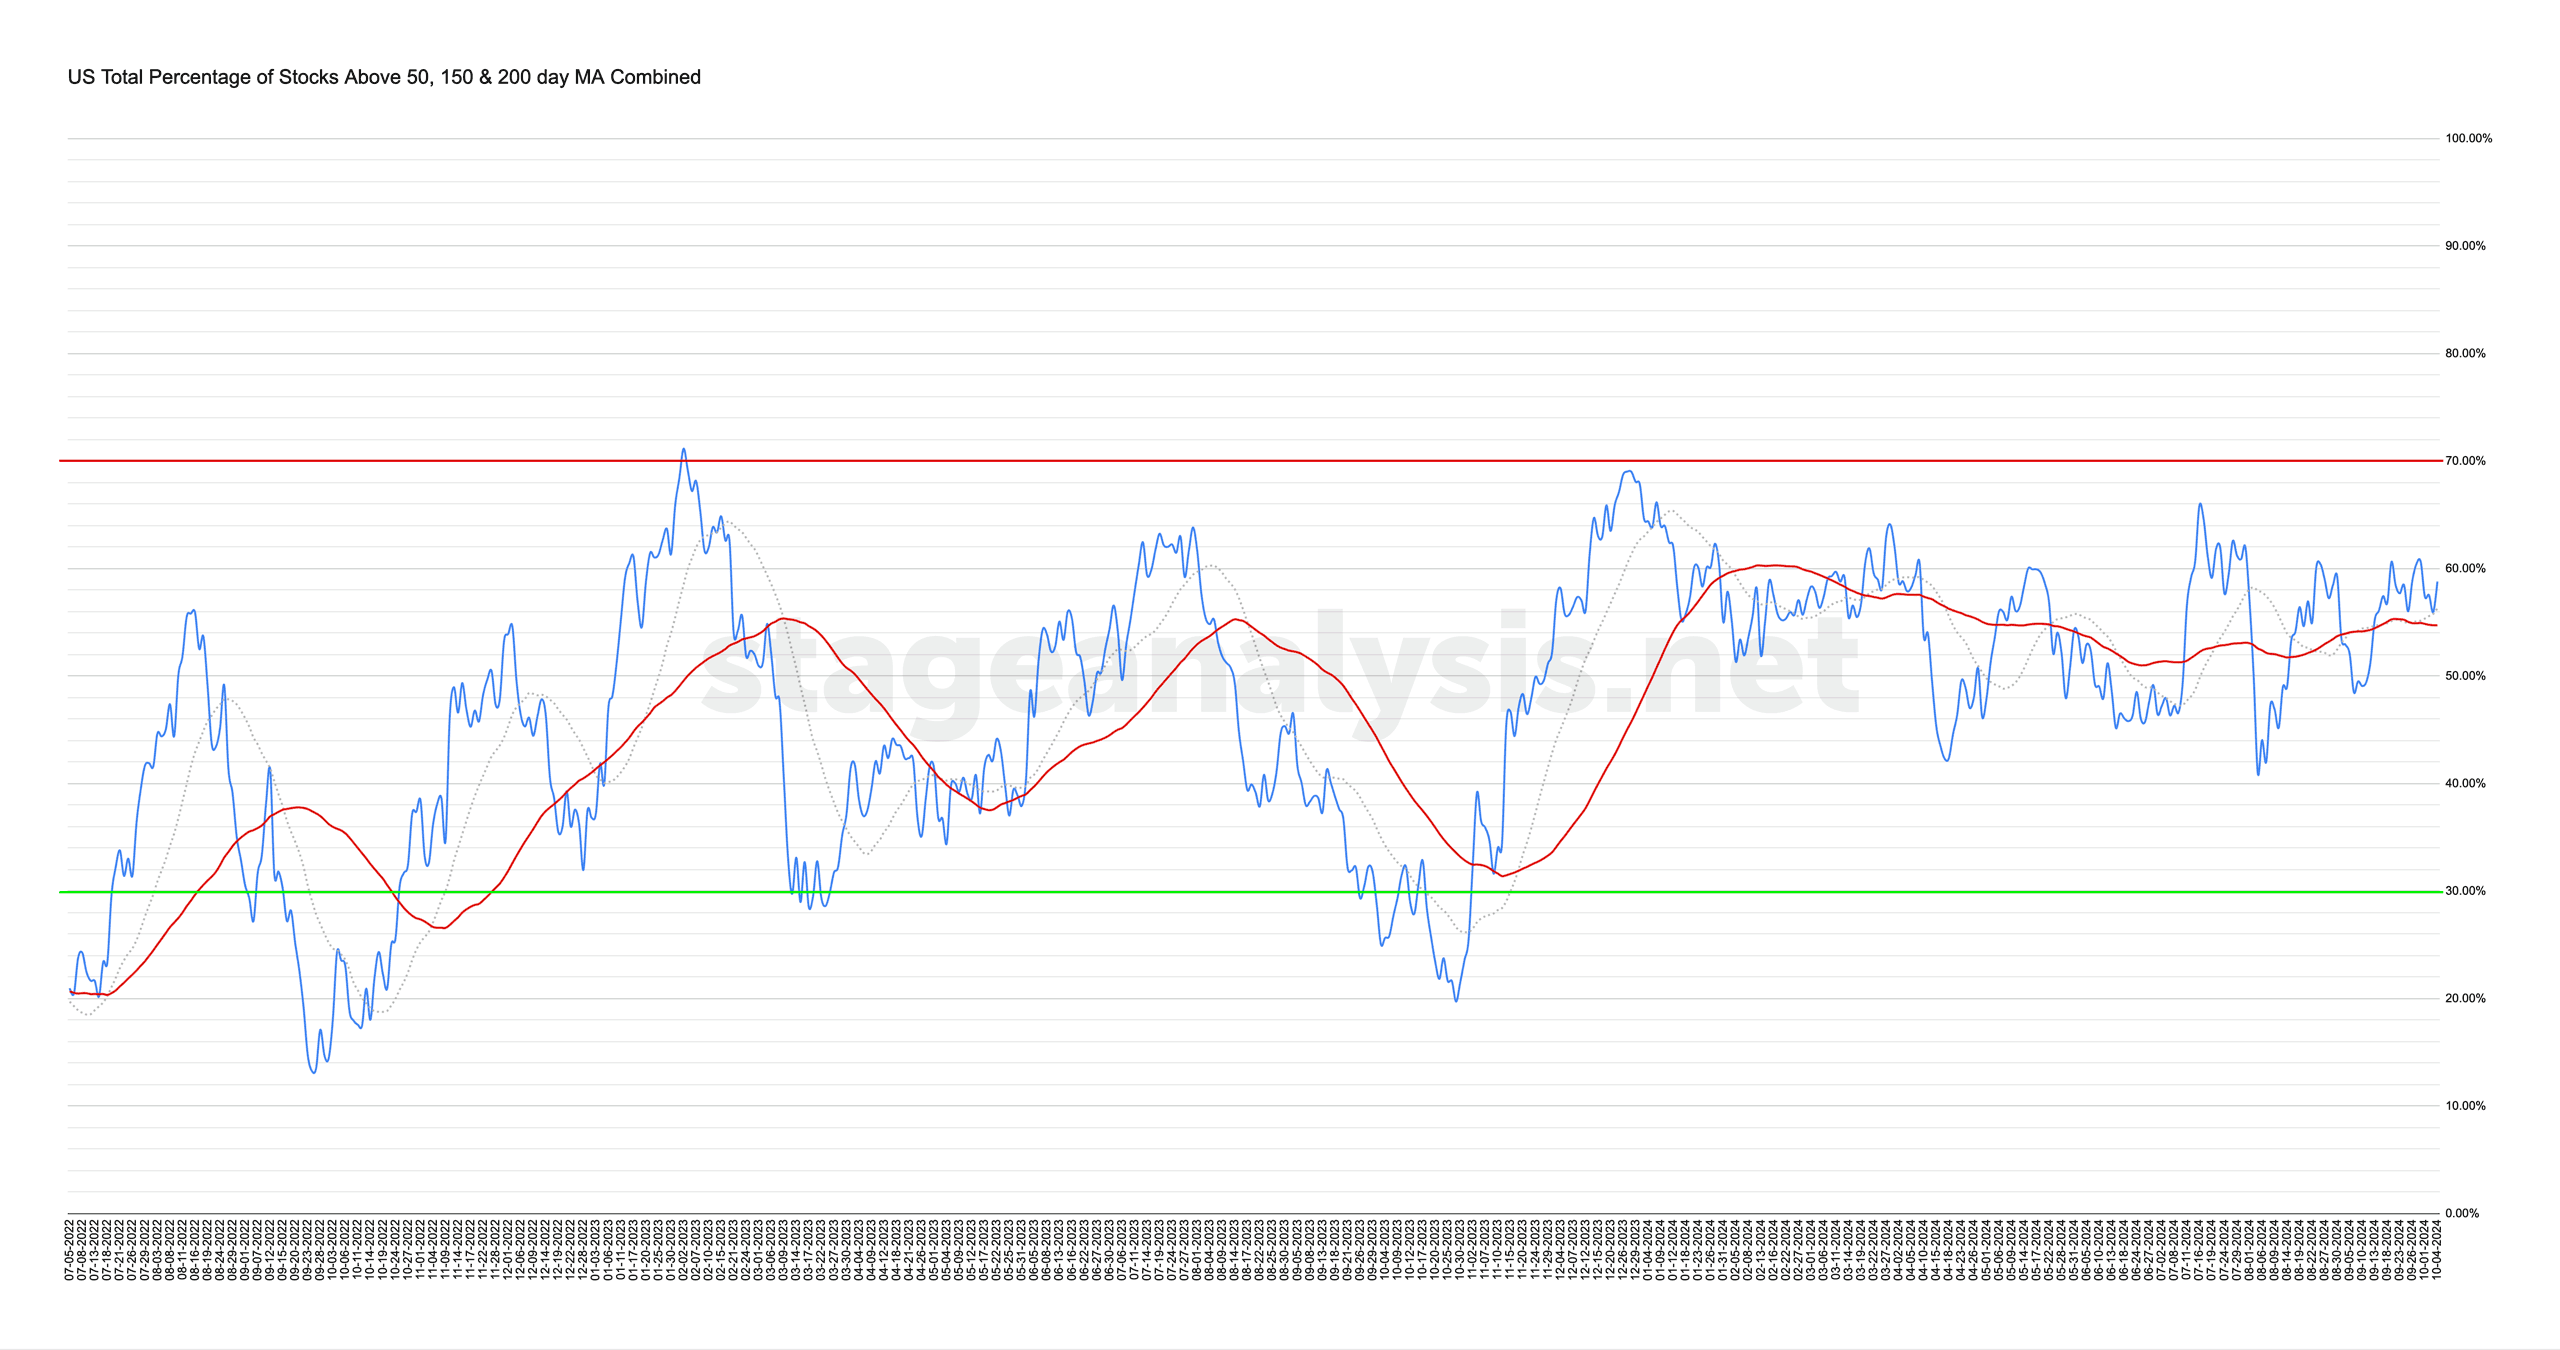
Market Breadth: Moving Averages
The US Total Percentage of Stocks above their 50 Day, 150 Day & 200 Day Moving Averages (shown above) increased by +0.58% this week. Therefore, the overall combined average is at 59.37% in the US market (NYSE and Nasdaq markets combined) above their short, medium and long term moving averages.
Read More
06 October, 2024
Stage Analysis Members Video – 6 October 2024 (52mins)
Stage Analysis members weekend video discussing of the US Watchlist Stocks in detail on multiple timeframes, the Sectors and Sub-industries Bell Curves and RS Rankings, the key Market Breadth Charts to determine the Weight of Evidence, and the Major US Stock Market Indexes Update.
Read More
05 October, 2024
Market Breadth: Percentage of Stocks Above their 50 Day, 150 Day & 200 Day Moving Averages Combined
The US Total Percentage of Stocks above their 50 Day, 150 Day & 200 Day Moving Averages (shown above) decreased by -1.65% this week. Therefore, the overall combined average is at 58.79% in the US market (NYSE and Nasdaq markets combined) above their short, medium and long term moving averages.
Read More
29 September, 2024
Video: New Features – Sector, Group, Industry and Sub-Industry Charts Added – 29 September 2024
Sector, Group, Industry and Sub-Industry charts have been added to the Stage Analysis website this weekend. So first part of the weekend video discusses what they are and how to use them in detail. Followed by the weekend US watchlist stocks and the Major US Stock Market Indexes Update.
Read More
29 September, 2024
Market Breadth: Percentage of Stocks Above their 50 Day, 150 Day & 200 Day Moving Averages Combined
The US Total Percentage of Stocks above their 50 Day, 150 Day & 200 Day Moving Averages (shown above) increased by +2.00% this week. Therefore, the overall combined average is at 60.44% in the US market (NYSE and Nasdaq markets combined) above their short, medium and long term moving averages.
Read More
22 September, 2024
Stage Analysis Members Video – 22 September 2024 (48mins)
Stage Analysis members weekend video discussing of the US Watchlist Stocks in detail on multiple timeframes, the Significant Weekly Bars, the Sectors and Sub-industries Bell Curves and RS Rankings, the key Market Breadth Charts to determine the Weight of Evidence, and the Major US Stock Market Indexes Update.
Read More